Pidilite Head and Shoulder Pattern with possible TargetsPidilite is making and head and shoulder pattern, also taking support from 0.618 fibonacci level. It is also a support level. If overall market sentiments will be bearish in next few days also the stock breaks support and restes, it will be a good short opportunity but at the same the stock is all time bullish stock it can also keep time correction for 2 months instead of price correction. current p/e is 100 expensive. This is not a trade idea. Its just observation.
Trade ideas

PIDILITIND - Strong Bullish ReversalNSE: PIDILITIND is closing with a strong bullish reversal candle supported with high volumes.
Today's volumes and candlestick formation indicates strong demand and stock should move to previous swing highs in the coming days.
The stock has been consolidating for the past few days and moving along the trendline which is indicating demand.
One can look for a 8% to 11% gain on deployed capital in this swing trade.
The view is to be discarded in the event of the stock breaking previous swing low.
#NSEindia #Trading #StockMarketindia #Tradingview #SwingTrade
Disclaimer:
This is for educational purposes only.

Breakout in PIDILITE INDUSTRIESBreakout in PIDILITE INDUSTRIES
Entry: CMP
Targets: 2450 & 2530
DISCLAIMER: The ideas shared are only for educational purpose. The markets are very volatile, so plan your trades accordingly. Please trade with stop loss. I am not SEBI registered.

Pidilite hits all targetAll target achieved within three days
# intraday setup worked all 3 days
Hit all the target


#Pidilite India Harmonic #Pidilite India near to profit booking zone
Target -2810
SL-2393
CMP:2599 @ 4 January 2022

Yesterday follow up of intraday sessionWe are still in .
Will take entry again or hold if we cross 1 he high.
I affirm will achieve target 2 long tomorrow if we cross 1h high.
#intraday

PIDILITE breakout & retest 2770 zone great risk rewardPidilite broke resistance of 2764 (high of 13th Jan 2022) on 2nd Sept and if now price retesting this zone which will act now as a support. Entry near 2770-2780 price range will give great risk reward for swing traders. Targets as per Fib are 1) 3112 2) 3471. SL any day closing below 2750, with risk of Rs 20 reward of 300 will give 1:15, put alert and when you get entry go for it.


Pidilite LongGo long in pidilite above the given resistance and follow the levels for SL and targets

#PIDILITINDThe range for candle shunting on weekly charts
activated as it crossed2290.85 and then with
momentum zoomed to 2721 and now 2866.7

trade setup for the stock = this stock is expected to touch the REWARD level as shown in chart - in 1 hour timeframe.

#PIDILITIND2307 to 2475 is the support on Weekly
A retest here an be an entry
Current levels are good for intraday on CCI 8 5 < -135 while CCI 34 30 > 100

BULLISH BREAKOUT PIDILITE (FEVICOL KA MAJBUT JOD)Pidilite gives a bullish breakout on weekly chart it gives a breakout on horizontal resistance trendline and close above also given a breakout on Bollinger bands, volumes also jumping from previous so we can say it gives breakout on volume indicator too we can see more bullishness in coming sessions.
CAUSE OF LONG-:
1- Horizontal resistance trendline breakout.
2- Bollinger bands breakout.
3- Volume Breakout.
4- Combination of Breakouts.

Pidilite Ind b.o. of pattern resistance yesterday it break resistance of pattern today sustaining above it : as very long term risky can ride long upmove with appropriate stopout level for risk management. posted as learning via sharing .

PIDILITIND - Ichimoku Bullish Breakout Stock Name - Pidilite Industries Limited
Ichimoku Cloud Setup :
1). Today's close is above the Conversion Line
2). Future Kumo is Turning Bullish
3). Chikou span is slanting upwards
All these parameters are showing bullishness at Current Market Price
and more bullishness AFTER crossing 2826.
#This is not Buy and Sell recommendation to any one. This is for education purpose and a helping hand to learn trading in Market.
# Cloud Trading
# Ichimoku Cloud
# Ichimoku Followers
I hope you all like my analysis.
Please do share your thoughts into comment section.
Please give a like, it motivates me to do analysis.

pidilitind#Positional_Equity_Swing_Share
PIDILITIND
Swing Entry: 2762.30
Quantity: 5
SL: Update Soon

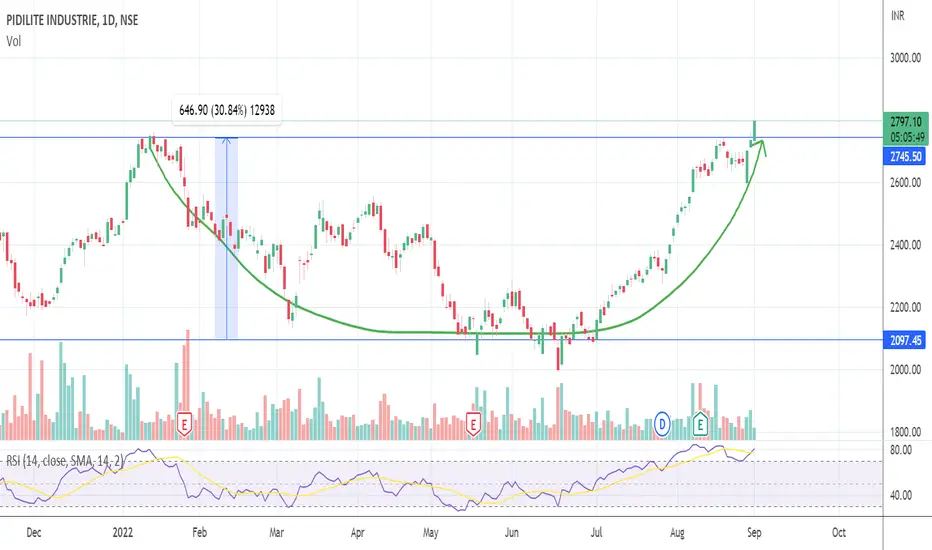
#POSITIONAL STOCKThe Stock Pidilitind has given a breakout of the rounding bottom pattern. 2745 is a breakout level. if this level is maintained by the stock for the coming days it will give big targets in the coming weeks/months/year.
This is just my view, Please do your own study before any trade.
Pidilite ready for a new ATHStock Name: Pidilite Industries
View: Very Bullish
Reasons to Trade: Bear Trap on Daily and Weekly TF. Sustaining above the lower line of the channel.
Entry: Above 2695
Target: 3350-3375
SL: Below 2600
RR: 1:7
P.S.: The view shared is for educational purposes only. Kindly consult your financial advisor before initiating any trade.

Pidilite positive trend but need retrachment due to
important ressistance level
rsi trend also negative

Pidilite BullishPidilite trading above the price engagement area rally may continue further till life time high
concentrate if price sutain above 2640 in 4 hrs

Pidilite: Runaway Bullish formation before 10th Aug ResultsPidilite: Runaway Bullish formation before 10th Aug Results
Bullish breakout from a long term rounding bottom formation with very high positive volume.
Last 8 trading sessions, it's a runaway green candles and bullish kickers. That's pretty uncommon.
A 6months old resistance line is decisively broken this time, after testing thrice.
Most likely the Q1 result will be a bumper result (on next Wednesday).
Cumulative Open Interest (COI) is pretty high and showing long buildup.
OI data is even interesting. 93K Puts are there at 2600, clearly a support. Out of 93K, 39K Puts are added in last week.
There are good amount of (36k) Calls are added at 2640. All of those people will be trapped once Pidilite stays above 2640 on next week.
Plus: There are 54K calls are written in 2660, out of which 53K is added recently.
Support : 2600 (from OI data)
Resistance : 2660 (from IO data), 2700(from OI data), 2725 (previous swing high in chart).

Pidilitind fib levels for swing trade (learning purpose)Pidilitind fib levels for swing trade, Let the hourly candle closes above the entry point to have a succesful trade
