Head and shoulder pattern on pidilite industriesbelow 2100 head and shoulder pattern will get activated, target for 193 on weekly chart. quality stock start accumulating at 1930/1842/1725 last.
Trade ideas

PIDILIT INDIA to take long entryWe have chosen to go long in this bearish for Pidilite India. Long above 2340 TGT 2400-2425-2450 with SL of 2300. The bullish candle has been seen during closing hours and reversal has also been seen during closing candles of the day. RSI also reversing. In this bearish market once the stock move from the buying range to keep safe please trail the SL. This is for your educational purpose only.

Long PidilitindStock Name: #Pidilitind
Action: Buy
Entry: 2440.20
SL: 2402
Target: 2554.30
NSE:PIDILITIND
NSE:PIDILITIND

Buy and Accumalate on PidiliteTrend - Long term Up trend
Volume - Normal
Volatility - High
Momentum - Oversold
Fundamentals very strong with good market outlook.

PIDILI TE INDUSTRIED short term selection for educational purposes only using rsi methodfor educational purposes only using rsi method

Triangle breakout... 15 min chartI see triangle breakout on pidilite industries...
I am not professional trader, plz trade you're own risk...☺


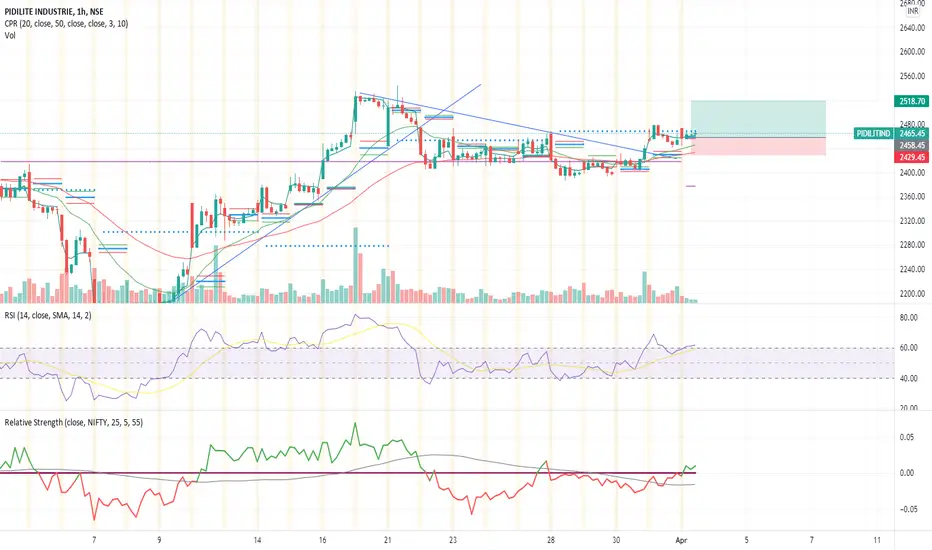
PIDILITIND LONG short swing 1:2 risk rewardCan go long on PIDILITIND Fut with 1:2 Risk reward. RSI and Relative strength good. Broke a trendline and forming rounding bottom.
Disclaimer: Only for educational purposes. Trade at your own risk.
Pidilite, Triangle Breakout, EMA/SMA breakoutPidilite, given a Triangle Breakoutand also closed above EMA/SMA breakout

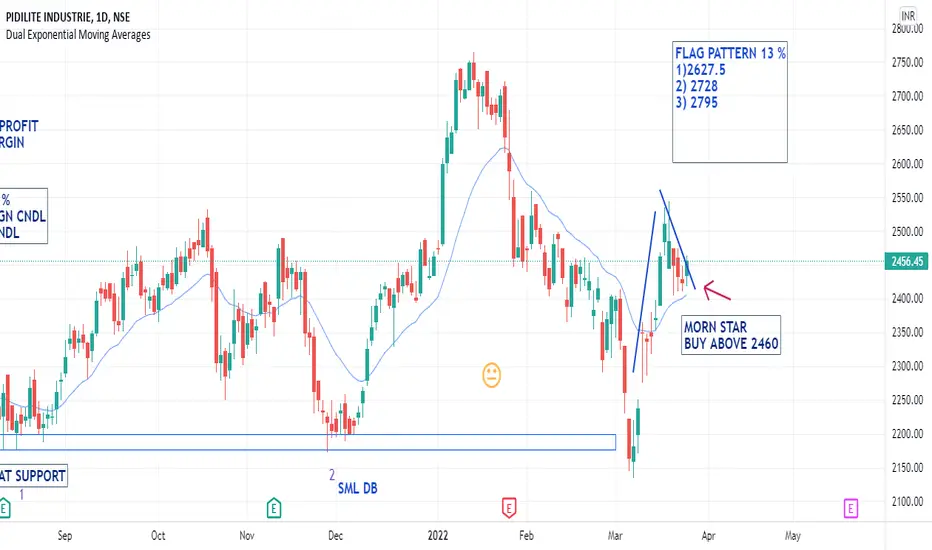
Pidilite Industries Flag Pattern ready to BreakoutPIDILITE Daily Chart
Flag Pattern target 13 %
1) 2627.5
2) 2728
3) 2795
WATCHOUT FOR CHANNEL BREAKOUT A Good correction can be seen in PIDILITE since the month of JAN.
the stock has been respecting the channel indicating a trend reversal.
the stock can be bought at current levels with a SL OF 2293 for a shorterm target of 2500 and further of 2600 and above.
pidilite has also taken support from 200 ema on daily TF
Also the stock is trading at a discounted price and its good to add in portfolio.
************************PLEASE FOLLOW RISK MANAGEMENT***************************************************

PIDILITE LOOKS STRONGS FOR 1 YEAR HOLD#PIDILITE (POSITIONAL PICK)
CMP 2390
TGT 2510, 2750, 2950, 3125, 3400, 3740
SL 2025
Risk Reward (RR) - 1:3.7
Potential Returns :56%
Potential Loss: 15%
Time Frame: Till Feb 2023


Pidilite looks good here to be added for short termWatch the stock for a trend line breakout. Should achieve targets as per levels mentioned on the chart. Above analysis is purely mine and is meant for educational purposes only. Follow a strict stop loss of 2288 after initiating a trade at this level.

EVERGREEN Stocks _ available at "Nothing to loose Zone" !!!!Here are some evergreen stocks which are 25% yearly compounder for last 10yrs with strong fundamentals and available near strong support zone .
-: NSE:PIDILITIND - available @2370 and strong support around 2250-2300.
-: NSE:BERGEPAINT - available @685 and strong support around 650-680 less than 30 rupees risk.
-: NSE:MINDTREE - available @3785 and strong support around 3550-3500.
-: NSE:ABBOTINDIA - available @17380 and strong support around 16000-16300.
-: NSE:HONAUT - available @40360 and strong support around 38000-40000.
-: NSE:RELAXO - available @1222 and strong support around 1130-1160.
-: NSE:VINATIORGA - available @1860 and strong support around 1780-1730.
-: NSE:ALKYLAMINE - available @2982 and strong support around 2950-2800 hardly 100 rupees risk.
-: NSE:APLLTD - available @725 and strong support around 660-720 less than 50 rupees risk.
-: NSE:HLEGLAS - available @5400 and strong support around 5300-5000 less than 4% risk.
-: NSE:SUPPETRO - available @665 and strong support around 600-620
These all are investment grade stocks which will surely compound your capital more than 25%.
"HAPPY INVESTING"

RSI Divergence along with 200 EMA Support for PidiliteRSI Divergence along with price near 200 Daily EMA Support. This makes the fundamentally strong Pidilite Industries good buy for reversal.

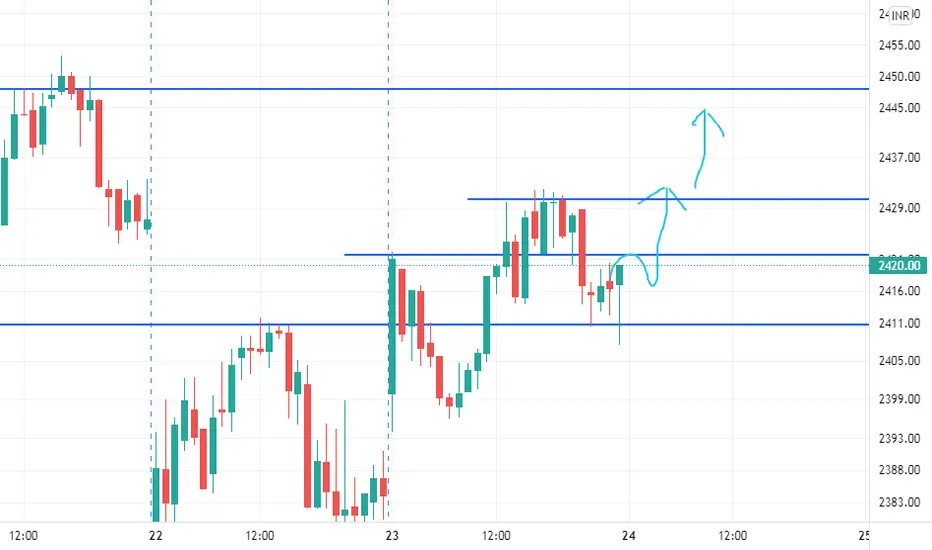
Expecting pidilite to move upsideExpecting pidilite to move upside as it seems short term uptrend is started
Pidilite Cmp 2383 dated 22-2-2022Pidilite Cmp 2383 dated 22-2-2022
1. Bearish H&S Pattern on chart
2. Sell below 2375
Sell for a tgt of 2325-2275-2200 SL 2450
It is just a view, pls trade at your own risk.

Pidilite Industries - Short OpportunityShort Opportunity-
Pidilite Industries has formed Inverted Cup & Handle pattern, which indicates that there will be bearish movement expected. This stock retest at neckline Rs. 2384.00, if this stock first candle closes below Rs. 2384.00 level then we can enter this stock. The CPR is narrow and at the downside. Also, MA is headed to the downside. The CCI is near -100.
But we have to be curious because the international market is bearish and very volatile. Let the market settle and only then we can enter.

Pidilite India - Short OpportunityShort Opportunity -
Pidilite has made the head and shoulder pattern, but the pattern is yet to complete. It has strong support on rs. 2423.70. If this stock crossed this level and retests it, there will be a strong bullish movement we can expect. The CPR is narrow and at the downside and CCI is near -100 level, so both indicators are indicating a downtrend. But be cautious before taking any call as the market is very volatile and nowadays it is giving movement in an opposite direction. Give them time to settle the market and then we can enter.

PidiliteImportant Investment levels in case of Crude price pressure...
Fundamentally very good stock. Keep accumulating...
Study based on purely technicals....
For clarity have marked on weekly charts.
Lets Revisit this chart every week...
Will update more info as the movement happens in comment section..
Like... Share... Follow

Long #PIDILITIND for TGT - 2700 , Swing Trade- Reason - 100 DMALong #PIDILITIND for TGT - 2700 , Swing Trade- Reason - 100 DMA

PIDILITE industry on bullish wave 3Pidilite industry cmp-2440 stock is Trading under Gi-3 wave method Expect upside towards 2665
