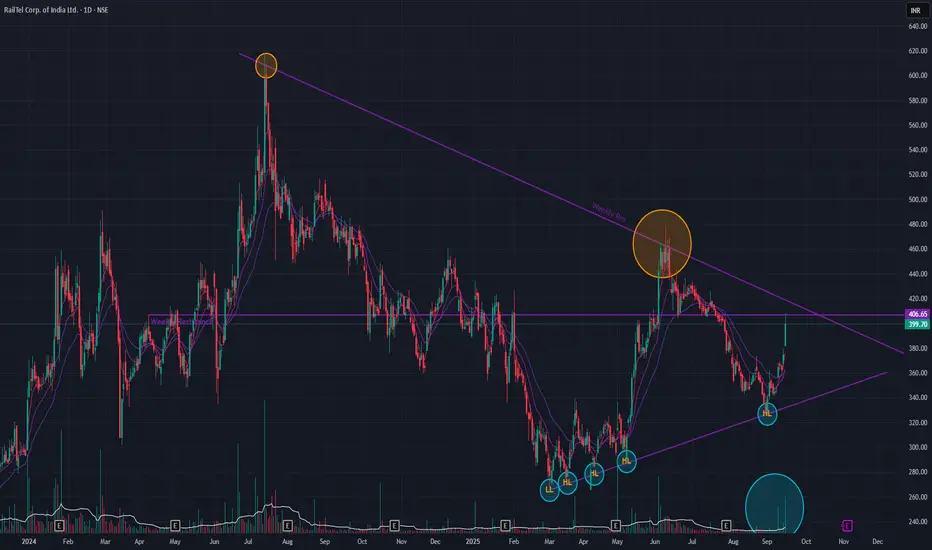
RailTel: Weekly Technical Setup & Key LevelsRailTel – Technical Observation
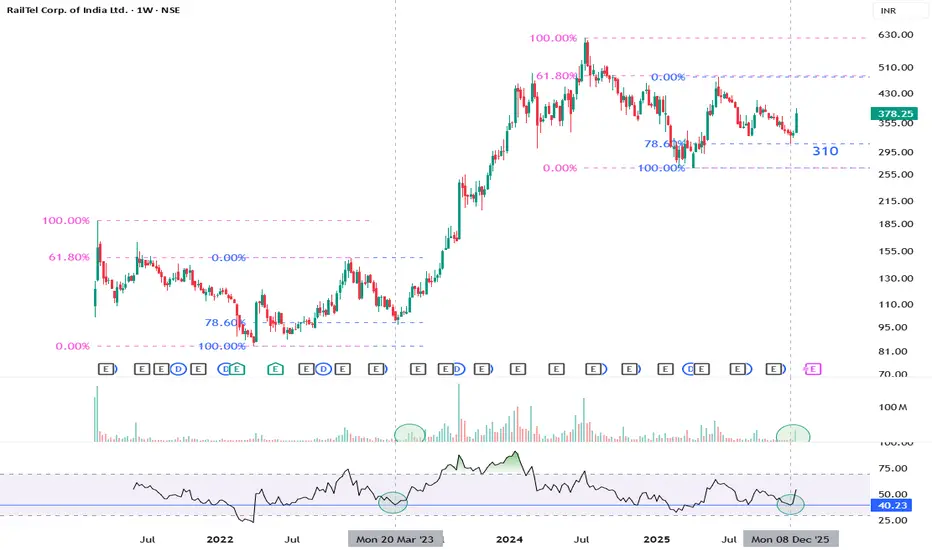
The next weekly candle will be important to assess the strength of the current setup. Volume is currently weak, so stronger volume confirmation would add conviction to the move.
Key levels:
₹245 — Key support zone
₹300 — Resistance zone
₹350 — Next potential resistance zone
I’m watching price action and volume confirmation before drawing further conclusions.
Educational/technical analysis only. Not a recommendation to buy, sell or hold any security.
RailTel Corp. of India Ltd.
No trades
No trades
In-depth trading ideas
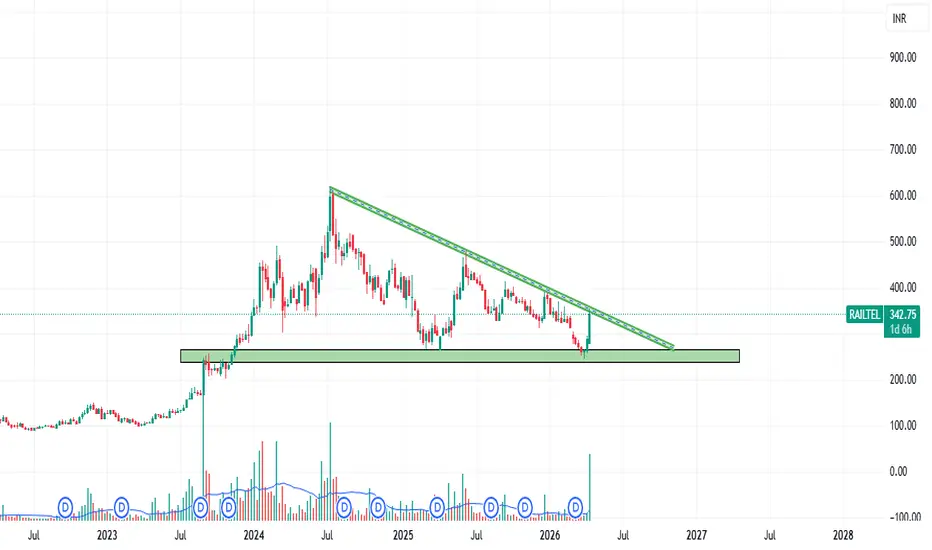
RAILTEL: Perfect Bounce from Demand Zone & Trendline Breakout!🚀 RAILTEL: Perfect Bounce from Demand Zone & Trendline Breakout!
Stock: RailTel Corporation of India Ltd.
Current Price: ₹343.30
Pattern: Trendline Breakout + Strong Support Reversal
📊 Technical Observation:
Strong Support (Demand Zone): The stock has taken perfect support from the horizontal green zone (₹230 - ₹250). This area has acted as a solid floor multiple times, showing strong accumulation.
Trendline Breakout: After months of lower highs, RAILTEL has finally pierced through the Descend
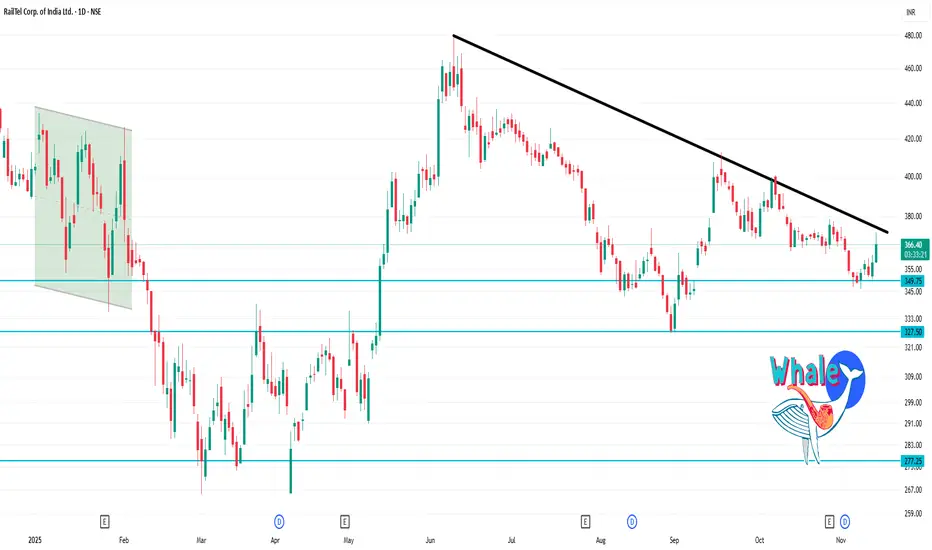
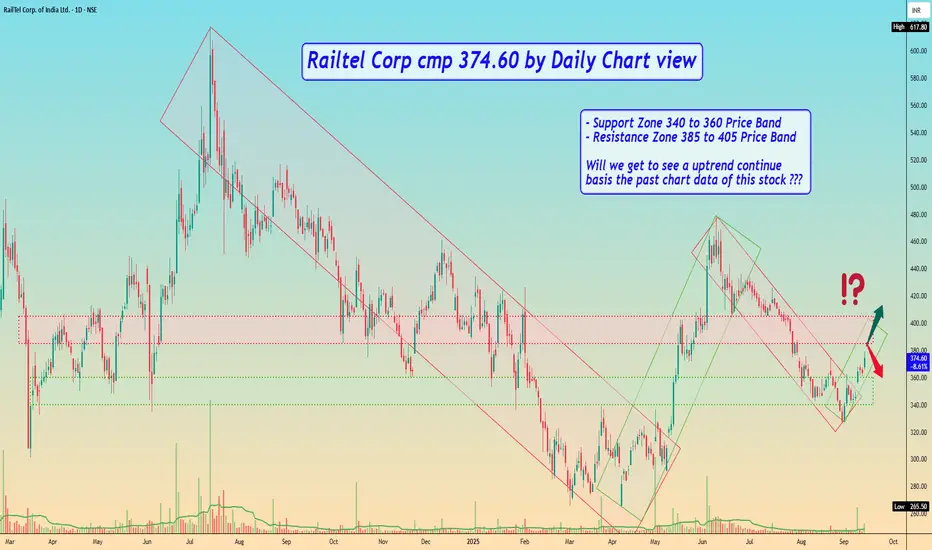
RAILTEL 1 Day Time Frame ✅ Current technicals
On the daily chart, the stock is near ~ ₹365.70 .
RSI(14) is ~ 63.7 → moderate momentum.
Many moving averages (20/50) are showing “buy” signals, but the 200-day is still above current price, giving a mixed picture.
Trend strength (ADX) is relatively weak/neutral, suggesting the move is not strongly trending.
🎯 Key levels (1-day timeframe)
These are approximate support/resistance and pivot levels derived from recent data.
Pivot & immediate levels
Pivot (classic) ~ ₹36
Railtel Corporation of India LtdDate 16.09.2025
Railtel
Timeframe : Day Chart
News Flash :
Government of India to announce tax exemption for Data Center companies/projects for the next 20 years
About
(1) Objective of creating nationwide broadband and VPN services, telecom, and multimedia network, to modernize the train control operation and safety system of Indian Railways.
(2) It is a "Navratna" PSU of the Government of India. At present, RailTel's network passes through around 6,000 stations across the country, co
Railtel (Weekly Timeframes) - Is the trend reversing?After a sustained downtrend since July 2024, Railtel is showing signs of a potential trend reversal , evidenced by the formation of higher lows since March 2025.
Today, the stock exhibited significant bullish momentum, opening with a gap-up and closing with a 6.70% gain on substantial volume . This move is supported by short-term Exponential Moving Averages (EMAs) which are in a bullish positive crossover state.
The price is now at a critical juncture, testing a long-term horizontal resistan
₹209 Cr order + bullish setup… RailTel on track?RailTel is showing a steady recovery and is currently trading near ₹401.
📊 Technical View:
Strong Support: ₹325
Immediate Resistance: ₹440–₹445 (trendline zone)
Major Resistance: ₹480 (strong supply zone)
ATH: ₹609
Price structure indicates the stock is in an uptrend from recent lows. Sustaining above ₹445 will be the first confirmation, while a decisive breakout above ₹480 could open the path towards ₹500+ and a retest of the ATH levels.
📰 Fundamental Trigger:
RailTel recently secured a
Railtel making Pole and flagRailtel is making a Pole and Flag pattern on daily chart patter.
earlier it gave breakout from its resistance of 400 and consolidating near 450 levels.
RSI - 71 (neutral)
railway stocks in trend.
pole length 464-396 = 68
next target after breakout is 464+68 = 532
my earlier target is intact which was 539
not a sebi registered.
only for educational purpose.
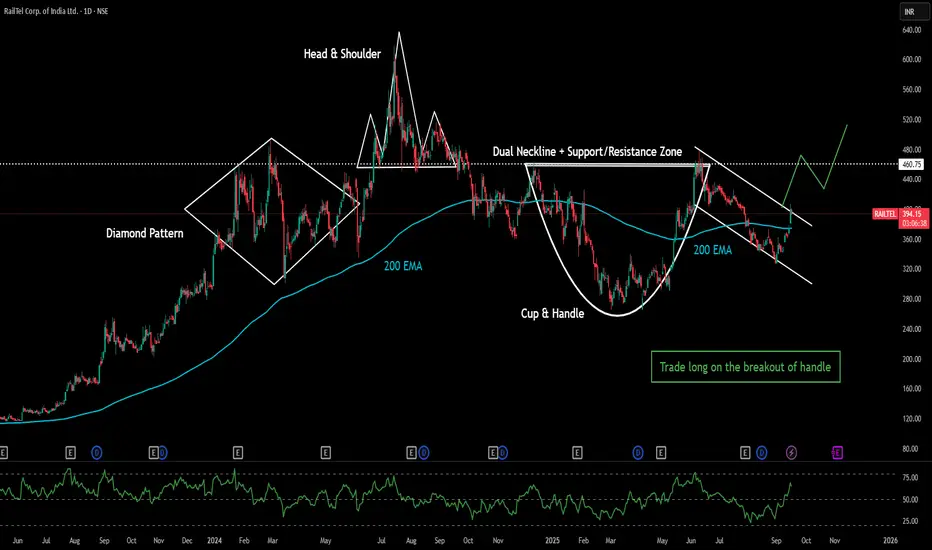
Railtel Corporation of India Limited daily chart analysis 📊 **Chart Overview**
📌 This chart is of Railtel Corporation of India Limited on the daily (1D) time frame.
📌 It displays price movements, volume, and key technical indicators such as MACD and RSI.
📌 A classic Head and Shoulders pattern is visible, indicating a potential reversal signal.
🟢🟢🟢
🔍 **Key Chart Feature and Pattern Observation**
1. **Head and Shoulders Pattern**
📌 The chart displays a Head and Shoulder reversal pattern with distinct Left Shoulder, Head, and Right Shou
RAILTEL 434 is good to up side buy know Weekly chart displays breakout
The neckline of inverse XABCD pattern confluence
with the upper side of the symmetrical triangle.
price is based at strong support neckline
this chart clearly shows that a massive potential targets ahead
it will be the level Study and buy
only for
Education purpose
UPUPCOMING SET UP SERIES SCRIPT - 6
SHARED ANALYSIS based on purely price action only for a technical aspect. Described level does not need to necessarily be observed….
KEEP ADDING to your watchlist and wait patiently for described level ( It may / may not be takes time )
LONG TERM INVESTORS can use described levels to accumulate OR hold….
Railtel Corporation of India Ltd - Breakout OpportunityDate : 23-Aug-2024
LTP : Rs. 497.30
Resistance Levels: (R1) Rs. 559 --> (R2) Rs. 617 --> (R3) Rs. 722
SL : Rs. 448 on daily close basis
Technical View:
• NSE:RAILTEL is in it's primary uptrend and was recently going through it's secondary downtrend.
• After touching the high of 617.80 on 12-Jul-2024, it has retraced 27% to 448.35 level.
• On 23-Aug-2024, NSE:RAILTEL has broke out from it's secondary downtrend with higher than average volume.
• NSE:RAILTEL is trading above 20 DMA and
RAILTEL - AS PER FIB RETRACEMENT, CORRECTION WAVE MIGHT BE OVERHi,
This idea is about Railtel Corporation of India Ltd
ABOUT THE COMPANY
RailTel was incorporated in 2000, with the objective of creating nationwide broadband and VPN services, telecom, and multimedia network, to modernize the train control operation and safety system of Indian Railways. It is a "Miniratna" PSE of the Government of India. At present, RailTel's network passes through around 6,000 stations across the country, covering all major commercial centers
TECHINCALS
As per the pric