RITES Ltd (Monthly Chart – NSE)🔍 Chart Structure & Trend
The stock is in a long-term uptrend since 2020, marked by higher highs and higher lows.
Price action is currently moving within a symmetrical triangle / converging trendline structure:
Rising trendline support from 2022–2025.
Falling trendline resistance from the 2024 p
RITES Ltd.
No trades
Next report date
—
Report period
—
EPS estimate
—
Revenue estimate
—
8.55 INR
3.85 B INR
21.84 B INR
133.59 M
About RITES Ltd.
Sector
CEO
Rahul Mithal
Website
Headquarters
Gurgaon
Founded
1974
IPO date
Jul 2, 2018
Identifiers
2
ISIN INE320J01015
RITES Ltd. engages in the provision of transport infrastructural services. It operates through the following segments: Consultancy Services; Leasing of Railway Rolling Stock and Equipments; Export of Rolling Stock, Equipments and Spares; and Turnkey Construction Projects. The company was founded in 1974 and is headquartered in Gurgaon, India.
Related stocks

RITES - Bat 0.8 revThe Bat pattern is a precise harmonic pattern that I discovered in 2001. The Bat pattern is probably the most accurate pattern in the entire Harmonic Trading arsenal. The pattern possesses many distinct elements that define an excellent Potential Reversal Zone (PRZ). The pattern typically represents

RITES Swing Breakout – Entry, Stop Loss, TargetsRITES has confirmed a clean breakout above the key EMA cluster (10/20/50/100) with strong volume and positive PSU momentum. The stock reclaimed the 200 EMA and closed near the day’s high, indicating strong buying interest.
🔹 Technical Highlights:
✅ Price above all major EMAs (bullish alignment)
✅ V
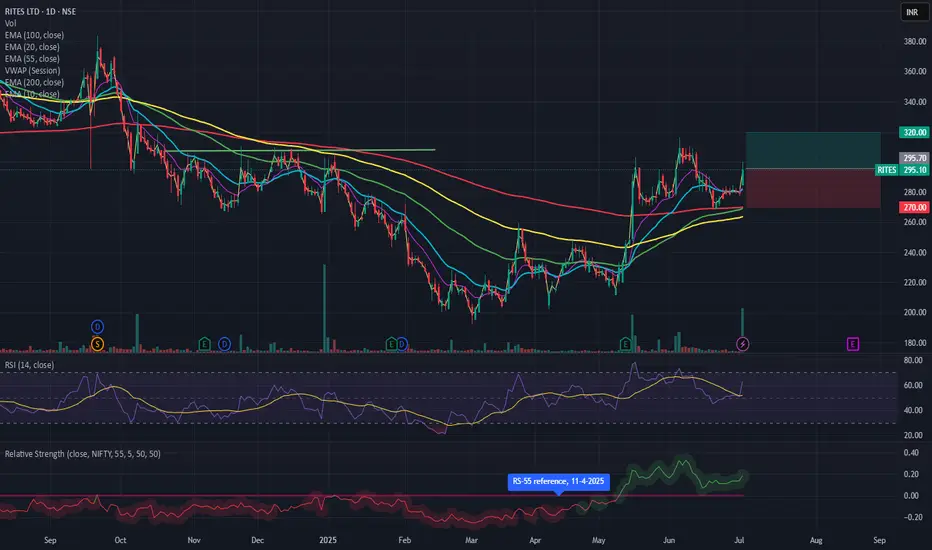
RITES LTD - Bullish Flag & Pole Breakout (Daily T/F)Trade Setup
📌 Stock: RITES LTD ( NSE:RITES )
📌 Trend: Strong Bullish Momentum
📌 Risk-Reward Ratio: 1:3 (Favorable)
🎯 Entry Zone: ₹295.00 (Breakout Confirmation)
🛑 Stop Loss: ₹260.00(Daily Closing Basis) (-12% Risk)
🎯 Target Levels:
₹309.90
₹326.15
₹338.05
₹355.90
₹374.25
₹392.35 (Final Target)

Rites ChartRites Ready to fly target 340. I have also given you the snapshot of the analysis done by me.

Chart Analysis for RITES Ltd.Trend Analysis:
The chart indicates a recovery after a period of consolidation. The recent upward momentum suggests a potential bullish trend.
Key Levels:
Support Level: Around ₹210 - ₹215, where price has previously bounced back.
Resistance Level: Near ₹225, where price has encountered selling pr

RITES TARGET 397 STOPLOSS 270Script is taken long term monthly uptrend channel support taken in the and bullish in weekly closing. Target is 397.

Result play in RITES around 292-295 levels A lond Trade Can be initiated in RITES around 288-295 levels with sl around 280-282 levels for target of 312+++ 318+++ 327+++ 335 ++++ maintain strict sl and hold for the target.

TURNING BULLISH: RITESRITES HAS BEEN IN A DOWNTREND FOR THE PAST COUPLE OF MONTHS.
RECENTLY IT HAS BOUNCED BACK STRONGLY FROM THE SUPPORT LEVEL OF 648.
NEXT RESISTANCE LEVELS: 767 - 783.
CONS: Sharp decline in quarterly profit from Rs. 176 Cr (Mar 2024) to Rs. 106 Cr. (Jun 2024).
Similarly, sales declined from Rs. 2,628

RITES Date 31.08.2024
RITES
Timeframe : Day chart
At 200 ema & consolidating from few days. Recently there's positive development with respect to new order.
(RITES: CO HAS EMERGED AS THE LOWEST BIDDER (L-1) FOR A USD 2.67 CR CONTRACT TO SUPPLY, TEST, AND COMMISSION 4 DIESEL MULTIPLE UNITS FOR TANZANIA

See all ideas
Summarizing what the indicators are suggesting.
Neutral
SellBuy
Strong sellStrong buy
Strong sellSellNeutralBuyStrong buy
Neutral
SellBuy
Strong sellStrong buy
Strong sellSellNeutralBuyStrong buy
Neutral
SellBuy
Strong sellStrong buy
Strong sellSellNeutralBuyStrong buy
An aggregate view of professional's ratings.
Neutral
SellBuy
Strong sellStrong buy
Strong sellSellNeutralBuyStrong buy
Neutral
SellBuy
Strong sellStrong buy
Strong sellSellNeutralBuyStrong buy
Neutral
SellBuy
Strong sellStrong buy
Strong sellSellNeutralBuyStrong buy
Displays a symbol's price movements over previous years to identify recurring trends.
SMALLCAP
Mirae Asset Nifty Smallcap 250 Momentum Quality 100 ETF Units Exchange Traded FundWeight
0.27%
Market value
222.26 K
USD
MOSMALL250
Motilal Oswal Nifty Smallcap 250 ETF Units Exchange Traded FundWeight
0.16%
Market value
25.94 K
USD
HESC
HSBC ETFs PLC - HSBC MSCI Emerging Markets Small Cap Screened UCITS ETFWeight
0.01%
Market value
6.58 K
USD
MULTICAP
Mirae Asset Nifty500 Multicap 502525 ETF Exchange Traded Fund UnitsWeight
0.04%
Market value
2.78 K
USD
SMALL250
Mirae Asset Nifty Smallcap 250 ETF Exchange Traded Fund UnitsWeight
0.16%
Market value
2.50 K
USD
Explore more ETFs
Frequently Asked Questions
The current price of RITES is 223.00 INR — it has increased by 1.01% in the past 24 hours. Watch RITES Ltd. stock price performance more closely on the chart.
Depending on the exchange, the stock ticker may vary. For instance, on NSE exchange RITES Ltd. stocks are traded under the ticker RITES.
RITES stock has fallen by −1.05% compared to the previous week, the month change is a −9.33% fall, over the last year RITES Ltd. has showed a −9.35% decrease.
We've gathered analysts' opinions on RITES Ltd. future price: according to them, RITES price has a max estimate of 320.00 INR and a min estimate of 280.00 INR. Watch RITES chart and read a more detailed RITES Ltd. stock forecast: see what analysts think of RITES Ltd. and suggest that you do with its stocks.
RITES reached its all-time high on Feb 27, 2024 with the price of 412.98 INR, and its all-time low was 76.00 INR and was reached on Jul 2, 2018. View more price dynamics on RITES chart.
See other stocks reaching their highest and lowest prices.
See other stocks reaching their highest and lowest prices.
RITES stock is 3.56% volatile and has beta coefficient of 2.54. Track RITES Ltd. stock price on the chart and check out the list of the most volatile stocks — is RITES Ltd. there?
Today RITES Ltd. has the market capitalization of 109.77 B, it has decreased by −0.59% over the last week.
Yes, you can track RITES Ltd. financials in yearly and quarterly reports right on TradingView.
RITES Ltd. is going to release the next earnings report on Feb 4, 2026. Keep track of upcoming events with our Earnings Calendar.
RITES earnings for the last quarter are 3.50 INR per share, whereas the estimation was 1.74 INR resulting in a 101.15% surprise. The estimated earnings for the next quarter are 2.10 INR per share. See more details about RITES Ltd. earnings.
RITES Ltd. revenue for the last quarter amounts to 5.49 B INR, despite the estimated figure of 5.32 B INR. In the next quarter, revenue is expected to reach 6.03 B INR.
RITES net income for the last quarter is 982.10 M INR, while the quarter before that showed 801.00 M INR of net income which accounts for 22.61% change. Track more RITES Ltd. financial stats to get the full picture.
RITES Ltd. dividend yield was 3.40% in 2024, and payout ratio reached 94.92%. The year before the numbers were 2.52% and 88.38% correspondingly. See high-dividend stocks and find more opportunities for your portfolio.
As of Feb 3, 2026, the company has 2.71 K employees. See our rating of the largest employees — is RITES Ltd. on this list?
EBITDA measures a company's operating performance, its growth signifies an improvement in the efficiency of a company. RITES Ltd. EBITDA is 5.47 B INR, and current EBITDA margin is 23.08%. See more stats in RITES Ltd. financial statements.
Like other stocks, RITES shares are traded on stock exchanges, e.g. Nasdaq, Nyse, Euronext, and the easiest way to buy them is through an online stock broker. To do this, you need to open an account and follow a broker's procedures, then start trading. You can trade RITES Ltd. stock right from TradingView charts — choose your broker and connect to your account.
Investing in stocks requires a comprehensive research: you should carefully study all the available data, e.g. company's financials, related news, and its technical analysis. So RITES Ltd. technincal analysis shows the sell today, and its 1 week rating is sell. Since market conditions are prone to changes, it's worth looking a bit further into the future — according to the 1 month rating RITES Ltd. stock shows the strong sell signal. See more of RITES Ltd. technicals for a more comprehensive analysis.
If you're still not sure, try looking for inspiration in our curated watchlists.
If you're still not sure, try looking for inspiration in our curated watchlists.