Looks bullish Sagility looks bullish as long as holds above 50, the stock is trying to bounce back on every opportunity.
Sagility Limited
No trades
Next report date
—
Report period
—
EPS estimate
—
Revenue estimate
—
1.81 INR
5.39 B INR
55.70 B INR
1.53 B
About Sagility Limited
Sector
CEO
Ramesh Gopalan
Website
Headquarters
Bengaluru
Founded
2021
IPO date
Nov 12, 2024
Identifiers
2
ISIN INE0W2G01015
Sagility Ltd. provides healthcare technology services. It is engaged in the business of offering services to healthcare clients, primarily in the payor segments, such as health insurance companies. The company was founded in July 28, 2021 and is headquartered in Bengaluru, India.
Related stocks

Sagility Ltd | Weekly Breakout Setup | 20–30% UpsideSagility Ltd is forming a strong weekly consolidation breakout setup after a prolonged range.
Price is holding above key moving averages
Higher lows indicate bullish structure
Tight consolidation near resistance suggests strength and absorption
Structure favors a range breakout continuation
Trade

Weekly TF analysis. Buy 54.Based on stacked high low difference.
1 Historical Base Formation
2 should be = 1, Projected breakout
Buy at 54. Safe entry.
R:R = 1:2

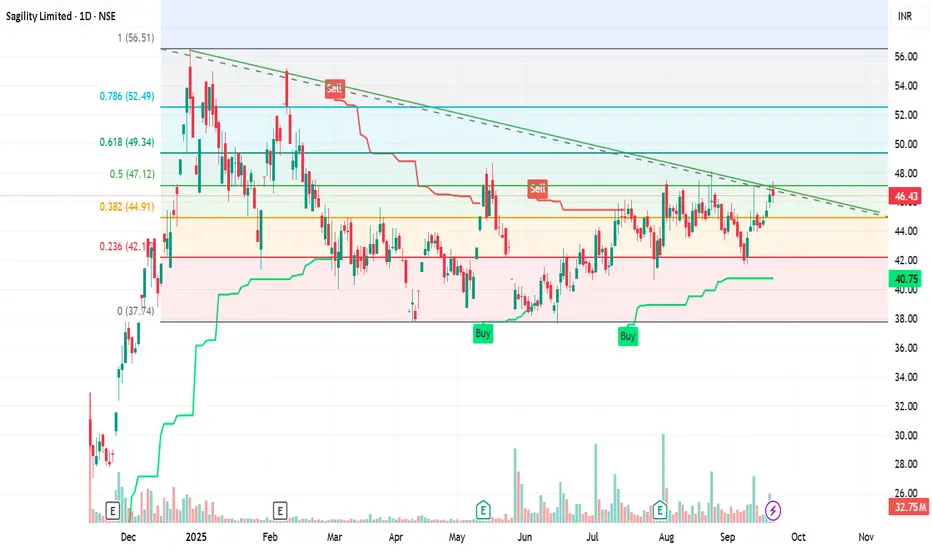
Sagility Breakout Technical AnalysisThe chart of Sagility Limited on the NSE reveals a technically rich setup with several key signals. Here's a breakdown of what it indicates:
📉 Trend Analysis
- Descending Trendline: The stock has been forming lower highs, suggesting a downtrend or bearish sentiment.
- Current Price: ₹45.60, down 1.
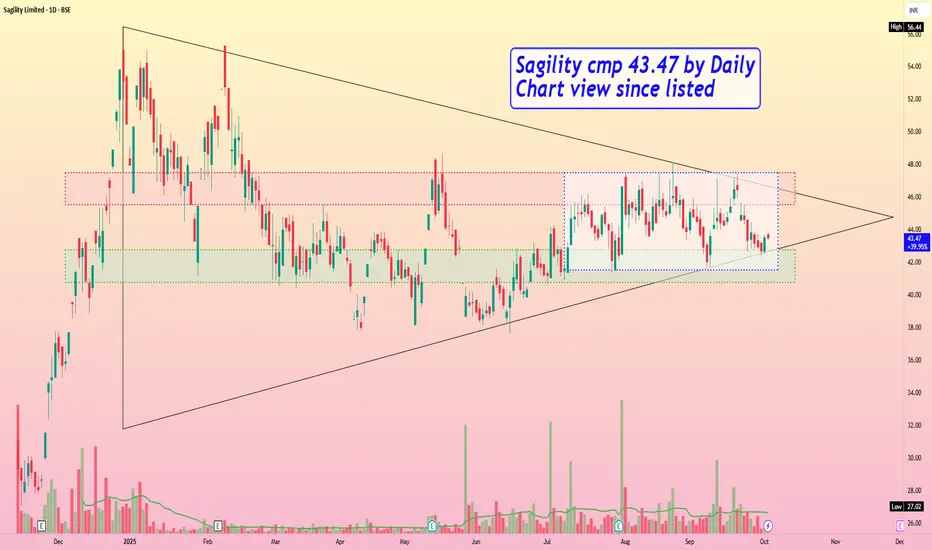
Sagility cmp 43.47 by Daily Chart view since listedSagility cmp 43.47 by Daily Chart view since listed
- Support Zone 40.75 to 42.75 Price Band
- Resistance Zone 45.50 to 47.50 Price Band
- Price traversing inside Symmetrical Triangle pattern
- Support Zone repeatedly tested rested since month of July 2025
- Price trending in Darvas Box range 41.
Sagility India LtdSagility India Ltd, on weekly timeframe this stock has given breakout and has potential of giving return approx. 35-40 % in few weeks. keep this in your watchlist and plan accordingly. check volume as well. FII's and DII's continuously in their holding.

Sagility break and consolidationSagility india has broken a very clear flag pattern
also sales is nice can follow stoploss of 37 for target of 55,65+
>not liable for any loss or profit ,trading includes financial risk,
only for educational purpose

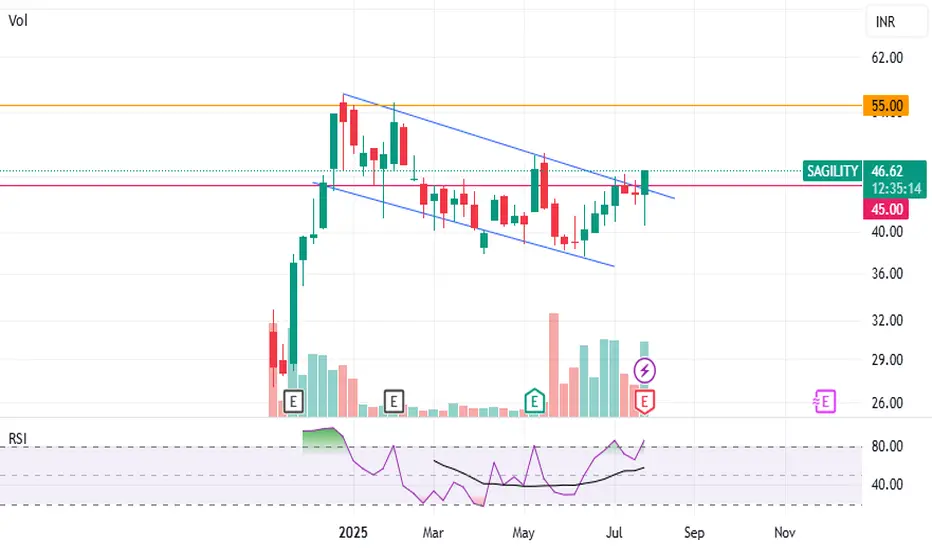
Sagility India LtdSAGILITY has been trading within a descending wedge pattern and has now broken above the upper trendline, confirming a bullish momentum. This breakout is further validated by rising volume, adding strength to the move.
Additionally, while the price was making lower lows, the RSI showed higher lows,
Sagility India Limited Trade Information
Traded Volume (Lakhs) 194.42
Traded Value (₹ Cr.) 87.90
Total Market Cap (₹ Cr.) 21,019.16
Free Float Market Cap (₹ Cr.) 6,857.12
Impact cost 0.87
% of Deliverable / Traded
Quantity 47.47 %
Applicable Margin Rate 17.77
Face Value 10
Price Information
52 Week High (30-Dec-2024)

SAGILITY INDIA📈 **Sagility India Ltd – Breakout Watch (Daily Timeframe)**
After consolidating in a **descending triangle** for several months, Sagility India is now attempting a **breakout above the falling trendline** resistance.
🔶 **Structure**:
* Horizontal base around ₹38
* Lower highs forming a compressin

See all ideas
Summarizing what the indicators are suggesting.
Neutral
SellBuy
Strong sellStrong buy
Strong sellSellNeutralBuyStrong buy
Neutral
SellBuy
Strong sellStrong buy
Strong sellSellNeutralBuyStrong buy
Neutral
SellBuy
Strong sellStrong buy
Strong sellSellNeutralBuyStrong buy
An aggregate view of professional's ratings.
Neutral
SellBuy
Strong sellStrong buy
Strong sellSellNeutralBuyStrong buy
Neutral
SellBuy
Strong sellStrong buy
Strong sellSellNeutralBuyStrong buy
Neutral
SellBuy
Strong sellStrong buy
Strong sellSellNeutralBuyStrong buy
Displays a symbol's price movements over previous years to identify recurring trends.
MOSMALL250
Motilal Oswal Nifty Smallcap 250 ETF Units Exchange Traded FundWeight
0.40%
Market value
63.55 K
USD
SMALL250
Mirae Asset Nifty Smallcap 250 ETF Exchange Traded Fund UnitsWeight
0.40%
Market value
7.85 K
USD
Explore more ETFs
Frequently Asked Questions
The current price of SAGILITY is 48.81 INR — it has increased by 1.12% in the past 24 hours. Watch Sagility Limited stock price performance more closely on the chart.
Depending on the exchange, the stock ticker may vary. For instance, on NSE exchange Sagility Limited stocks are traded under the ticker SAGILITY.
SAGILITY stock has risen by 0.14% compared to the previous week, the month change is a −4.11% fall, over the last year Sagility Limited has showed a −11.25% decrease.
We've gathered analysts' opinions on Sagility Limited future price: according to them, SAGILITY price has a max estimate of 76.00 INR and a min estimate of 62.00 INR. Watch SAGILITY chart and read a more detailed Sagility Limited stock forecast: see what analysts think of Sagility Limited and suggest that you do with its stocks.
SAGILITY reached its all-time high on Oct 30, 2025 with the price of 57.89 INR, and its all-time low was 27.02 INR and was reached on Nov 13, 2024. View more price dynamics on SAGILITY chart.
See other stocks reaching their highest and lowest prices.
See other stocks reaching their highest and lowest prices.
SAGILITY stock is 0.08% volatile and has beta coefficient of 1.70. Track Sagility Limited stock price on the chart and check out the list of the most volatile stocks — is Sagility Limited there?
Today Sagility Limited has the market capitalization of 225.69 B, it has decreased by −1.15% over the last week.
Yes, you can track Sagility Limited financials in yearly and quarterly reports right on TradingView.
Sagility Limited is going to release the next earnings report on May 20, 2026. Keep track of upcoming events with our Earnings Calendar.
SAGILITY earnings for the last quarter are 0.69 INR per share, whereas the estimation was 0.61 INR resulting in a 13.11% surprise. The estimated earnings for the next quarter are 0.68 INR per share. See more details about Sagility Limited earnings.
Sagility Limited revenue for the last quarter amounts to 19.71 B INR, despite the estimated figure of 18.99 B INR. In the next quarter, revenue is expected to reach 21.25 B INR.
SAGILITY net income for the last quarter is 2.68 B INR, while the quarter before that showed 2.51 B INR of net income which accounts for 6.71% change. Track more Sagility Limited financial stats to get the full picture.
As of Feb 10, 2026, the company has 39.41 K employees. See our rating of the largest employees — is Sagility Limited on this list?
EBITDA measures a company's operating performance, its growth signifies an improvement in the efficiency of a company. Sagility Limited EBITDA is 16.45 B INR, and current EBITDA margin is 23.48%. See more stats in Sagility Limited financial statements.
Like other stocks, SAGILITY shares are traded on stock exchanges, e.g. Nasdaq, Nyse, Euronext, and the easiest way to buy them is through an online stock broker. To do this, you need to open an account and follow a broker's procedures, then start trading. You can trade Sagility Limited stock right from TradingView charts — choose your broker and connect to your account.
Investing in stocks requires a comprehensive research: you should carefully study all the available data, e.g. company's financials, related news, and its technical analysis. So Sagility Limited technincal analysis shows the sell today, and its 1 week rating is neutral. Since market conditions are prone to changes, it's worth looking a bit further into the future — according to the 1 month rating Sagility Limited stock shows the buy signal. See more of Sagility Limited technicals for a more comprehensive analysis.
If you're still not sure, try looking for inspiration in our curated watchlists.
If you're still not sure, try looking for inspiration in our curated watchlists.