SWIGGY 1 Day View 📊 SWIGGY – 1-Day Time Frame Key Levels (Daily Technical View)
📍 Latest Price Context (Approx)
Current/Live price range (recent session): ~₹305–₹315 (trading range today)
🔑 Daily Support Levels
These are price zones where buying interest could emerge if the stock dips:
📌 S1 (Immediate Support): ~₹
Swiggy Limited
No trades
Next report date
—
Report period
—
EPS estimate
—
Revenue estimate
—
−18.85 INR
−31.17 B INR
152.27 B INR
1.33 B
About Swiggy Limited
Sector
Industry
CEO
Sriharsha Majety
Website
Headquarters
Bengaluru
Founded
2013
IPO date
Nov 13, 2024
Identifiers
2
ISIN INE00H001014
Swiggy Ltd. engages in the provision of food delivery services. It focuses on food delivery, Instamart, Dineout, and Scenes businesses. It operates through the following segments: Food Delivery, Out of Home Consumption, Quick-Commerce, Supply Chain and Distribution, and Platform Innovations. The Food Delivery segment offers on-demand food delivery services through a network of restaurant partners and delivery partners. The Out of Home Consumption segment includes restaurant dining solutions. The Quick-Commerce segment relates to on-demand groceries. The Supply Chain and Distribution segment provides supply chain services to wholesalers, retailers, and fast-moving consumer goods brands. The Platform Innovations segment focuses on a set of incubators for new service offerings. The company was founded by Sriharsha Majety, Rahul Jaimini, and Lakshmi Nandan Reddy Obul on December 26, 2013 and is headquartered in Bengaluru, India.
Related stocks

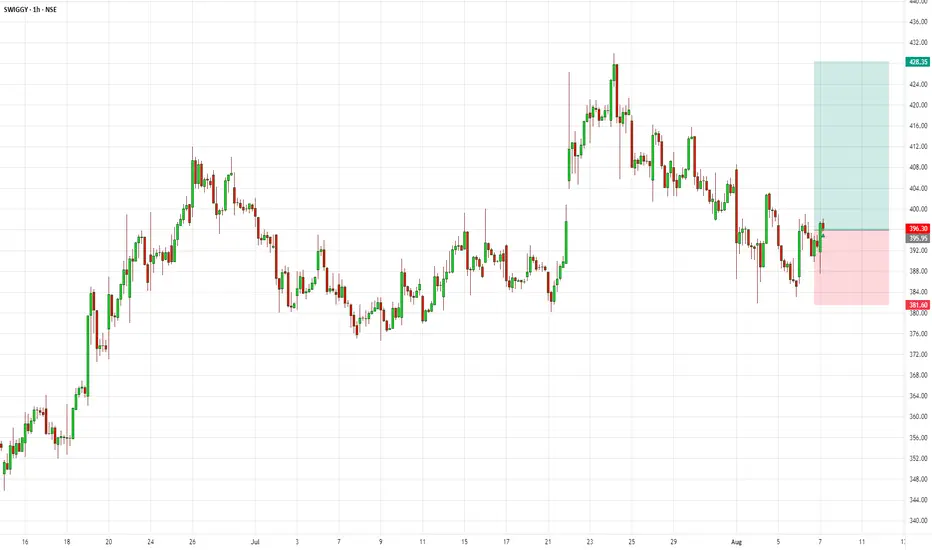
SWIGGY 1 Day Time Frame 📈 Latest Price Context (Today’s Trading)
📍 Approx Live Price: ~₹401 INR on NSE during today’s session with intraday swings between ~₹396 and ₹408.
📊 Daily Support & Resistance Levels (1-Day Chart)
🔹 Key Resistance
R1: ~₹404–₹406 — first resistance from intraday pivot/octave levels.
R2: ~₹409–
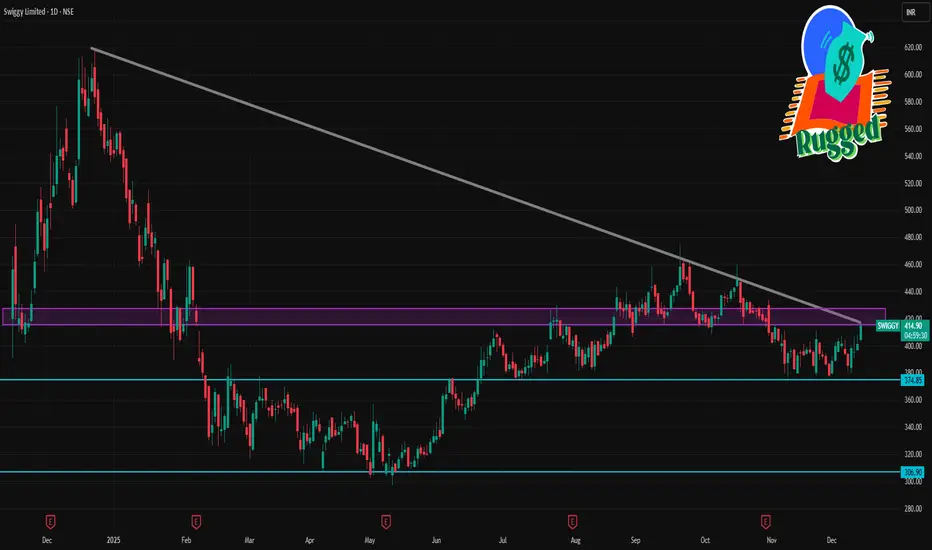
Swiggy Limited 🟢 Swiggy is sitting at a crucial support area with RSI divergence confirming strength 🧭
📈 Might be a perfect low-risk setup for positional traders!

Swiggy LtdSwiggy - The chart shows a well-defined ascending channel pattern, and price action is moving steadily between the parallel trendlines, respecting both the support and resistance lines
The latest candle shows a bounce from the lower channel support, which indicates continuation of the uptrend with

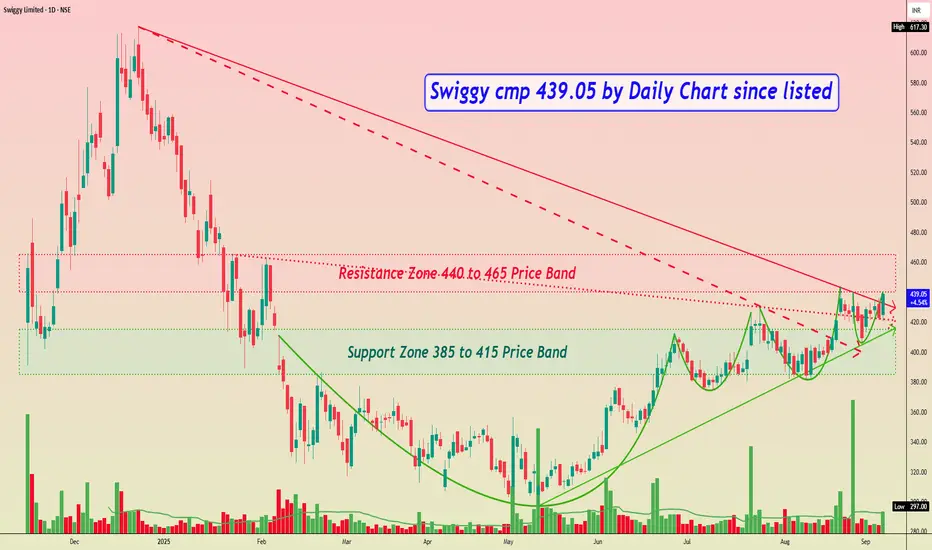
Swiggy cmp 439.05 by Daily Chart since listedSwiggy cmp 439.05 by Daily Chart since listed
- Support Zone 385 to 415 Price Band
- Resistance Zone 440 to 465 Price Band
- Rising Support Trendline well respected by Price momentum
- Bullish Cup and Handle followed by small Rounding Bottoms or a closely considerate VCP pattern
- Falling Resistanc
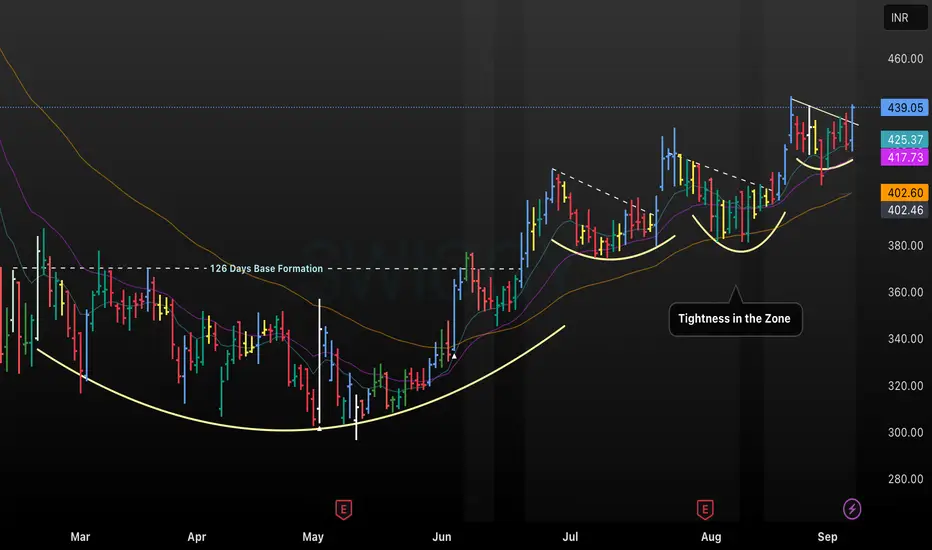
SWIGGY Breakout Setup: 126-Day Base Formation & Momentum ZoneThis chart analyzes SWIGGY’s recent price action and technical setup, featuring a 126-day base formation as a foundation for trend reversal and bullish momentum. The stock has shown consistent upward movement, supported by tightening in the zone and well-defined moving average support, with resistan
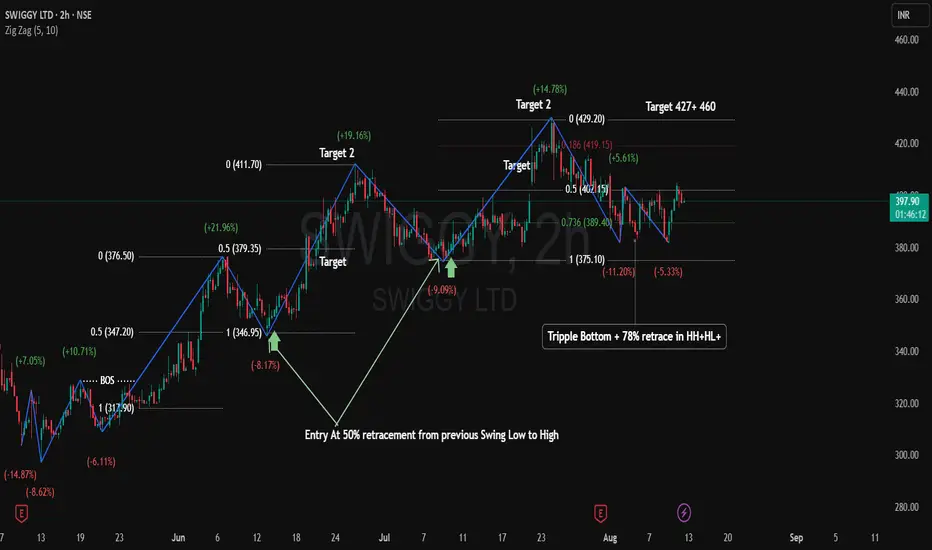
ICT Trading Setup: Swiggy Breaks Structure for Next Bullish MoveBased on the ICT trading method, the Swiggy chart is currently showing a Higher High (HH) and Higher Low (HL) structure. The first two counter-trend moves retraced 50% from the previous swing high to the recent swing low, providing excellent opportunities for optimal trend entries.
At present, the
R R 2.26
Only Trendlines Used — No Other Confluence
⦁ Stoploss Is Based on the Trendline
⦁ Retest of Trendline Builds Confidence
⦁ Trendline Angle Shows Momentum
⦁ Trendlines Define Risk Clearly
Swiggy Ltd. Reserch ReportBuy/Sell/Hold Recommendation:
Given Swiggy’s strong revenue growth but continued losses and negative cash flows, the stock currently represents a high-risk, high-reward opportunity. Unless you have a high risk appetite and a long-term horizon, a "Hold" stance is appropriate—wait for visible margin i

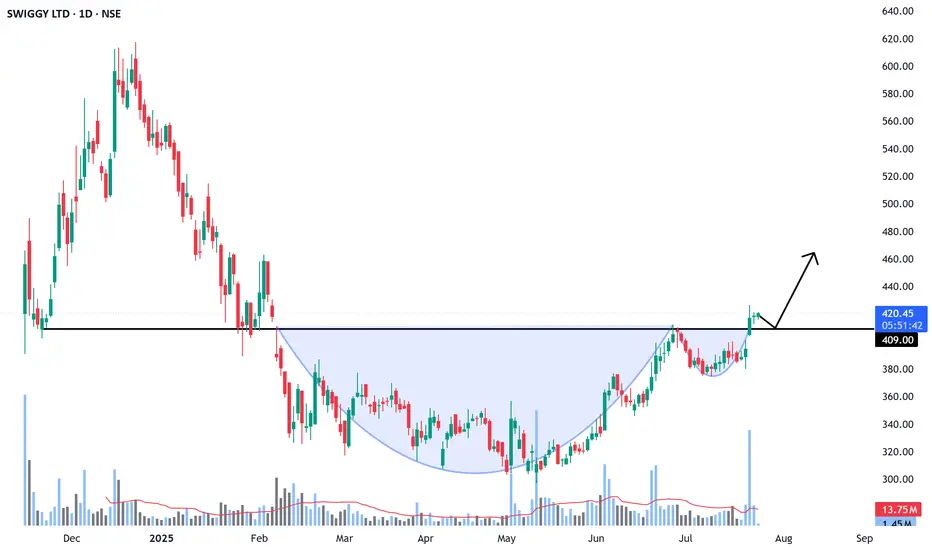
SWIGGY : Next Multi-bagger ??NSE:SWIGGY
🚀 SWIGGY LTD – Combined Technical + Fundamental Analysis
As of: 24 July 2025 | CMP: ₹420.50 |
📈 TECHNICAL ANALYSIS
🔷 Pattern: Cup and Handle Breakout
Cup & Handle pattern completed over 5 months (Feb–July 2025)
Breakout Level: ₹409 (marked horizontal resistance)
CMP: ₹420.50 —
See all ideas
Summarizing what the indicators are suggesting.
Neutral
SellBuy
Strong sellStrong buy
Strong sellSellNeutralBuyStrong buy
Neutral
SellBuy
Strong sellStrong buy
Strong sellSellNeutralBuyStrong buy
Neutral
SellBuy
Strong sellStrong buy
Strong sellSellNeutralBuyStrong buy
An aggregate view of professional's ratings.
Neutral
SellBuy
Strong sellStrong buy
Strong sellSellNeutralBuyStrong buy
Neutral
SellBuy
Strong sellStrong buy
Strong sellSellNeutralBuyStrong buy
Neutral
SellBuy
Strong sellStrong buy
Strong sellSellNeutralBuyStrong buy
Displays a symbol's price movements over previous years to identify recurring trends.
Frequently Asked Questions
The current price of SWIGGY is 355.75 INR — it has increased by 4.88% in the past 24 hours. Watch Swiggy Limited stock price performance more closely on the chart.
Depending on the exchange, the stock ticker may vary. For instance, on NSE exchange Swiggy Limited stocks are traded under the ticker SWIGGY.
SWIGGY stock has risen by 9.72% compared to the previous week, the month change is a −0.81% fall, over the last year Swiggy Limited has showed a −5.89% decrease.
We've gathered analysts' opinions on Swiggy Limited future price: according to them, SWIGGY price has a max estimate of 600.00 INR and a min estimate of 290.00 INR. Watch SWIGGY chart and read a more detailed Swiggy Limited stock forecast: see what analysts think of Swiggy Limited and suggest that you do with its stocks.
SWIGGY reached its all-time high on Dec 23, 2024 with the price of 617.30 INR, and its all-time low was 297.00 INR and was reached on May 13, 2025. View more price dynamics on SWIGGY chart.
See other stocks reaching their highest and lowest prices.
See other stocks reaching their highest and lowest prices.
SWIGGY stock is 7.78% volatile and has beta coefficient of 1.40. Track Swiggy Limited stock price on the chart and check out the list of the most volatile stocks — is Swiggy Limited there?
Today Swiggy Limited has the market capitalization of 921.39 B, it has increased by 3.97% over the last week.
Yes, you can track Swiggy Limited financials in yearly and quarterly reports right on TradingView.
Swiggy Limited is going to release the next earnings report on May 8, 2026. Keep track of upcoming events with our Earnings Calendar.
SWIGGY earnings for the last quarter are −4.36 INR per share, whereas the estimation was −4.15 INR resulting in a −5.04% surprise. The estimated earnings for the next quarter are −3.16 INR per share. See more details about Swiggy Limited earnings.
Swiggy Limited revenue for the last quarter amounts to 61.48 B INR, despite the estimated figure of 59.63 B INR. In the next quarter, revenue is expected to reach 62.09 B INR.
SWIGGY net income for the last quarter is −10.65 B INR, while the quarter before that showed −10.92 B INR of net income which accounts for 2.47% change. Track more Swiggy Limited financial stats to get the full picture.
No, SWIGGY doesn't pay any dividends to its shareholders. But don't worry, we've prepared a list of high-dividend stocks for you.
As of Feb 10, 2026, the company has 4.49 K employees. See our rating of the largest employees — is Swiggy Limited on this list?
EBITDA measures a company's operating performance, its growth signifies an improvement in the efficiency of a company. Swiggy Limited EBITDA is −34.96 B INR, and current EBITDA margin is −18.30%. See more stats in Swiggy Limited financial statements.
Like other stocks, SWIGGY shares are traded on stock exchanges, e.g. Nasdaq, Nyse, Euronext, and the easiest way to buy them is through an online stock broker. To do this, you need to open an account and follow a broker's procedures, then start trading. You can trade Swiggy Limited stock right from TradingView charts — choose your broker and connect to your account.
Investing in stocks requires a comprehensive research: you should carefully study all the available data, e.g. company's financials, related news, and its technical analysis. So Swiggy Limited technincal analysis shows the buy rating today, and its 1 week rating is sell. Since market conditions are prone to changes, it's worth looking a bit further into the future — according to the 1 month rating Swiggy Limited stock shows the neutral signal. See more of Swiggy Limited technicals for a more comprehensive analysis.
If you're still not sure, try looking for inspiration in our curated watchlists.
If you're still not sure, try looking for inspiration in our curated watchlists.