TATA POWER-LIKELY FLAG PATTERN BREAK OUTBased on the 1-hour chart of Tata Power:
It is attempting a short-term bullish flag, but confirmation is not complete yet.
Technical Structure Assessment: Flagpole:
Strong impulsive move from ~₹365 to ~₹377–378
Volume expansion visible on breakout candle.
Momentum indicators (Stoch RSI) near overbo
Next report date
—
Report period
—
EPS estimate
—
Revenue estimate
—
11.85 INR
39.71 B INR
650.80 B INR
1.69 B
About Tata Power Company Limited
Sector
Industry
CEO
Praveer Sinha
Website
Headquarters
Mumbai
Founded
1919
IPO date
Feb 22, 1994
Identifiers
2
ISIN INE245A01021
Tata Power Co., Ltd. engages in the provision of power supply and transmission charges. It operates through the following segments: Generation, Renewables, Transmission and Distribution, and Others. The Generation segment consists of generation of power from hydroelectric sources and thermal sources from plants owned and operated under lease arrangement and related ancillary services. The Renewables segment includes generation of power from renewable energy sources. The Transmission and Distribution segment involves in the transmission and distribution network, sale of power to retail customers through distribution network and related ancillary services. The Others segment refers to project management contracts/infrastructure management services, property development and lease rent of oil tanks. The company was founded on September 18, 1919 and is headquartered in Mumbai, India.
Related stocks

Great opportunity 20% discounted price.The stock is undervalued here is why--
> Company's profit is growing on a fast phase while the stock is not growing that much
this results that stock is still underpriced. The stock is almost 20% down from its all
time high.
> The Central Electricity Authority (CEA) estimates India’s power

Tata Power Date 06.02.2026
Tata Power
Timeframe : Day Chart
Key Negative Points
(1) Net Debt to Equity ratio of 1.56X
(2) Debt to EBITDA ratio of 5.03X
(3) Margin Compression Q3 FY26 declining to 21.24% from 23.86% Y-O-Y
(4) PE Ratio = 30, Premium to industry median of 20X
(5) Profit growth -2.36% (TTM)
K

Tata Power Bounce on Monthly TrendlineIf February candle is green, it can breakout even the 500 Level to 600-700.
Tata Power gives movements in short spans after long waiting period which we have already experienced.

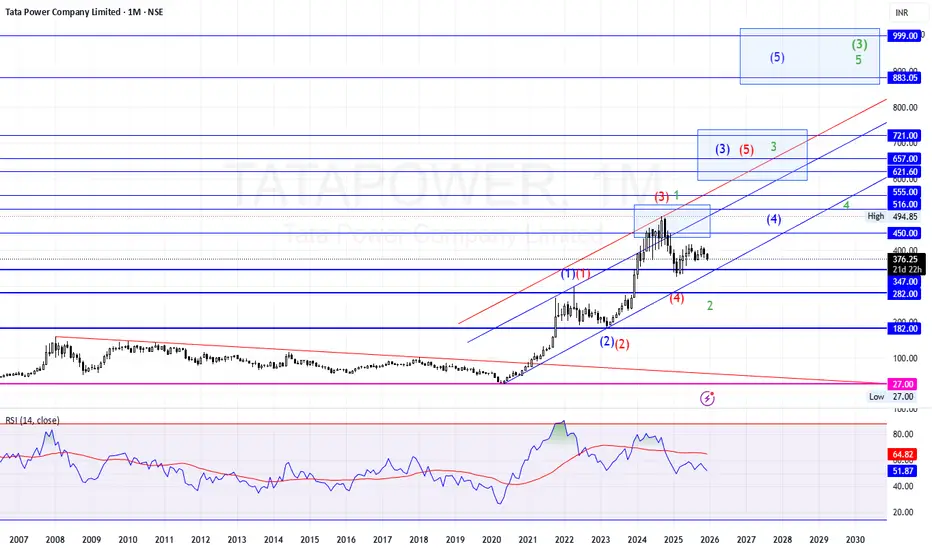
TATAPOWER – MONTHLY CHART | MAJOR WAVE 5 SETUP |MULTI-YEAR BREAKPrice: ₹376 • Timeframe: 1M • Trend: Long-Term Bullish
Structure: Elliott Waves + Rising Channel + Fibonacci Targets
🔷 LONG-TERM STRUCTURAL VIEW
Tata Power has completed a 10+ year accumulation and broken into a long-term uptrend since 2020.
Price is respecting a strong rising channel, with multi
Part 2 Master Candle Stick Patterns Key Terms in Options
Option trading revolves around certain essential terms that define risk, reward, and price movement.
Premium
The price you pay to buy an option.
For the buyer, premium = maximum loss.
Strike Price
The fixed level at which you buy (Call) or sell (Put) if you choose to exerci

Candle Patterns Practical Trading Tips Using Candle Patterns
Trade only with trend confirmation.
A reversal pattern against a strong trend may fail.
Look for patterns at key levels.
Support, resistance, supply-demand zones enhance accuracy.
Use stop-loss placement wisely.
For example, below the wick of a Hammer

Part 2 Support and Resistance Premium: The Price of an Option
Premium is the amount the option buyer pays to the seller. It is influenced by:
Intrinsic Value
Time to Expiry
Volatility (IV)
Interest Rates
Demand–Supply
Premium tells you how expensive or cheap an option is at a given moment.

Divergence Secrets Option Greeks – The Heart of Option Pricing
Option Greeks mathematically measure how an option should behave.
1. Delta
Measures direction sensitivity.
Call delta: 0 to 1
Put delta: –1 to 0
2. Gamma
Measures change in delta.
High near expiry.
3. Theta
Time decay rate.
4. Vega
Sensitivity to

Part 10 Trade Like Institutions Advantages of Option Trading
Low investment, high return potential
Can profit in any market condition
Great for hedging and insurance
Wide range of strategies
Lower capital requirement compared to futures
Disadvantages of Option Trading
Requires knowledge of Greeks
High risk if used incorrec

See all ideas
Summarizing what the indicators are suggesting.
Neutral
SellBuy
Strong sellStrong buy
Strong sellSellNeutralBuyStrong buy
Neutral
SellBuy
Strong sellStrong buy
Strong sellSellNeutralBuyStrong buy
Neutral
SellBuy
Strong sellStrong buy
Strong sellSellNeutralBuyStrong buy
An aggregate view of professional's ratings.
Neutral
SellBuy
Strong sellStrong buy
Strong sellSellNeutralBuyStrong buy
Neutral
SellBuy
Strong sellStrong buy
Strong sellSellNeutralBuyStrong buy
Neutral
SellBuy
Strong sellStrong buy
Strong sellSellNeutralBuyStrong buy
Displays a symbol's price movements over previous years to identify recurring trends.
T
793TPRE34.N0
Tata Power Renewable Energy Ltd. 7.93% 26-JUN-2034Yield to maturity
—
Maturity date
Jun 26, 2034
T
785TRPEL34.N0
Tata Power Renewable Energy Ltd. 7.85% 19-SEP-2034Yield to maturity
—
Maturity date
Sep 19, 2034
T
755TPREL40.N0
Tata Power Renewable Energy Ltd. 7.55% 25-APR-2040Yield to maturity
—
Maturity date
Apr 25, 2040
T
793TPRE29.N0
Tata Power Renewable Energy Ltd. 7.93% 26-JUN-2029Yield to maturity
—
Maturity date
Jun 26, 2029
T
770TPREL34.N0
Tata Power Renewable Energy Ltd. 7.7% 24-DEC-2034Yield to maturity
—
Maturity date
Dec 24, 2034
See all TATAPOWER bonds
Frequently Asked Questions
The current price of TATAPOWER is 378.90 INR — it has decreased by −1.69% in the past 24 hours. Watch Tata Power Company Limited stock price performance more closely on the chart.
Depending on the exchange, the stock ticker may vary. For instance, on NSE exchange Tata Power Company Limited stocks are traded under the ticker TATAPOWER.
TATAPOWER stock has risen by 2.66% compared to the previous week, the month change is a 2.10% rise, over the last year Tata Power Company Limited has showed a 8.55% increase.
We've gathered analysts' opinions on Tata Power Company Limited future price: according to them, TATAPOWER price has a max estimate of 504.00 INR and a min estimate of 300.00 INR. Watch TATAPOWER chart and read a more detailed Tata Power Company Limited stock forecast: see what analysts think of Tata Power Company Limited and suggest that you do with its stocks.
TATAPOWER reached its all-time high on Sep 27, 2024 with the price of 494.85 INR, and its all-time low was 4.25 INR and was reached on May 2, 2000. View more price dynamics on TATAPOWER chart.
See other stocks reaching their highest and lowest prices.
See other stocks reaching their highest and lowest prices.
TATAPOWER stock is 2.35% volatile and has beta coefficient of 1.49. Track Tata Power Company Limited stock price on the chart and check out the list of the most volatile stocks — is Tata Power Company Limited there?
Today Tata Power Company Limited has the market capitalization of 1.20 T, it has increased by 1.01% over the last week.
Yes, you can track Tata Power Company Limited financials in yearly and quarterly reports right on TradingView.
Tata Power Company Limited is going to release the next earnings report on May 13, 2026. Keep track of upcoming events with our Earnings Calendar.
TATAPOWER earnings for the last quarter are 2.40 INR per share, whereas the estimation was 3.19 INR resulting in a −24.71% surprise. The estimated earnings for the next quarter are 3.27 INR per share. See more details about Tata Power Company Limited earnings.
Tata Power Company Limited revenue for the last quarter amounts to 139.48 B INR, despite the estimated figure of 155.93 B INR. In the next quarter, revenue is expected to reach 174.13 B INR.
TATAPOWER net income for the last quarter is 7.72 B INR, while the quarter before that showed 9.19 B INR of net income which accounts for −16.04% change. Track more Tata Power Company Limited financial stats to get the full picture.
Yes, TATAPOWER dividends are paid annually. The last dividend per share was 2.25 INR. As of today, Dividend Yield (TTM)% is 0.60%. Tracking Tata Power Company Limited dividends might help you take more informed decisions.
Tata Power Company Limited dividend yield was 0.60% in 2024, and payout ratio reached 18.12%. The year before the numbers were 0.51% and 17.30% correspondingly. See high-dividend stocks and find more opportunities for your portfolio.
As of Feb 16, 2026, the company has 105.37 K employees. See our rating of the largest employees — is Tata Power Company Limited on this list?
EBITDA measures a company's operating performance, its growth signifies an improvement in the efficiency of a company. Tata Power Company Limited EBITDA is 137.41 B INR, and current EBITDA margin is 21.19%. See more stats in Tata Power Company Limited financial statements.
Like other stocks, TATAPOWER shares are traded on stock exchanges, e.g. Nasdaq, Nyse, Euronext, and the easiest way to buy them is through an online stock broker. To do this, you need to open an account and follow a broker's procedures, then start trading. You can trade Tata Power Company Limited stock right from TradingView charts — choose your broker and connect to your account.
Investing in stocks requires a comprehensive research: you should carefully study all the available data, e.g. company's financials, related news, and its technical analysis. So Tata Power Company Limited technincal analysis shows the buy rating today, and its 1 week rating is neutral. Since market conditions are prone to changes, it's worth looking a bit further into the future — according to the 1 month rating Tata Power Company Limited stock shows the buy signal. See more of Tata Power Company Limited technicals for a more comprehensive analysis.
If you're still not sure, try looking for inspiration in our curated watchlists.
If you're still not sure, try looking for inspiration in our curated watchlists.