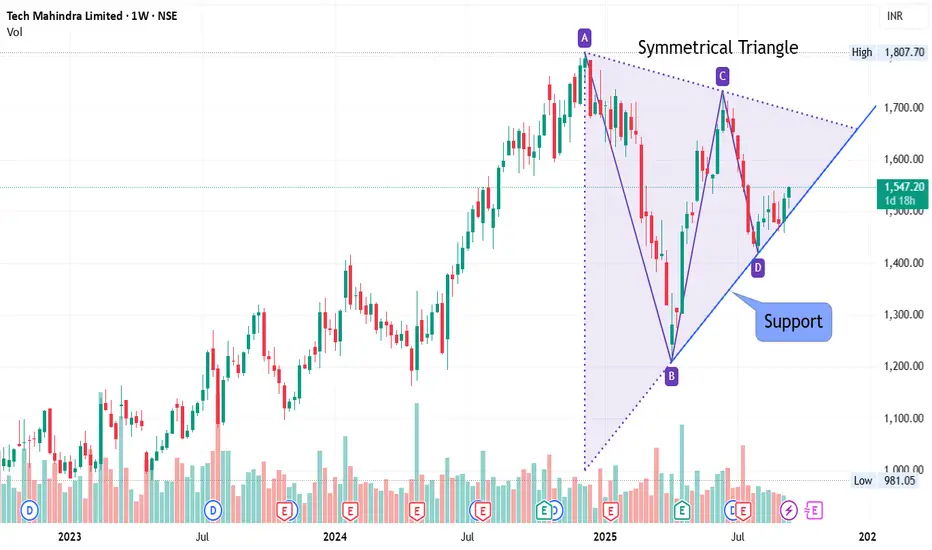
At Support - Weekly Chart - TECHM📊 Script: TECHM
📊 Industry: IT - Software (Computers - Software & Consulting)
Key highlights: 💡⚡
📈On Weekly Chart Script is forming symmetrical triangle and trading near support line.
📈 Script is trading at upper band of BB.
📈 MACD and Double Moving Averages are giving Crossover
📈 Right now RSI is
Next report date
—
Report period
—
EPS estimate
—
Revenue estimate
—
50.70 INR
42.52 B INR
529.88 B INR
635.29 M
About Tech Mahindra Limited
Sector
Industry
CEO
Mohit Joshi
Website
Headquarters
Pune
Founded
2010
ISIN
INE669C01036
FIGI
BBG000CXKQ30
Tech Mahindra Ltd. operates as a holding company. It engages in the provision of information technology solutions. The firm operates through the Information Technology Services and Business Processing Outsourcing segments. It provides computer programming, consultancy and related services, networking technology solutions, and business support services to the global telecommunications industries. The company was founded on October 24, 1986 and is headquartered in Pune, India.
Related stocks
TECHMTECH MAHINDRA IS CURRENTLY TRADING AT VERY GOOD LEVEL, From this level we can see a good upside move. keep this on radar. if it is going down stop loss will be as per given levels.
Techm 1600Techm at good buying level, double bottom on weekly chart .
Next target 1600 in short term .
Idea invalidates if it closes below 1535.
Wait & hold
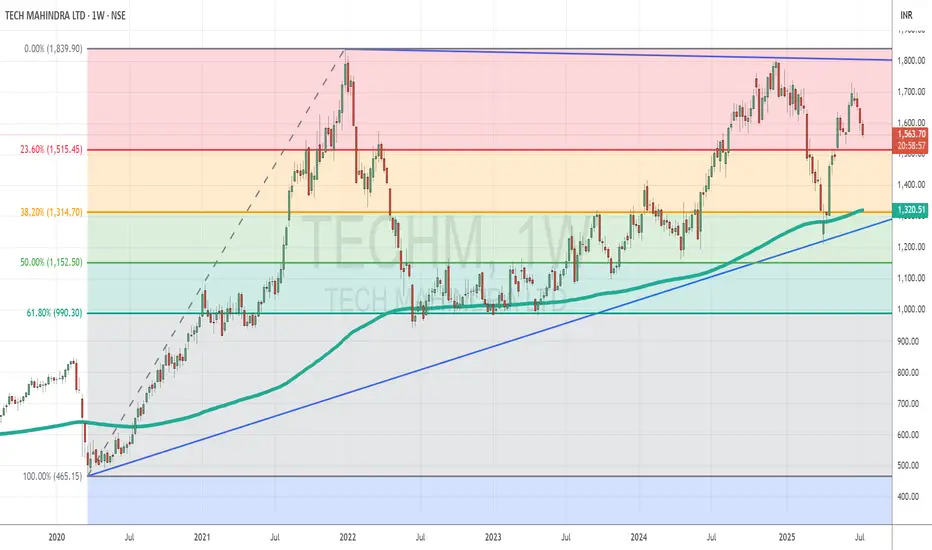
Tech Mahindra Consolidates in a Wedge After Strong Support at KeTopic Statement:
TechM has been stuck in a consolidation zone, rebounding from strong support levels and forming a wedge pattern that may signal an upcoming breakout.
Key Points:
* The stock corrected up to the 30% Fibonacci retracement level, finding strong support around 1314
* It touched the 200
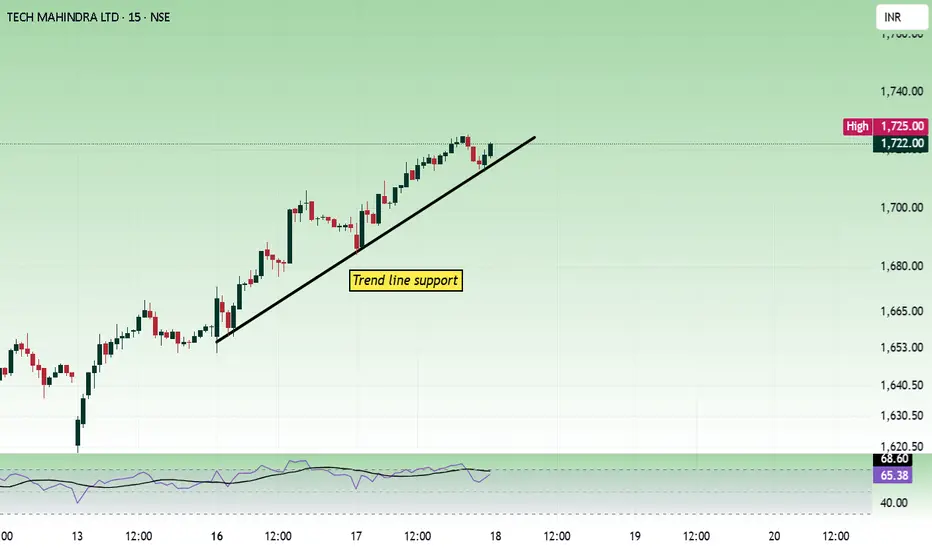
TechMPrice is having trend line support and moving in a steady uptrend.1700 - 1720 is the trend deciding zone. Sustaining above this is important to continue the uptrend.
Buy above 1722 with the stop loss 1704 for the targets 1736, 1758, 1774 and 1796.
Always do your own analysis before taking any trade.
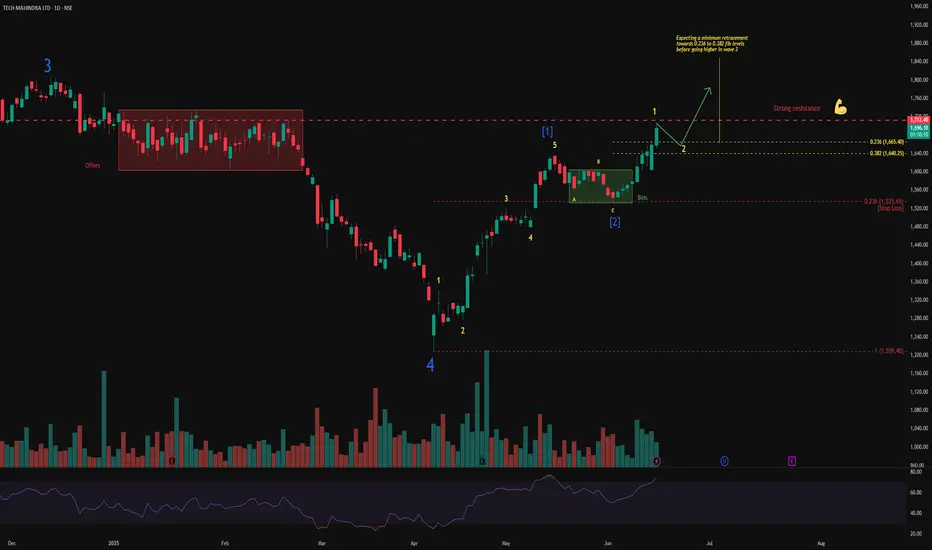
Wave 3 Setup Building in TECH MAHINDRA?After completing Wave 4, TECHM has started a new impulsive structure. Wave was followed by a clear A-B-C flat correction, forming Wave near the demand zone. The recent breakout indicates the beginning of Wave 1 of a larger Wave 3.
Supporting signals:
Strong volume during impulsive rallies.
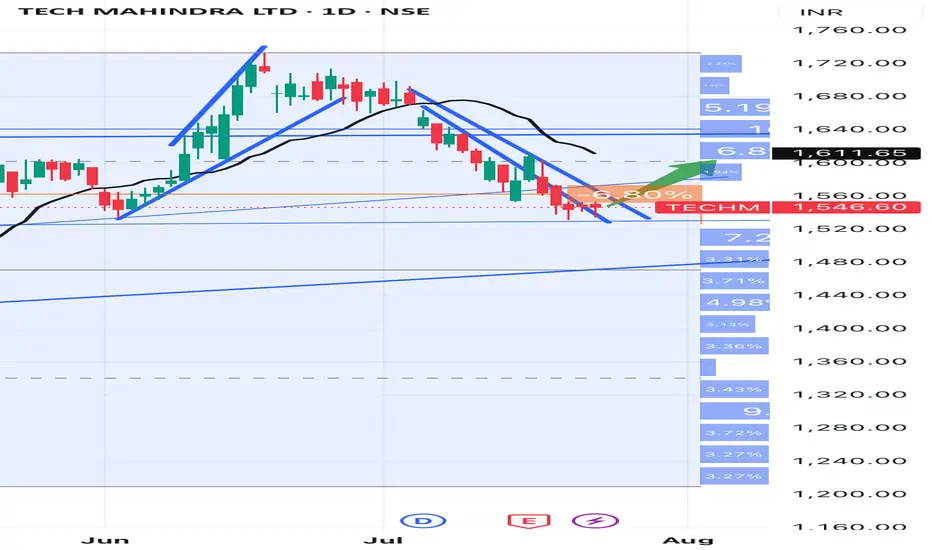
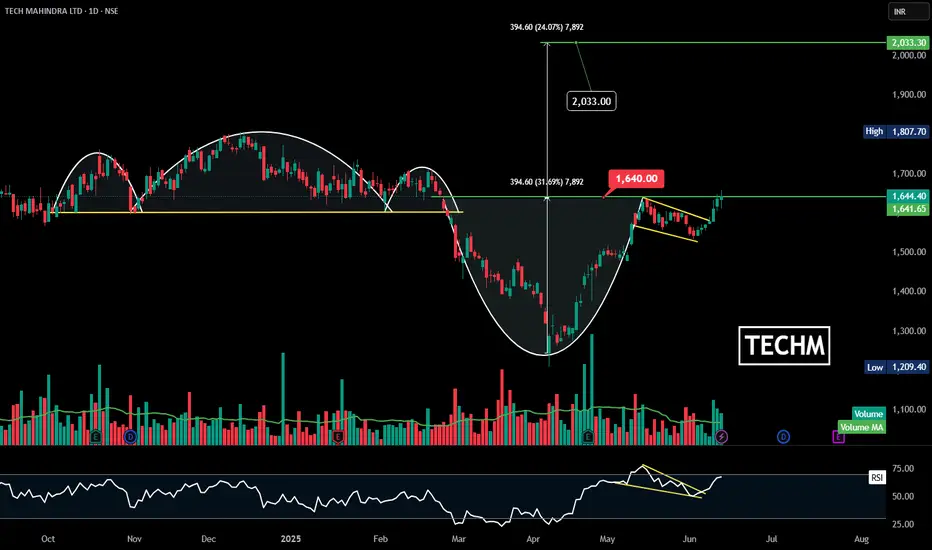
TECHM | Cup and Handle | Breakout | Daily
### 🏆 Pattern: **Cup & Handle Breakout**
* **Cup Formation**: Rounded bottom from Jan to April 2025.
* **Handle**: A bullish flag/pennant formed after the initial breakout near ₹1640 zone.
* Breakout is now **confirmed** with price pushing past the handle resistance.
---
### 📈 Price Target:
*
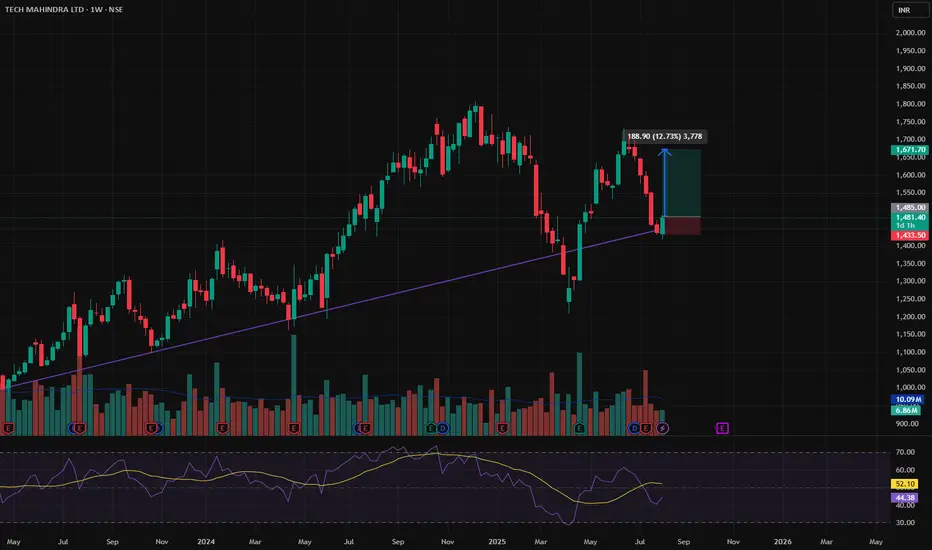
TechM - Flag Breakout A good Flag Breakout on Daily Chart.
Indicators is also showing strength.
Breakout above 1610
Flag height - 425 points
Target - 2000
#ShortTerm Trade.

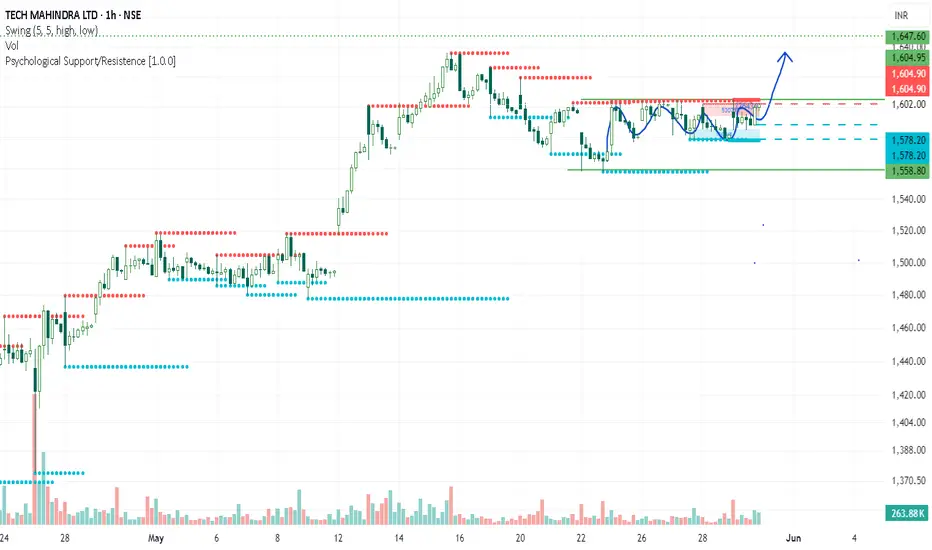
TCh M is ready to break out?Today we see up trend in IT sector. Infy almost move up arround 11%. Nifty and Banknifty closed in uptrend, It showed bull run at time of closing.
Tech Mahindra on hourly timeframe showing flat pattern, we can expected up move after TchM break 1600 and price remain above.
1st resistance at 1660 and
Tech Mahindra LimitedTech Mahindra Limited is a leading Indian multinational information technology (IT) services and consulting company, part of the Mahindra Group. Headquartered in Pune, Maharashtra, with its registered office in Mumbai, the company operates globally, offering a wide range of services across various i

See all ideas
Summarizing what the indicators are suggesting.
Neutral
SellBuy
Strong sellStrong buy
Strong sellSellNeutralBuyStrong buy
Neutral
SellBuy
Strong sellStrong buy
Strong sellSellNeutralBuyStrong buy
Neutral
SellBuy
Strong sellStrong buy
Strong sellSellNeutralBuyStrong buy
An aggregate view of professional's ratings.
Neutral
SellBuy
Strong sellStrong buy
Strong sellSellNeutralBuyStrong buy
Neutral
SellBuy
Strong sellStrong buy
Strong sellSellNeutralBuyStrong buy
Neutral
SellBuy
Strong sellStrong buy
Strong sellSellNeutralBuyStrong buy
Displays a symbol's price movements over previous years to identify recurring trends.
Frequently Asked Questions
The current price of TECHM is 1,451.40 INR — it has decreased by −0.67% in the past 24 hours. Watch Tech Mahindra Limited stock price performance more closely on the chart.
Depending on the exchange, the stock ticker may vary. For instance, on NSE exchange Tech Mahindra Limited stocks are traded under the ticker TECHM.
TECHM stock has risen by 2.44% compared to the previous week, the month change is a −0.93% fall, over the last year Tech Mahindra Limited has showed a −13.61% decrease.
We've gathered analysts' opinions on Tech Mahindra Limited future price: according to them, TECHM price has a max estimate of 1,950.00 INR and a min estimate of 1,110.00 INR. Watch TECHM chart and read a more detailed Tech Mahindra Limited stock forecast: see what analysts think of Tech Mahindra Limited and suggest that you do with its stocks.
TECHM reached its all-time high on Dec 30, 2021 with the price of 1,838.00 INR, and its all-time low was 51.25 INR and was reached on Jan 23, 2009. View more price dynamics on TECHM chart.
See other stocks reaching their highest and lowest prices.
See other stocks reaching their highest and lowest prices.
TECHM stock is 1.49% volatile and has beta coefficient of 1.10. Track Tech Mahindra Limited stock price on the chart and check out the list of the most volatile stocks — is Tech Mahindra Limited there?
Today Tech Mahindra Limited has the market capitalization of 1.43 T, it has decreased by −0.36% over the last week.
Yes, you can track Tech Mahindra Limited financials in yearly and quarterly reports right on TradingView.
Tech Mahindra Limited is going to release the next earnings report on Feb 4, 2026. Keep track of upcoming events with our Earnings Calendar.
TECHM earnings for the last quarter are 13.46 INR per share, whereas the estimation was 13.52 INR resulting in a −0.42% surprise. The estimated earnings for the next quarter are 15.84 INR per share. See more details about Tech Mahindra Limited earnings.
Tech Mahindra Limited revenue for the last quarter amounts to 139.95 B INR, despite the estimated figure of 139.84 B INR. In the next quarter, revenue is expected to reach 141.87 B INR.
TECHM net income for the last quarter is 11.95 B INR, while the quarter before that showed 11.41 B INR of net income which accounts for 4.73% change. Track more Tech Mahindra Limited financial stats to get the full picture.
Tech Mahindra Limited dividend yield was 3.17% in 2024, and payout ratio reached 93.74%. The year before the numbers were 3.20% and 150.02% correspondingly. See high-dividend stocks and find more opportunities for your portfolio.
As of Nov 13, 2025, the company has 119.34 K employees. See our rating of the largest employees — is Tech Mahindra Limited on this list?
EBITDA measures a company's operating performance, its growth signifies an improvement in the efficiency of a company. Tech Mahindra Limited EBITDA is 77.80 B INR, and current EBITDA margin is 13.48%. See more stats in Tech Mahindra Limited financial statements.
Like other stocks, TECHM shares are traded on stock exchanges, e.g. Nasdaq, Nyse, Euronext, and the easiest way to buy them is through an online stock broker. To do this, you need to open an account and follow a broker's procedures, then start trading. You can trade Tech Mahindra Limited stock right from TradingView charts — choose your broker and connect to your account.
Investing in stocks requires a comprehensive research: you should carefully study all the available data, e.g. company's financials, related news, and its technical analysis. So Tech Mahindra Limited technincal analysis shows the neutral today, and its 1 week rating is sell. Since market conditions are prone to changes, it's worth looking a bit further into the future — according to the 1 month rating Tech Mahindra Limited stock shows the buy signal. See more of Tech Mahindra Limited technicals for a more comprehensive analysis.
If you're still not sure, try looking for inspiration in our curated watchlists.
If you're still not sure, try looking for inspiration in our curated watchlists.