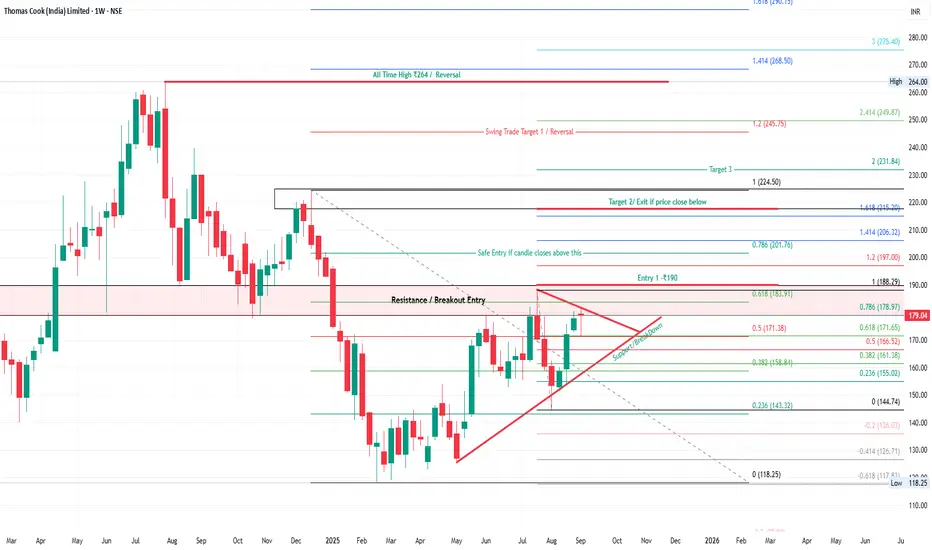
Thomas Cook – Triangle Breakout SetupThomas Cook is forming a triangle breakout structure on the weekly chart. Price is consolidating near resistance around ₹183–₹188. A weekly close above ₹190 will confirm breakout strength. Safe entry is above ₹190, with positional upside targets aligning with Fibonacci extensions.
📌 Key Technical H
Thomas Cook (India) Limited
No trades
Next report date
—
Report period
—
EPS estimate
—
Revenue estimate
—
5.26 INR
2.54 B INR
81.40 B INR
160.83 M
About Thomas Cook (India) Limited
Sector
Industry
CEO
Mahesh Chandran Iyer
Website
Headquarters
Mumbai
Founded
1881
IPO date
Jan 9, 1995
Identifiers
2
ISIN INE332A01027
Thomas Cook (India) Ltd. is a holding company, which engages in the provision of travel and travel related financial services. It offers foreign exchange, corporate travel, MICE, leisure travel, insurance, visa and passport services, and e-business. It operates through the following business segments: Financial Services, Travel and Related Services, Leisure Hospitality and Resorts Business, and Digiphoto Imaging Services. The Financial Services segment includes wholesale purchase and sale of foreign currencies and paid documents. The Travel and Related Services segment covers the operations, travel management, visa services, travel insurance, and related servicesThe Leisure Hospitality and Resorts Business segment relates to the time share holidays' business. The Digiphoto Imaging Services segment focuses on imaging solutions and related services. The company was founded in 1881 and is headquartered in Mumbai, India.
Related stocks
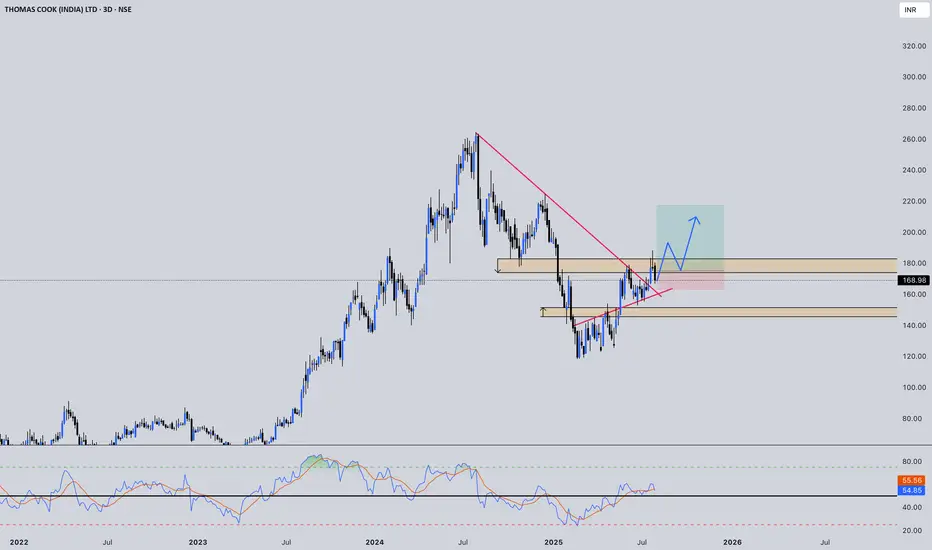
THOMAS COOK: Bullish Momentum Confirmation Pending- Wait for the momentum to break the immdiate marked golden zone resistance.
- View is bullish. RRR looks favourable.
⚠️ Disclaimer: This is NOT a buy/sell recommendation. This post is meant for learning purposes only. Views are personal. Please, do your due diligence before investing.⚠️
💬 Share y
Breakout from Resistance| Element | Details |
| ----------- | -------------------------|
| Trend | Bullish |
| CMP | ₹172.62 |
| Stop Loss | ₹157-155 |
| Target 1 | ₹210 |
| Target 2 | ₹255

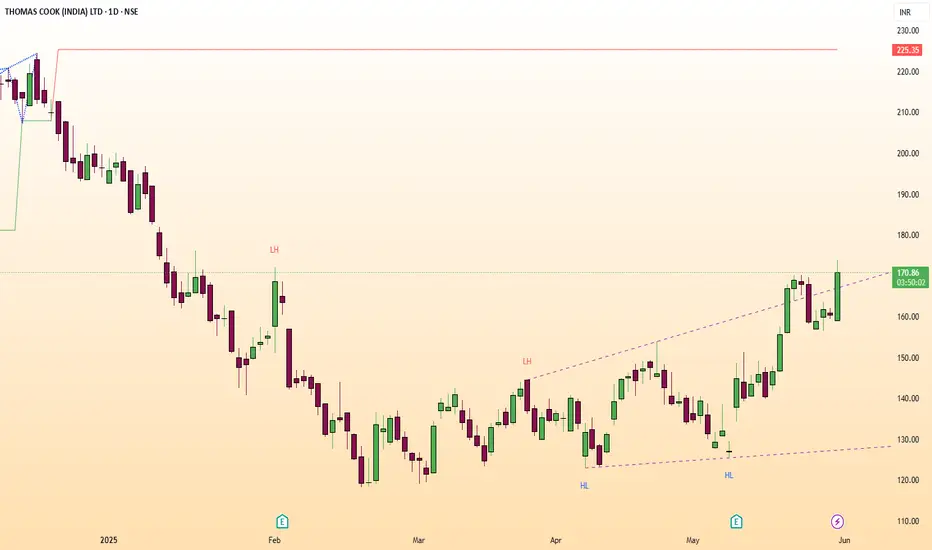
THOMASCOOK LONG ENTRY🚨 Breakout Watch: Thomas Cook 🚨
Bullish above ₹171 (Close). CMP ₹170. Target ₹200–₹240+. Invalid below ₹140.
Volume spiked 818%. RSI strong across timeframes (D: 65.97, W: 55.68, M: 53.65).
ADX 27.92 with 62.96% DMI spread — strong trend.
Price at upper Donchian. Bollinger Bands expanding (45.58%).
Thomas Cook - Early Trend Reversal SignalsNSE:THOMASCOOK Made Beautiful Chart Structure today Before Q4 Results with Good Price and Volume action.
Price Action and Base Formation Analysis:
Consolidation Base:
The stock has formed a critical consolidation base in the ₹130-140 zone:
1. Base Characteristics:
- Horizontal support zon

Thomas Cook - Approaching Trendline supportThomas Cook :
Approaching Trendline support
200 is a crucial level, if broken 190 seems feasible, watch out

THOMASCOOK BULLISH BREAKOUTIts a up flag breakout with good volume.Breakout is happened after a long consolidation

Thomascook is consolidating and looks promisingThomas Cook is looking good from a chart and risk perspective. Additionally, it has just gotten an AA rating from Crisil. This makes it a good candidate for some quick moves. I have tried to add some negative points as well to consider. Please note, this is only my view and do not invest your precio

Thomas Cook, one simple horizontal line setupTraveling is booming in India post covid.
And travel companies are enjoying this piece of pie.
-Posted growth YoY EPS growth, OPM% also improving.
-Near Major resistance, under which it is consolidating for 50 days (good consolidation)
-Good Shakeout, when price went below major ema (here 21 dema)

THOMASCOOK | SWING BUY | FLAG BREAKOUTAnalysis: THOMASCOOK has formed a flag pattern and it has broken out and shows strong uptrend potential with solid technical indicators.
Entry: Consider current price
Disclaimer: For informational purposes only. Do your research or consult a financial advisor.

See all ideas
Summarizing what the indicators are suggesting.
Neutral
SellBuy
Strong sellStrong buy
Strong sellSellNeutralBuyStrong buy
Neutral
SellBuy
Strong sellStrong buy
Strong sellSellNeutralBuyStrong buy
Neutral
SellBuy
Strong sellStrong buy
Strong sellSellNeutralBuyStrong buy
An aggregate view of professional's ratings.
Neutral
SellBuy
Strong sellStrong buy
Strong sellSellNeutralBuyStrong buy
Neutral
SellBuy
Strong sellStrong buy
Strong sellSellNeutralBuyStrong buy
Neutral
SellBuy
Strong sellStrong buy
Strong sellSellNeutralBuyStrong buy
Displays a symbol's price movements over previous years to identify recurring trends.
Frequently Asked Questions
The current price of THOMASCOOK is 112.88 INR — it has decreased by −1.10% in the past 24 hours. Watch Thomas Cook (India) Limited stock price performance more closely on the chart.
Depending on the exchange, the stock ticker may vary. For instance, on NSE exchange Thomas Cook (India) Limited stocks are traded under the ticker THOMASCOOK.
THOMASCOOK stock has fallen by −6.35% compared to the previous week, the month change is a −17.52% fall, over the last year Thomas Cook (India) Limited has showed a −14.36% decrease.
We've gathered analysts' opinions on Thomas Cook (India) Limited future price: according to them, THOMASCOOK price has a max estimate of 213.00 INR and a min estimate of 155.00 INR. Watch THOMASCOOK chart and read a more detailed Thomas Cook (India) Limited stock forecast: see what analysts think of Thomas Cook (India) Limited and suggest that you do with its stocks.
THOMASCOOK reached its all-time high on Jul 30, 2024 with the price of 264.00 INR, and its all-time low was 6.21 INR and was reached on Apr 29, 2003. View more price dynamics on THOMASCOOK chart.
See other stocks reaching their highest and lowest prices.
See other stocks reaching their highest and lowest prices.
THOMASCOOK stock is 2.79% volatile and has beta coefficient of 1.54. Track Thomas Cook (India) Limited stock price on the chart and check out the list of the most volatile stocks — is Thomas Cook (India) Limited there?
Today Thomas Cook (India) Limited has the market capitalization of 53.53 B, it has decreased by −3.08% over the last week.
Yes, you can track Thomas Cook (India) Limited financials in yearly and quarterly reports right on TradingView.
Thomas Cook (India) Limited is going to release the next earnings report on May 20, 2026. Keep track of upcoming events with our Earnings Calendar.
THOMASCOOK net income for the last quarter is 417.00 M INR, while the quarter before that showed 664.40 M INR of net income which accounts for −37.24% change. Track more Thomas Cook (India) Limited financial stats to get the full picture.
Yes, THOMASCOOK dividends are paid annually. The last dividend per share was 0.45 INR. As of today, Dividend Yield (TTM)% is 0.39%. Tracking Thomas Cook (India) Limited dividends might help you take more informed decisions.
Thomas Cook (India) Limited dividend yield was 0.33% in 2024, and payout ratio reached 8.24%. The year before the numbers were 0.36% and 10.77% correspondingly. See high-dividend stocks and find more opportunities for your portfolio.
As of Feb 12, 2026, the company has 2.35 K employees. See our rating of the largest employees — is Thomas Cook (India) Limited on this list?
EBITDA measures a company's operating performance, its growth signifies an improvement in the efficiency of a company. Thomas Cook (India) Limited EBITDA is 4.51 B INR, and current EBITDA margin is 5.95%. See more stats in Thomas Cook (India) Limited financial statements.
Like other stocks, THOMASCOOK shares are traded on stock exchanges, e.g. Nasdaq, Nyse, Euronext, and the easiest way to buy them is through an online stock broker. To do this, you need to open an account and follow a broker's procedures, then start trading. You can trade Thomas Cook (India) Limited stock right from TradingView charts — choose your broker and connect to your account.
Investing in stocks requires a comprehensive research: you should carefully study all the available data, e.g. company's financials, related news, and its technical analysis. So Thomas Cook (India) Limited technincal analysis shows the strong sell today, and its 1 week rating is sell. Since market conditions are prone to changes, it's worth looking a bit further into the future — according to the 1 month rating Thomas Cook (India) Limited stock shows the sell signal. See more of Thomas Cook (India) Limited technicals for a more comprehensive analysis.
If you're still not sure, try looking for inspiration in our curated watchlists.
If you're still not sure, try looking for inspiration in our curated watchlists.