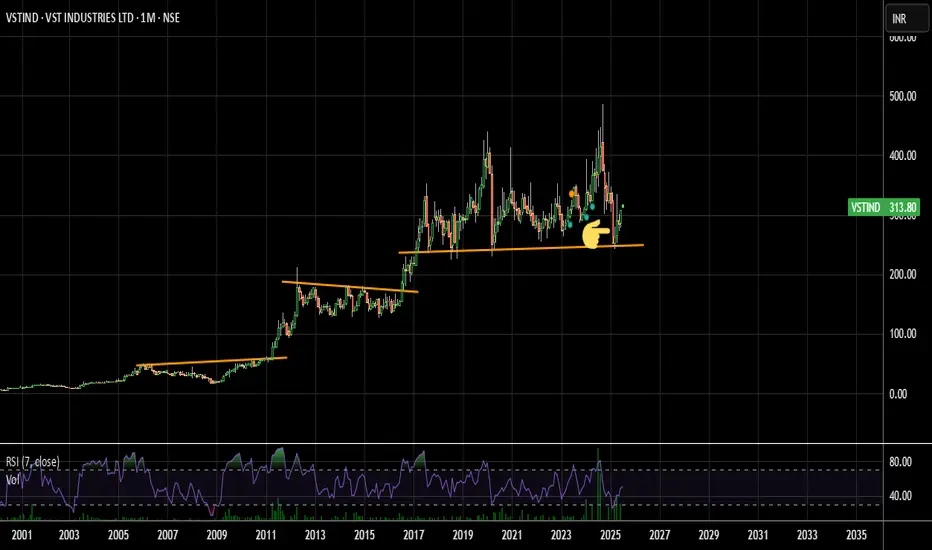
VST Industries Ltd. engages in the provision of manufacture and sale of cigarettes and unmanufactured tobacco. It operates through the Sales Within India and Sales Outside India geographical segments. The company was founded on November 10, 1930 and is headquartered in Hyderabad, India.
Displays a symbol's price movements over previous years to identify recurring trends.
Frequently asked questions
The current price of VSTIND is 200.86 INR — it has increased by 0.00% in the past 24 hours. Watch VST Industries Limited stock price performance more closely on the chart.
Depending on the exchange, the stock ticker may vary. For instance, on NSE exchange VST Industries Limited stocks are traded under the ticker VSTIND.
VSTIND stock has fallen by −0.96% compared to the previous week, the month change is a −2.72% fall, over the last year VST Industries Limited has showed a −23.86% decrease.
VSTIND reached its all-time high on Sep 6, 2024 with the price of 486.15 INR, and its all-time low was 4.56 INR and was reached on May 23, 2000. View more price dynamics on VSTIND chart. See other stocks reaching their highest and lowest prices.
VSTIND stock is 1.55% volatile and has beta coefficient of 0.68. Track VST Industries Limited stock price on the chart and check out the list of the most volatile stocks — is VST Industries Limited there?
Today VST Industries Limited has the market capitalization of 34.21 B, it has decreased by −0.42% over the last week.
VST Industries Limited is going to release the next earnings report on Oct 22, 2026. Keep track of upcoming events with our Earnings Calendar.
VSTIND net income for the last quarter is 424.20 M INR, while the quarter before that showed 1.17 B INR of net income which accounts for 0.00% change. Track more VST Industries Limited financial stats to get the full picture.
Yes, VSTIND dividends are paid annually. The last dividend per share was 12.00 INR. As of today, Dividend Yield (TTM)% is 5.96%. Tracking VST Industries Limited dividends might help you take more informed decisions.
VST Industries Limited dividend yield was 6.00% in 2025, and payout ratio reached 69.75%. The year before the numbers were 3.81% and 58.49% correspondingly. See high-dividend stocks and find more opportunities for your portfolio.
As of Oct 9, 2026, the company has 712 employees. See our rating of the largest employees — is VST Industries Limited on this list?
EBITDA measures a company's operating performance, its growth signifies an improvement in the efficiency of a company. VST Industries Limited EBITDA is 4.23 B INR, and current EBITDA margin is 31.24%. See more stats in VST Industries Limited financial statements.
Like other stocks, VSTIND shares are traded on stock exchanges, e.g. Nasdaq, Nyse, Euronext, and the easiest way to buy them is through an online stock broker. To do this, you need to open an account and follow a broker's procedures, then start trading. You can trade VST Industries Limited stock right from TradingView charts — choose your broker and connect to your account.
Investing in stocks requires a comprehensive research: you should carefully study all the available data, e.g. company's financials, related news, and its technical analysis. So VST Industries Limited technincal analysis shows the sell today, and its 1 week rating is strong sell. Since market conditions are prone to changes, it's worth looking a bit further into the future — according to the 1 month rating VST Industries Limited stock shows the sell signal. See more of VST Industries Limited technicals for a more comprehensive analysis.
 Long