BankNifty 1 Day Time Frame 📊 1-Day Timeframe Technical Analysis
Current Price: ₹56,204.60
Day's Range: ₹55,843.90 – ₹56,286.25
52-Week Range: ₹47,702.90 – ₹57,628.40
Year-to-Date Return: +10.39%
1-Month Return: +3.56%
🔧 Technical Indicators
Trend: Neutral
Resistance Levels: ₹56,230 (immediate), ₹56,600 (stronger)
Support Lev
Related futures
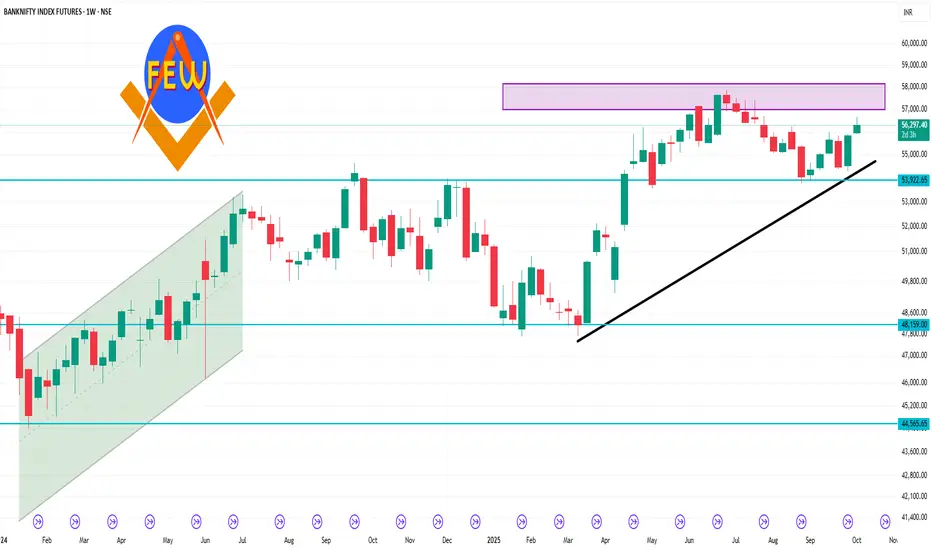
Banknifty 1 Week Time Frame 📊 Current Technical Snapshot
Spot Level: Approximately 55,900
Trend: Neutral to slightly bullish
Support Levels: 55,531; 55,778; 56,009
Resistance Levels: 56,486; 56,733; 56,964
🔍 Key Observations
Consolidation Zone: The Bank Nifty is trading within a defined range, with immediate support near 55,
Part 1 Master Candle Stick Pattern1. Long Call Strategy – Betting on Upside
One of the simplest option strategies is buying a long call. Traders use this when they are bullish but want to risk less capital than buying the stock outright.
Maximum Loss: Limited to premium paid.
Maximum Profit: Unlimited (stock can theoretically ris

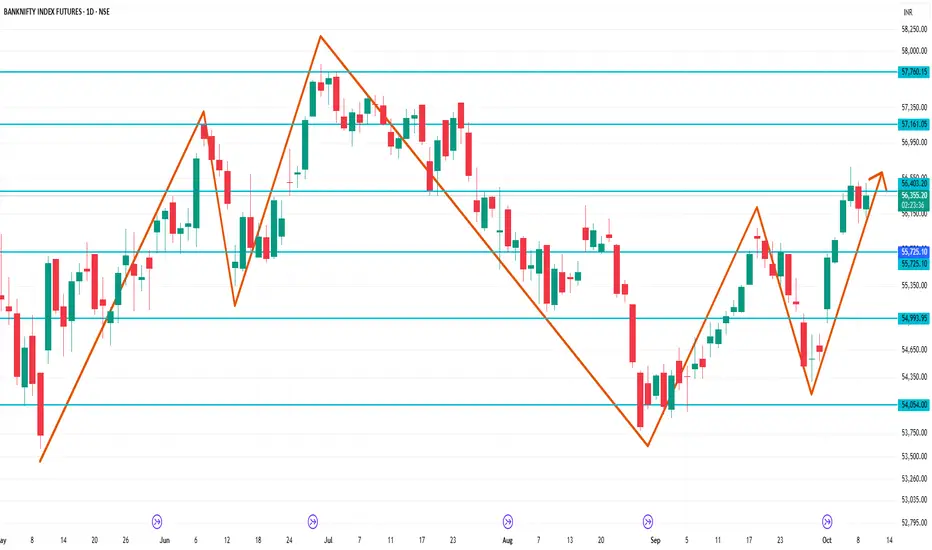
bearish momentum in banknifty1 hr supply has been broken and there is no achievement in this wave/rally of banknifty since its upward movement .

BANKNIFTY FUTURE TRG 55584Banknifty Futures Bullish above 54385 for Trg 55584. Exit if closes below previous day low on trailing basis. Imp Date 15th Sept Mark H/L
Trgs are derived from Time & Angles.
Chk for updates.

short/bearish for Bankniftyi have took the opportunity to long it now its time for short, wait for its confirmation in 15-5 mins

Part 4 Learn Institutional Trading Risks of Options Trading
Options can be powerful but come with risks:
Time Decay (Theta): Options lose value as expiry nears.
High Volatility: Premiums can fluctuate wildly.
Leverage Trap: While leverage amplifies profits, it also magnifies losses.
Unlimited Risk (for Sellers): If you sell opti

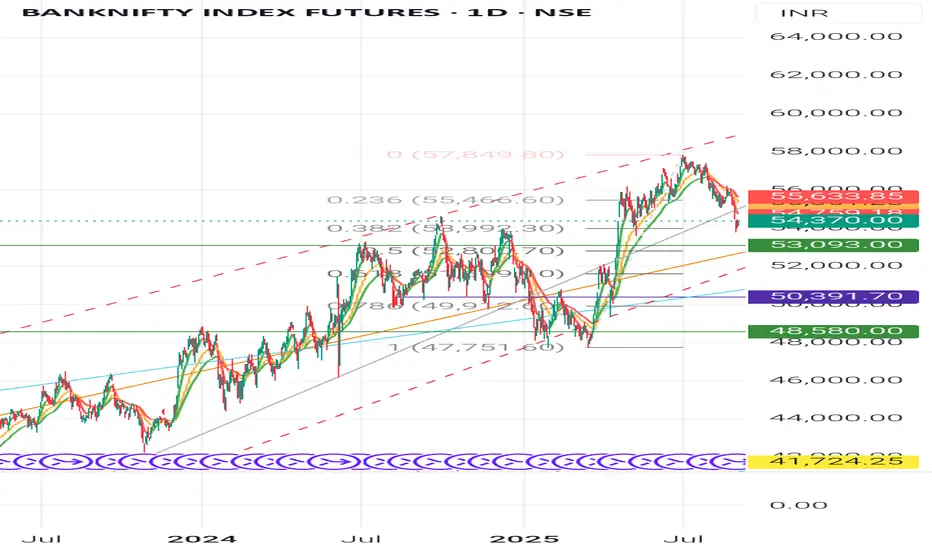
Bank nifty Futures- Consolidation ankNifty Futures (Index) daily
Technical analysis + sector (banking industry) fundamental overview + a learning summary for students.
Technical Analysis (Daily Chart) Candlestick & Chart Pattern👉
Recent candles show selling pressure after the peak near 57,800 (upper trendline rejection).
Curren
Part 6 Learn Institutional Trading Black-Scholes Model
A widely used formula to calculate option prices using:
Stock price
Strike price
Time to expiry
Volatility
Risk-free interest rate
Greeks
Delta: Measures sensitivity of option price to underlying price changes.
Gamma: Measures delta’s rate of change.
Theta: Measures tim

BANKNIFTY :-Smart traders are watching closely..Are you ?💡 Smart traders are watching closely… Are you?
🚀 **BankNifty Futures Update** 🚀
📊 **Support Zone:** 53,950 – 54,275
💹 **CMP:** 55,071
📈 After forming a bullish pattern near this zone, BankNifty could rally **+2,000 to +3,000 points**!
🔍 Current Market Scenario:
BankNifty Futures is currently tradi

See all ideas
Summarizing what the indicators are suggesting.
Neutral
SellBuy
Strong sellStrong buy
Strong sellSellNeutralBuyStrong buy
Neutral
SellBuy
Strong sellStrong buy
Strong sellSellNeutralBuyStrong buy
Neutral
SellBuy
Strong sellStrong buy
Strong sellSellNeutralBuyStrong buy
A representation of what an asset is worth today and what the market thinks it will be worth in the future.
Displays a symbol's price movements over previous years to identify recurring trends.
Frequently Asked Questions
The current price of GIFT NIFTY BANK INDEX FUTURES is 58,048 USD — it has fallen −0.07% in the past 24 hours. Watch GIFT NIFTY BANK INDEX FUTURES price in more detail on the chart.
Track more important stats on the GIFT NIFTY BANK INDEX FUTURES chart.
Open interest is the number of contracts held by traders in active positions — they're not closed or expired. For GIFT NIFTY BANK INDEX FUTURES this number is 0.00. You can use it to track a prevailing market trend and adjust your own strategy: declining open interest for GIFT NIFTY BANK INDEX FUTURES shows that traders are closing their positions, which means a weakening trend.
Buying or selling futures contracts depends on many factors: season, underlying commodity, your own trading strategy. So mostly it's up to you, but if you look for some certain calculations to take into account, you can study technical analysis for GIFT NIFTY BANK INDEX FUTURES. Today its technical rating is buy, but remember that market conditions change all the time, so it's always crucial to do your own research. See more of GIFT NIFTY BANK INDEX FUTURES technicals for a more comprehensive analysis.