Part 6 Learn Institutional Trading Black-Scholes Model
A widely used formula to calculate option prices using:
Stock price
Strike price
Time to expiry
Volatility
Risk-free interest rate
Greeks
Delta: Measures sensitivity of option price to underlying price changes.
Gamma: Measures delta’s rate of change.
Theta: Measures tim
Related futures

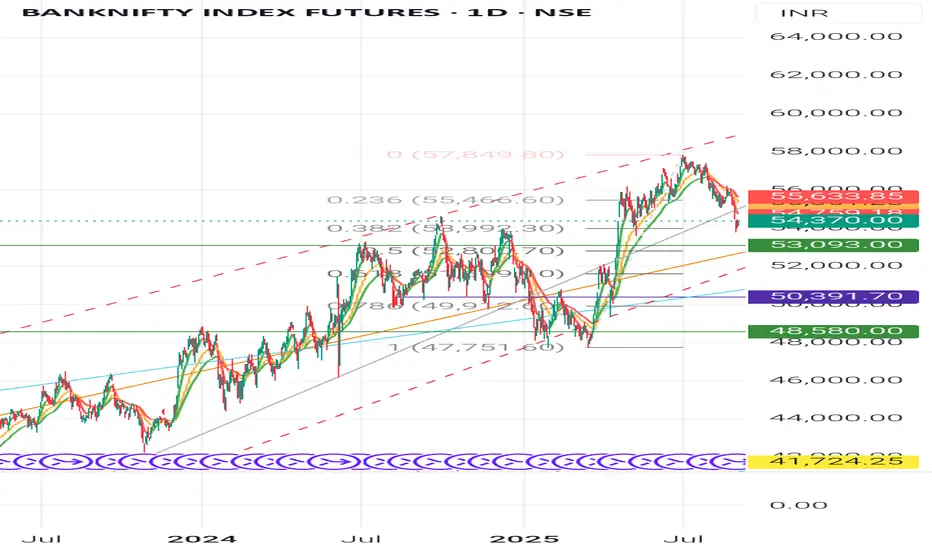
Bank nifty Futures- Consolidation ankNifty Futures (Index) daily
Technical analysis + sector (banking industry) fundamental overview + a learning summary for students.
Technical Analysis (Daily Chart) Candlestick & Chart Pattern👉
Recent candles show selling pressure after the peak near 57,800 (upper trendline rejection).
Curren
BANKNIFTY :-Smart traders are watching closely..Are you ?💡 Smart traders are watching closely… Are you?
🚀 **BankNifty Futures Update** 🚀
📊 **Support Zone:** 53,950 – 54,275
💹 **CMP:** 55,071
📈 After forming a bullish pattern near this zone, BankNifty could rally **+2,000 to +3,000 points**!
🔍 Current Market Scenario:
BankNifty Futures is currently tradi

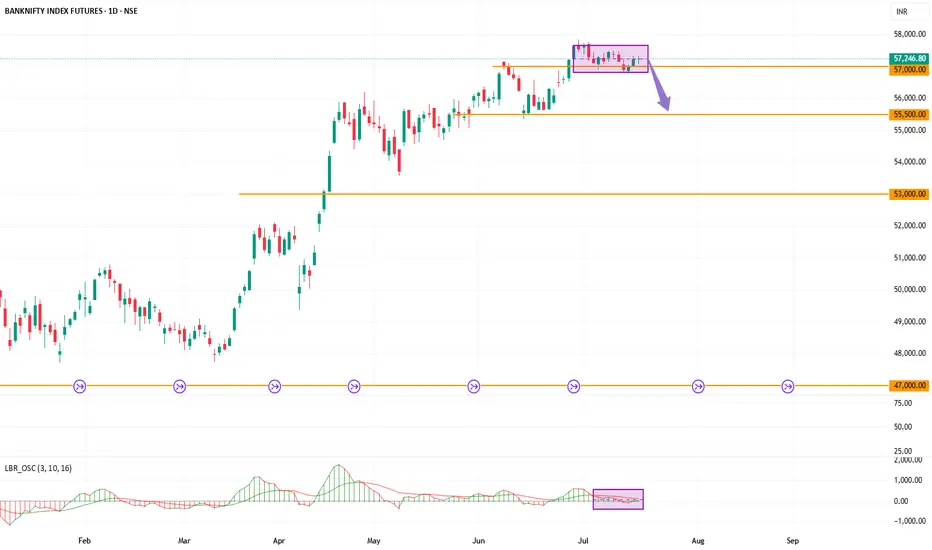
Sell Banknifty at 57250 with target of 56000All good news of Banknifty looks priced in with falling of HDFC bank on news of bonus and extra ordinary dividend. Technically move looks exhausted and can have a down move before resuming uptrend
Exhausted Momentum
Sell on break of box
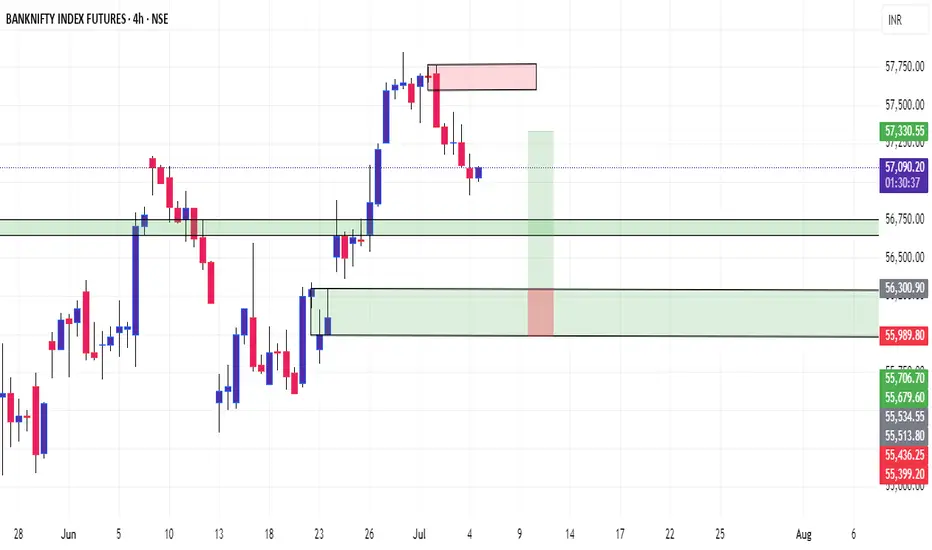
bankinifty long opportunity in 4hr Time Frame Zonei have clearly marked the long entry based on demand candle manage to close above supply(clearly visible in left side of my marked demand zone).
nice opportunity from long term perspective

Learn Institutional Option Trading Part-6Mutual Funds in India:
Mutual funds pool money from multiple investors and invest in a diversified portfolio.
Types:
Equity Mutual Funds
Debt Mutual Funds
Hybrid Funds
Index Funds & ETFs
Systematic Investment Plan (SIP) is a popular method to invest monthly with discipline.
Government Scheme

DAILY TIMEFRAME BANKNIFTY A triangle breakout is a key technical pattern in trading that signals a potential continuation or reversal of a trend. It occurs when price action breaks out of a triangle formation, which can be ascending, descending, or symmetrical.
- Ascending Triangle: Bullish pattern where price breaks above r
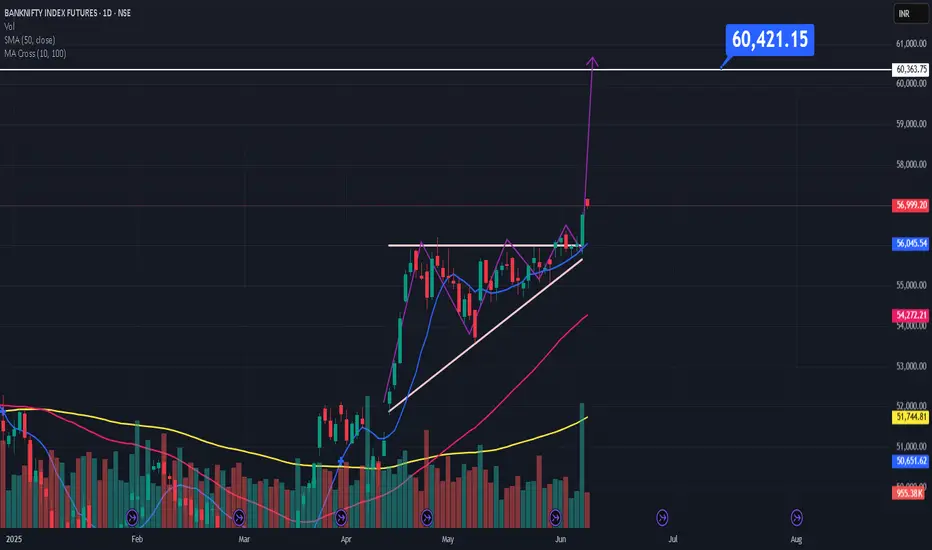
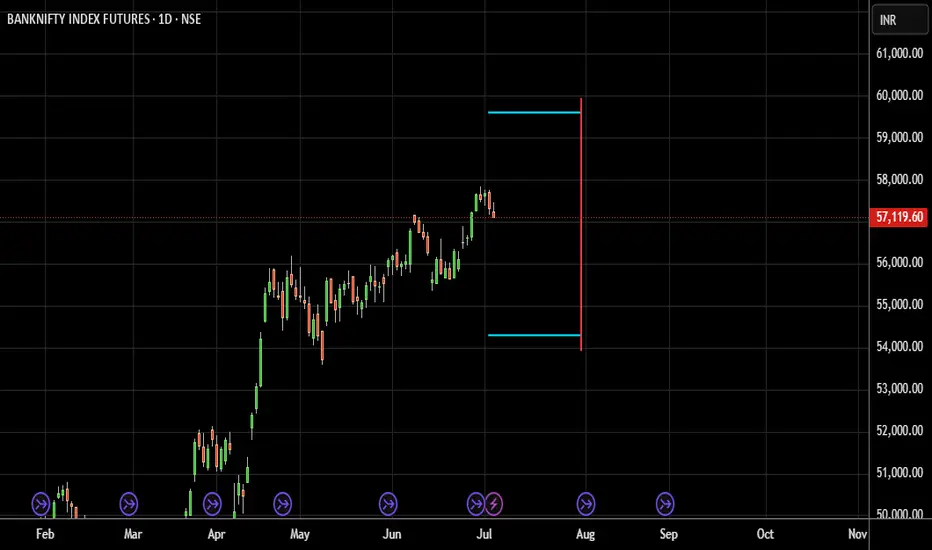
Banknifty 2025-2026 (Expected level)Banknifty. (Only for Experienced traders" )
Enter after " Breakout and Retracement ".
Leave a " Like If you agree ".✌.
Follow for regular updates 👍
.
For " long "
entry: 56000 / 56500
target: 60000- 62350
stoploss: 54800
Enter only if market Breaks
"Yellow box" mentioned.
.
.
For " Short"
entry:

See all ideas
Summarizing what the indicators are suggesting.
Neutral
SellBuy
Strong sellStrong buy
Strong sellSellNeutralBuyStrong buy
Neutral
SellBuy
Strong sellStrong buy
Strong sellSellNeutralBuyStrong buy
Neutral
SellBuy
Strong sellStrong buy
Strong sellSellNeutralBuyStrong buy
A representation of what an asset is worth today and what the market thinks it will be worth in the future.
Displays a symbol's price movements over previous years to identify recurring trends.
Frequently Asked Questions
The current price of GIFT NIFTY BANK INDEX FUTURES is 54,278 USD — it has risen 0.06% in the past 24 hours. Watch GIFT NIFTY BANK INDEX FUTURES price in more detail on the chart.
Track more important stats on the GIFT NIFTY BANK INDEX FUTURES chart.
Open interest is the number of contracts held by traders in active positions — they're not closed or expired. For GIFT NIFTY BANK INDEX FUTURES this number is 150.00. You can use it to track a prevailing market trend and adjust your own strategy: declining open interest for GIFT NIFTY BANK INDEX FUTURES shows that traders are closing their positions, which means a weakening trend.
Buying or selling futures contracts depends on many factors: season, underlying commodity, your own trading strategy. So mostly it's up to you, but if you look for some certain calculations to take into account, you can study technical analysis for GIFT NIFTY BANK INDEX FUTURES. Today its technical rating is sell, but remember that market conditions change all the time, so it's always crucial to do your own research. See more of GIFT NIFTY BANK INDEX FUTURES technicals for a more comprehensive analysis.