Part 6 Learn Institutional Trading Black-Scholes Model
A widely used formula to calculate option prices using:
Stock price
Strike price
Time to expiry
Volatility
Risk-free interest rate
Greeks
Delta: Measures sensitivity of option price to underlying price changes.
Gamma: Measures delta’s rate of change.
Theta: Measures time decay of option.
Vega: Measures sensitivity to volatility.
Rho: Measures sensitivity to interest rates.
Understanding Greeks is critical for managing risk and strategy adjustments.
BANKNIFTY1! trade ideas

Bank nifty Futures- Consolidation ankNifty Futures (Index) daily
Technical analysis + sector (banking industry) fundamental overview + a learning summary for students.
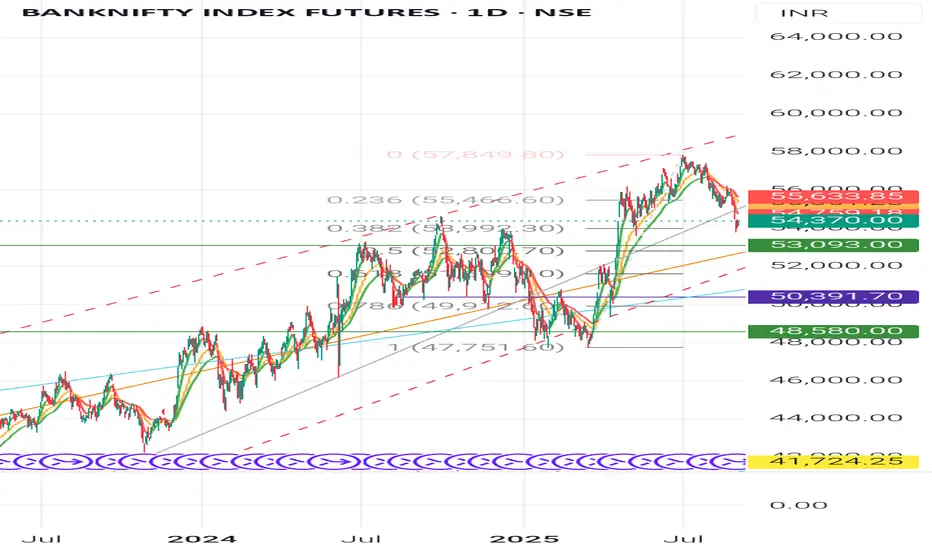
Technical Analysis (Daily Chart) Candlestick & Chart Pattern👉
Recent candles show selling pressure after the peak near 57,800 (upper trendline rejection).
Current candles look like lower highs + lower lows = possible descending channel formation.
The long wicks at support zones indicate buyers are defending near 52,800- 53,000.
Swing Analysis
Major swing high: 57,850
Swing low: 47,750
Retracement happening between 0.382 (53,992) and 0.236 (55,466) Fibonacci levels.
Pattern in Progress
Falling Wedge / Descending Channel forming- often bullish if breakout happens above resistance trendline.
👉If price breaks below 52,800, then deeper correction possible.
Key Levels
-Support
52,800 - 53,000 (critical Fib support)
50,400 - 50,500 (strong demand zone)
48,500 (swing support)
-Resistance
55,000 - 55,500 (Fib cluster + recent rejection)
57,800 (swing high, big breakout point)
60,000 psychological level
Entry Points-
For Long (Investors/Positional)
-Enter near 52,800- 53,000 with SL below 52,500.
Add more if it breaks and sustains above 55,500.
-For Short (Traders):
Below 52,800, short with target 50,400 - 48,500.
Keep SL near 53,600.
Industry Analysis (Banking Sector)
Indian banks are in a strong credit growth cycle (loan demand high, NPA ratios declining).
-RBI’s monetary policy easing in future may improve margins further.
-PSU Banks are gaining strength, but private banks (HDFC, ICICI, Kotak) still dominate.
-Key Fundamental Ratios (Peer Banks)
-ICICI Bank: RoE - 16%, NIM - 4.5%, GNPA <2%
-HDFC Bank: RoE - 15%, NIM - 4.1%, GNPA - 1.5%
-SBI: RoE - 14%, NIM - 3.6%, GNPA - 2.5%
👉 Overall, sector health is positive, but valuation of large banks is already at premium.
-Student Learnings
1. Chart Patterns:
Descending channel/falling wedge = watch for breakouts.
2. Candlestick Wicks:
Long lower shadows = hidden buying.
3. Swing + Fibonacci:
Key tool to identify retracement zones.
4. Support & Resistance:
Always mark levels - entry becomes safer.
5. Fundamentals in Sector Indices:
Index = basket - study sector & top-weight banks, not single balance sheet.
⚠️ Disclaimer
This analysis is for educational purposes only. It is not financial advice. Trading in derivatives (like BankNifty Futures) is highly risky and may lead to capital loss. Please consult your financial advisor before investing.
Follow👣 for more🚩
#BankNifty #StockMarketIndia #TechnicalAnalysis #CandlestickPatterns #SwingTrading #SupportAndResistance #InvestingBasics #BankingSector #StockMarketEducation #FinanceStudents #MarketAnalysis
BANKNIFTY :-Smart traders are watching closely..Are you ?💡 Smart traders are watching closely… Are you?
🚀 **BankNifty Futures Update** 🚀
📊 **Support Zone:** 53,950 – 54,275
💹 **CMP:** 55,071
📈 After forming a bullish pattern near this zone, BankNifty could rally **+2,000 to +3,000 points**!
🔍 Current Market Scenario:
BankNifty Futures is currently trading at CMP 55,071. Over the last few sessions, the index has witnessed consistent selling pressure, but a crucial support zone has now emerged between 53,950 – 54,275. Historically, this zone has triggered strong buying interest and initiated significant reversals.
📊 Technical Observation:
📌 Support Zone: 53,950 – 54,275
📌 CMP: 55,071
📌 Price Action: A bullish reversal pattern (such as a double bottom or bullish engulfing) forming near this zone could trigger a strong upside rally.
📌 Upside Potential: 2,000 – 10,000 points (stage-wise target).
📈 Trading Strategy:
If price tests the support zone and forms a bullish pattern, traders may consider initiating long positions.
Initial target ~ 56500,000, extended target ~ 57,500+.
Maintain a stop-loss below the support zone to manage risk effectively.
💡 Market Psychology Insight:
Currently, sentiment in the financial sector is cautious but prepared. If institutional buying emerges around the support zone, short covering could accelerate, triggering a sharp upward movement.
⚠️ Disclaimer: This analysis is for educational purposes only. Please do your own research and manage risk before trading.
📆 Stay alert, plan your entries, and ride the wave! 🌊

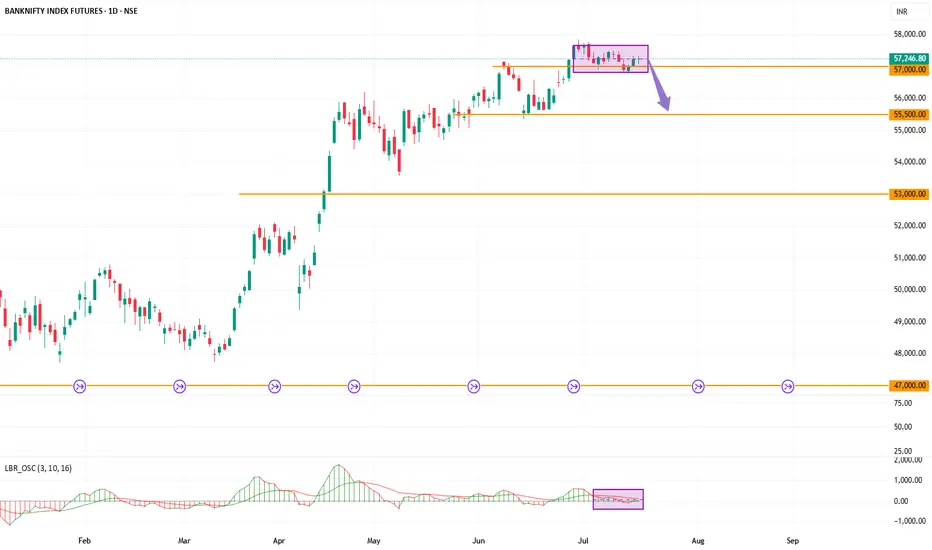
Sell Banknifty at 57250 with target of 56000All good news of Banknifty looks priced in with falling of HDFC bank on news of bonus and extra ordinary dividend. Technically move looks exhausted and can have a down move before resuming uptrend
Exhausted Momentum
Sell on break of box
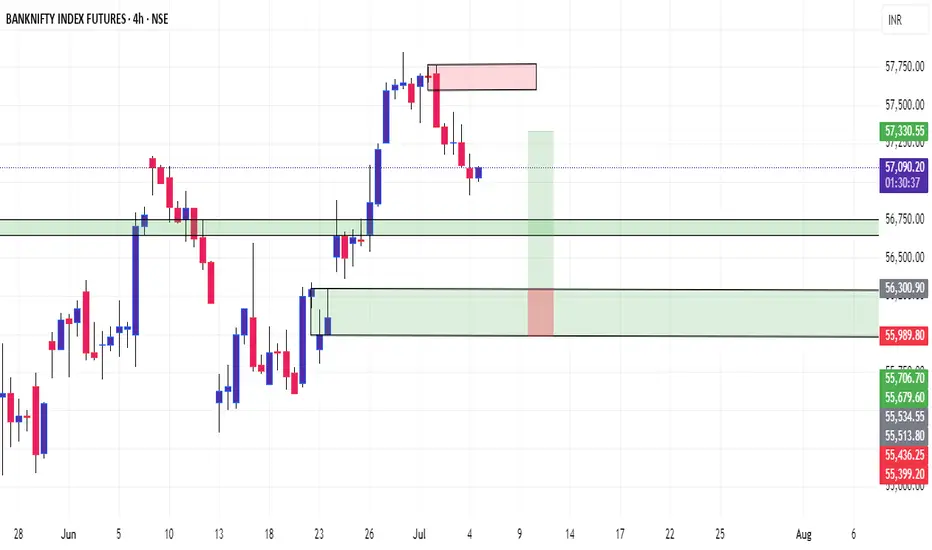
bankinifty long opportunity in 4hr Time Frame Zonei have clearly marked the long entry based on demand candle manage to close above supply(clearly visible in left side of my marked demand zone).
nice opportunity from long term perspective

Learn Institutional Option Trading Part-6Mutual Funds in India:
Mutual funds pool money from multiple investors and invest in a diversified portfolio.
Types:
Equity Mutual Funds
Debt Mutual Funds
Hybrid Funds
Index Funds & ETFs
Systematic Investment Plan (SIP) is a popular method to invest monthly with discipline.
Government Schemes:
PPF (Public Provident Fund)
NSC (National Savings Certificate)
EPF (Employees Provident Fund)
These are safe, tax-efficient, and suitable for conservative investors.

DAILY TIMEFRAME BANKNIFTY A triangle breakout is a key technical pattern in trading that signals a potential continuation or reversal of a trend. It occurs when price action breaks out of a triangle formation, which can be ascending, descending, or symmetrical.
- Ascending Triangle: Bullish pattern where price breaks above resistance.
- Descending Triangle: Bearish pattern where price breaks below support.
- Symmetrical Triangle: Neutral pattern where price can break in either direction.
Traders often look for high volume confirmation to validate the breakout and set targets based on the triangle's height. False breakouts can occur, so risk management is crucial.
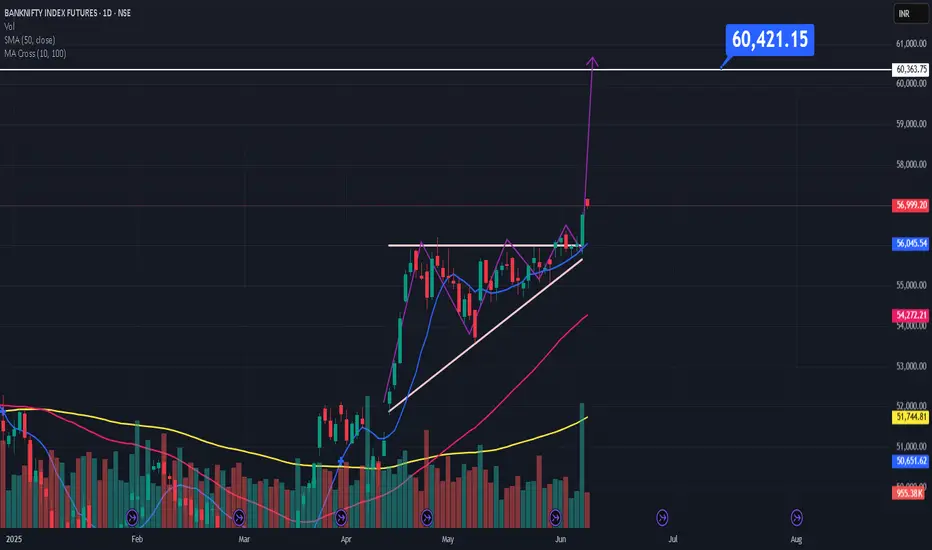
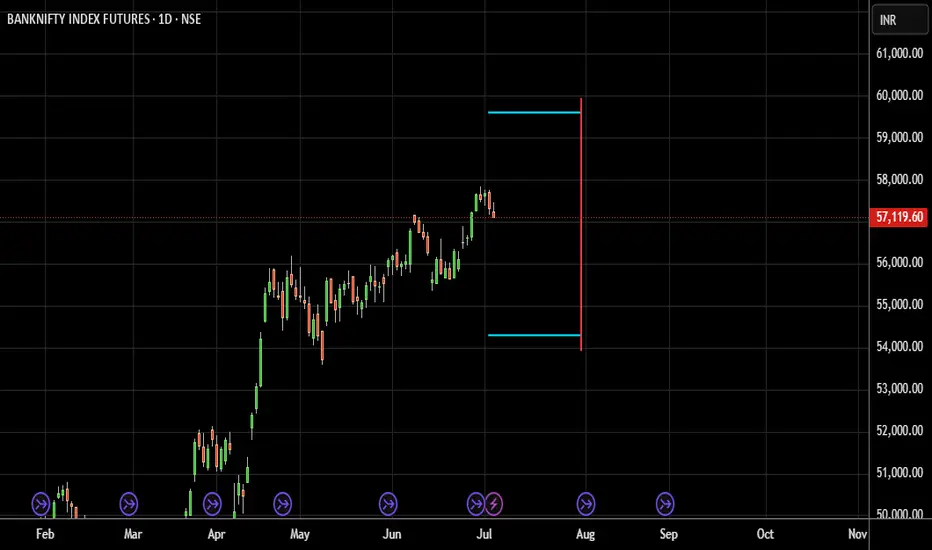
Banknifty 2025-2026 (Expected level)Banknifty. (Only for Experienced traders" )
Enter after " Breakout and Retracement ".
Leave a " Like If you agree ".✌.
Follow for regular updates 👍
.
For " long "
entry: 56000 / 56500
target: 60000- 62350
stoploss: 54800
Enter only if market Breaks
"Yellow box" mentioned.
.
.
For " Short"
entry: 54000
target:51000- 49500
stoploss: 54600
Enter only if market Breaks
"Yellow box" mentioned.
.
Wait for proper reversal and conformation.
.
Don't make complicated trade set-up.📈📉
Keep it " Simple, Focus on Consistency "💹.
Refer our old ideas for accuracy rate🧑💻.
Valuable comments are welcomed-✌️
.
.
Disclaimer:
Our Trading style is not to capture "10-20" points per trade.📊
We take entry only for min "200-300" points without any distractions.💹
So, our ideas may not be preferable for small traders, who just focusing on too much of support and resistance.📈📉📈
So, please consider others ideas.
This is for educational purposes.🧑💻

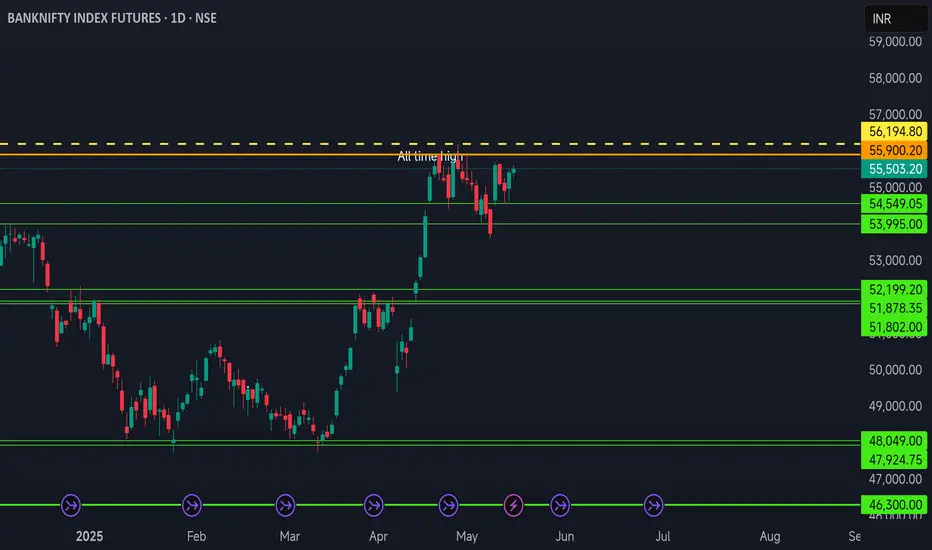
BankNifty Set for All-Time High in Late May 2025:Exercise CautioThe Bank Nifty index is poised for a potential all-time high (ATH) in the fourth week of May 2025, possibly surpassing its previous peak of 56,200. This bullish momentum is supported by recent technical indicators, such as a golden crossover (50-day EMA crossing above 200-day EMA) and a breakout from long trendlines, signaling strong upside potential. Positive sentiment is driven by factors like improved credit growth, falling bond yields, and robust quarterly earnings from major banks, with institutional buying (FIIs and DIIs) adding strength to the rally.
However, caution is warranted. The index is trading near overbought levels, with key indicators suggesting a possible temporary pullback or consolidation. A sharp decline, similar to the one seen in June 2024, is a risk, potentially driving the index toward 51,385, with support at 50,600. A gap around these levels may be filled, offering temporary support, but a break below could see the index test 48,049. There are warning of a potential 50% crash, citing historical patterns where ATHs preceded major corrections.
Key Levels to Watch:
Resistance: 55,939–56,300 (near ATH).
Support: 54,771, 50,600, 48,049.
Risk: Overbought conditions and historical crash patterns.
Traders should remain vigilant, using dips as buying opportunities but setting stop-losses to manage downside risks. Always consult professional advice before trading, as market movements are subject to high volatility
Bank nifty Futures 08.05.25Expecting a gap up to flat opening. May get a morning move on the upside. However overall, we have a bearish structure on higher TF. My strategy for the day will be to sell on rise. Incase I do not get a downward move will prefer to stay out of the markets.

Bank nifty Futures 06.06.25I am expecting gap down/ flat opening. The market structure is such that will be opting for sell on rise trades today. However, will be watching OF and MP carefully to observe any changes.I will watch the low volume tail on 28th April profile .

Banknifty futures 05.05.2025Expecting a gap down opening. however, if gap down does not happen if there is an opposite movement will prefer to wait and watch. Strong possibility of both side movement. Need to watch OF , Mp carefully before taking a trade...will prefer Sell on rise.

banknifty 30.04.25Expecting a gap down opening and maybe a downward movement. However, I will stick to Buy on Dips until and unless there is something I see on OF or MP. Will be carefully looking for any signs of absorption or trapping of sellers


Bank nifty Futures 28.04.25I would expect a gap down opening. however, incase not gap down I would still prefer to sell on rise. For this important locations/ absorption/ trap of buyers would be seen. In case I do not find things going as planed I will prefer to stay out. Bearishness is still predominant.

Bank Nifty Futures 25.04.25Expecting a gap down opening. My Strategy will be to sell on rise. Will be following MP and OF. Will be taking Trades at important areas / as per absorption of buyers.

Bank nifty Futures 24.04.25Expecting a flat to a gap up opening. More likely a neutral/ balanced day. Buyers are going to struggle but may defend. So, need to be careful and watch OF and MP. We may get movement on both sides.

Bank nifty Futures 23.04.25I am expecting a gap down opening an initial movement downwards. However, my strategy for today will be to buy on dips. Will be watching MP and OF for any developments. I will consider Important support areas and after additional confirmations take trades on buy on dips.

Bank nifty Futures 22.04.25Expecting a gap up opening. Will be following buy on dip. Will look for buying at important points and follow MP and OF. Expecting balanced day.

Bank nifty futures 21.04.2025Expecting a Normal/Neutral day. Gap up opening possible. I will be following buy on dips strategy at crucial and important points based on MP and OF. If I do not get buy on dips I will stay out of trading, until I see something worthwhile

Banknifty day chart formation Banknifty makes double bottom on day chalso the breakout done after neck line testing or respecting 20 Ema again banknifty gives good move in upside so bottom is @ 47900 & neckline is @ 50900 so almost 3000 pts upmove comes from breakout .....it's my view . Decision is your . Enjoy trading .
