Support levels for todayThree key levels to watch for support (buy entry) today are 24,720, 24,670, and 24,630. The market may take support at any of these levels and potentially move upward to break the previous day’s high.
Trade ideas

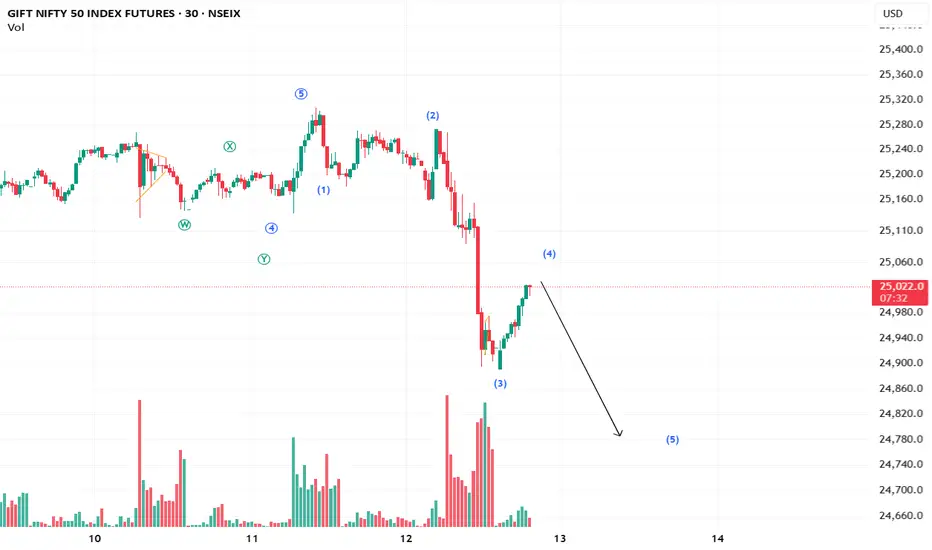
Another Sell on Rise in Making in NIFTY?GiftNifty is currently completing the Minuette Wave 4. We may see another move down on June 12th in NIFTY in the morning session. If not, we may see an A-B-C formation to the upside. Keeping the shorts ready?
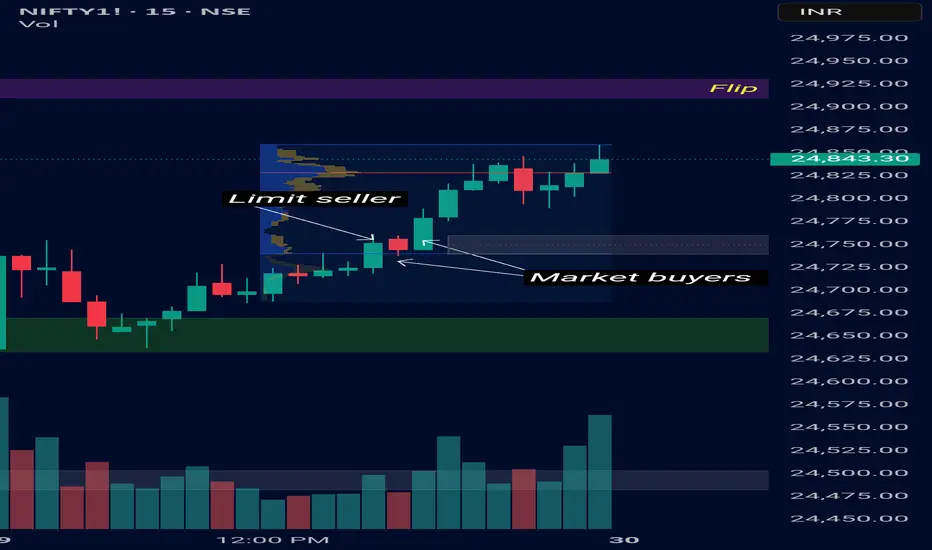
Nifty future strong Flip Zone Yesterday during the live session, I observed the 24,740 to 24,760 levels where limit sellers failed and aggressive market buyers took control. For me, this zone may now act as a strong support if the market pulls back.
Nifty for Tomorrow (30 June 2025)Its an assumption which has been marked in the chatt in form of levels. Hoping the index to rract properly around the marked level..

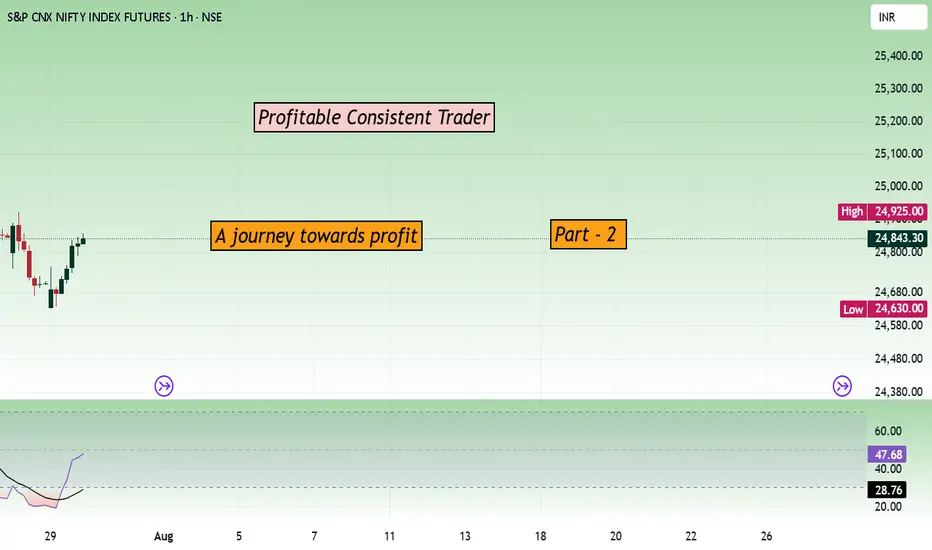
Profitable Consistent Trader... Part 2Markets are dynamic. You cannot predict how the market will behave in a certain way. Market movement is based on probability, and your trading reflects it. The price movement gives the information about the trend. From that, we form our perceptions/views about the market. Our perceptions are the basis for trading. Changing our perceptions can be a problem for some people.
For instance, "Person A" holds an optimistic outlook on the market prior to its opening. When the market opens higher and indicates a potential reversal, if "Person A" fails to adjust their perspective by recognizing these reversal signals, they will incur losses. On the other hand, frequently altering one's viewpoint is also detrimental. If you switch your opinion about the trend with every single candle pattern, you will lack a clear understanding of the market's direction.
Let’s address the crucial issue: how can we overcome it?
Focus on high-probability trade setups and effective trading strategies. Only execute trades when your predetermined setups materialize. This approach will provide you with clarity and confidence as you rely on proven trade setups and strategies.
Are you looking to shorten the duration of the intermediate phase?
Steer clear of making random trades. Always prepare a plan for how to respond to market changes. Once market opens, your emotions will come into play, making it challenging to process information, devise a trade plan, and decide on your actions.
Your success hinges on how you interpret the market through your trade setups and trading strategy.
Market structures continuously evolve based on the mindset and sentiment of the participants. A trader's approach to managing their trades shifts accordingly. For instance, If you are driving on a highway, you can drive fast. However, you are not allowed to drive fast inside the city. In the same way, your trading strategy, risk management, and trade management must adapt to the current market structure. Relying on a single strategy across all market conditions is unlikely to yield profits for a trader. Gaining an understanding of market structure comes with experience, but enhancing that understanding hinges on the trader's ability to adapt.
This can be explained through the tale of “rabbit & tortoise” The rabbit and the tortoise decided to compete in a race.
Race 1: During the race, the rabbit took a nap, allowing the tortoise to emerge victorious.
Moral of race 1: Continuous effort is essential for becoming a successful trader.
Race 2: This time, the rabbit stayed awake and secured the win.
Moral of race 2: No strategy is foolproof. Acknowledge that reality.
Race 3: Wanting to win, the tortoise altered its approach and challenged the rabbit to a race across the river. The rabbit ran along the riverbank, taking longer to cross, while the tortoise simply swam straight across and reached the other side first. The tortoise triumphed.
Moral of race 3: Choose your strategy according to the market conditions. Quickly adjust when there are changes in market dynamics. Race 4: The rabbit and the tortoise became companions. They agreed to alternate victories in their races. Moral of race 4: Long-lasting success or profit is achievable when there is little to no ego involved. In trading, when your stop loss is triggered, acknowledge it and exit the trade. Avoid engaging in revenge trading. To be successful, think differently from other traders. Profit is not reliant on flashy indicators or strategies; it hinges on how well you control your emotions during trading and how effectively you execute the trades.
Although the rabbit had good speed, it lost in race 1 due to incorrect execution, just like a good strategy or trade set up that is not executed properly can take away your profit.
(To be continued next week...)
Nifty 50 - 2 hr chart Date 29.07.2025
Nifty 50
Futures (2 hr chart)
Note* Caution, Nifty reaching oversold zone in confluence with neckline of broadening wedge

Price approaching key daily swing low 24750Nifty futures is approaching key daily swing low 24750.
24575 is an important breakout level which price has respected multiple times.
It is crucial to observe price reaction at these levels in the coming weeks.
Tip : How to Cultivate a Probabilistic Mindset
• Integrate the Five Fundamental Truths: Consciously and consistently adopt the following as core beliefs, as they align your expectations with market realities and neutralize emotional pain:
1. Anything can happen.
2. You don't need to know what is going to happen next in order to make money.
3. There is a random distribution between wins and losses for any given set of variables that define an edge.
4. An edge is nothing more than an indication of a higher probability of one thing happening over another.
5. Every moment in the market is unique.

Nifty May fall till 23300-500 Levels in near future
Apr 15th Price GAP (280 Points) was not mitigated till now...
Next Week we may see some green candles in Daily NIFTY chart(Short term Rally)

Profitable Consistent Trader...Part - 1As the market has opened and prices are moving, you are observing it. The question is whether you are living in the present, comprehending the market, or experiencing it in the past. The common assumption among people who enter trading is that it is easy to make money in the share market, but they fail to realize that consistency is necessary for success.
Newbies have low knowledge and high expectations, while senior newbies have more knowledge and have lower expectations. Intermediates often struggle to control their emotions while trading.
The intermediate phase is crucial in determining whether a person will become a consistent trader or not. The more time a person spends in this phase, the more likely they are to become a consistent trader.
Why? The individual will repeatedly correct their mistakes, forming a habit that reinforces the neural connections in the brain and establishes it as a regular behavior.
Individuals who engage in revenge trading, impulsive trading, and excessive trading for years fall into this category. Can you steer clear of it? No. Every trader experiences this stage. It is during this stage that they discover the path to becoming a consistent trader. Do you have harmful trading habits that sabotage your success? What elements influence the length of the intermediate phase?
Activity: Record your self-sabotaging trading behaviors. Analyze your trades to gain insight into them. (To be continued next week...)
Bears active - Key levels to watch 24850 etcNifty futures on the weekly has produced a bearish candle hinting at further downside. Key price levels have been discussed. 24850 is a key swing on the weekly chart.

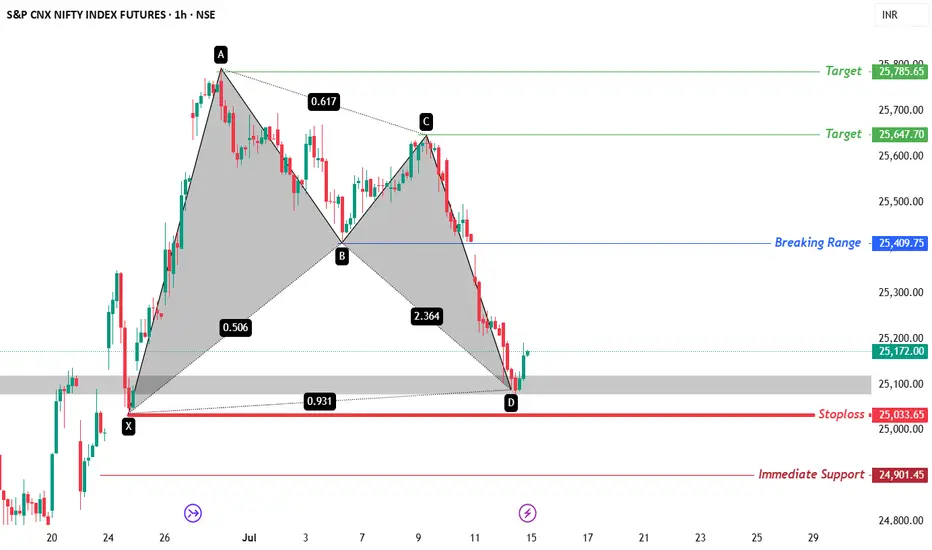
NIFTY FUTURES – Harmonic Reversal Setup (Bat)NIFTY FUTURES – Harmonic Reversal Setup (1H Chart)
Pattern: Potential Bullish Harmonic (likely Bat)
Entry Zone (D Leg Completed): 25,172 (Current Price Zone)
Stoploss: 25,033.65 (Candle Close Below D Point)
Immediate Support: 24,901.45
Targets:
• Target 1: 25,647.70
• Target 2: 25,785.65
➡️ Upside Potential: 2.43% only if 25,409.75 breakout happens
Key Insights:
• Harmonic pattern completed with XA–BC–CD legs; strong PRZ near D Point
• Reversal candle formed at demand zone with confluence support
• Watch for breakout above 25,409.75 to confirm bullish momentum
• 2.43% rally possible only after range break with volume
Risk Management:
• Trade only on bullish confirmation candle from support zone
• Exit if candle closes below 25,033.65 (D invalidation)
• Ideal R:R: 1:2 or better if breakout occurs
Disclaimer:
📌 This is not a buy/sell recommendation, just an educational trading idea.
📌 Market conditions can change; always conduct your own research.
📌 Understand risks before investing and take full responsibility for decisions.
📌 Stoploss candle close only, Target Trigger Price
Bullish start, Bearish Finish - Back to Breakout basePrice started off the week on a bullish tone and ended with bears dominating.
Key price psychology and levels have been discussed.
Tip : Train the mind to stay properly focused in the "now moment opportunity flow" for the mind and markets to be in sync - Mark Douglas Trading in the zone.

Market Outlook🔍 **Market Outlook – Ongoing Pattern Analysis & Strategy**
**Date:** July 9, 2025
**Index Focus:** Nifty
---
### 📊 **Market Behaviour Overview (Last 10 Days)**
Over the past 10 sessions, the market has shown a **repetitive intraday pattern**:
* **Opening:** Flat to slightly negative.
* **Mid-session:** Gradual decline throughout the day.
* **Last Hour:** Notable bounce-back in selected stocks.
* **Next Day:** Pattern repeats.
This indicates a **range-bound market with intraday volatility**, driven possibly by short-term traders and algorithmic activity, while broader trends remain intact.
---
### 🔐 **Current Strategy**
* **Index Trading:** **Avoid** index trades until this recurring intraday pattern breaks decisively.
* **Swing Positions:** Continue holding swing calls with a medium-term view.
* **Sentiment:** The broader trend is **not yet negative**. Stay patient and avoid panic selling.
---
### ⚠️ **Key Technical Levels – Nifty**
* **Resistance:** 25,644
* **Support:** 25,429
* **Stop Loss for Shorts (Sell SL):** 25,729
### 🔺 **Upside Breakout:**
If Nifty **sustains above 25,729**, expect a strong **upward breakout**, potentially leading to **new all-time highs**.
### 🔻 **Downside Breakdown:**
If Nifty **breaks below 25,429**, then we may see **continuation of the downside**, possibly retesting lower support zones.
---
### 📌 **Actionable Advice**
* **Stay Invested:** Trend is not bearish yet. Use dips for accumulation in quality stocks.
* **Monitor Key Levels:** 25,729 (breakout) and 25,429 (breakdown) are crucial.
* **Be Selective:** Focus on stocks showing relative strength during intraday dips.
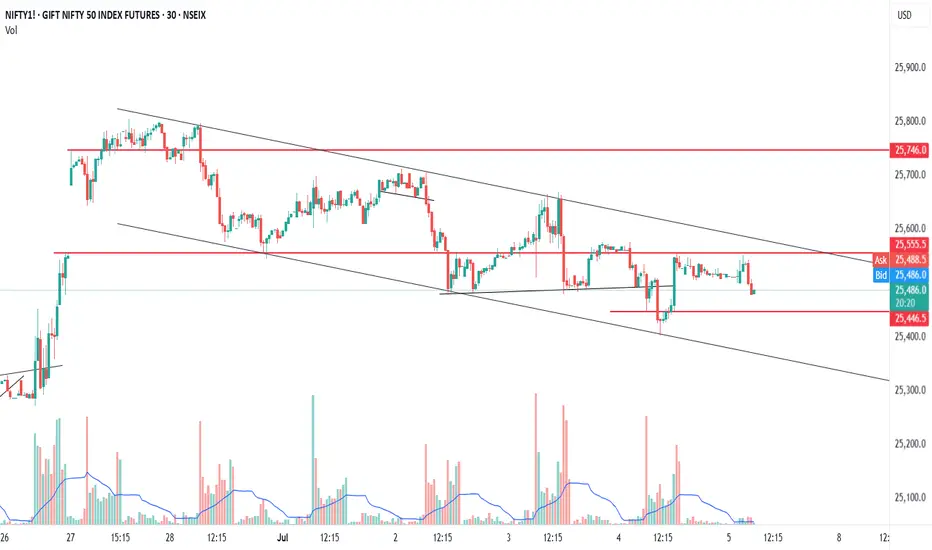
Gift Nifty in a nice channel pattern. Gift Nifty in a nice channel pattern. Expecting a breakout upside
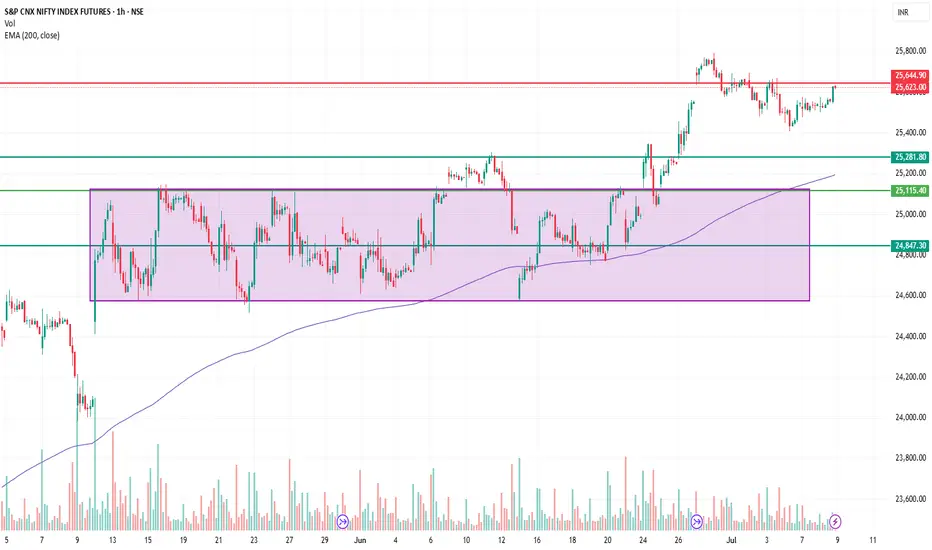
Weekly bias - Bulls in strong control of pricePrice has taken support from 25400 support zone and seems heading higher towards 26000 resistance.
Tip : Paragraph from Trading in the zone by Mark Douglas
The essence of what it means to be in "the zone" is that your mind and the market are in sync. As a result, you sense what the market is about to do as if there is no separation between yourself and the collective consciousness of everyone else participating in the market. The zone is a mental space where you are doing more than just reading the collective mind, you are also in complete harmony with it.
If this sounds a bit strange to you, ask yourself how it is that a flock of birds or a school of fish can change direction simultaneously. There must be a way in which they are linked to one another. If it is possible for people to become linked in the same way, then there will be times when information from those with whom we are linked can and will bleed through to our
consciousness. Traders who have experienced being tapped into the collective consciousness of the market can anticipate a change in direction just as a bird in the middle of a flock or a fish in the middle of a school will turn at the precise moment that all of the others turn.

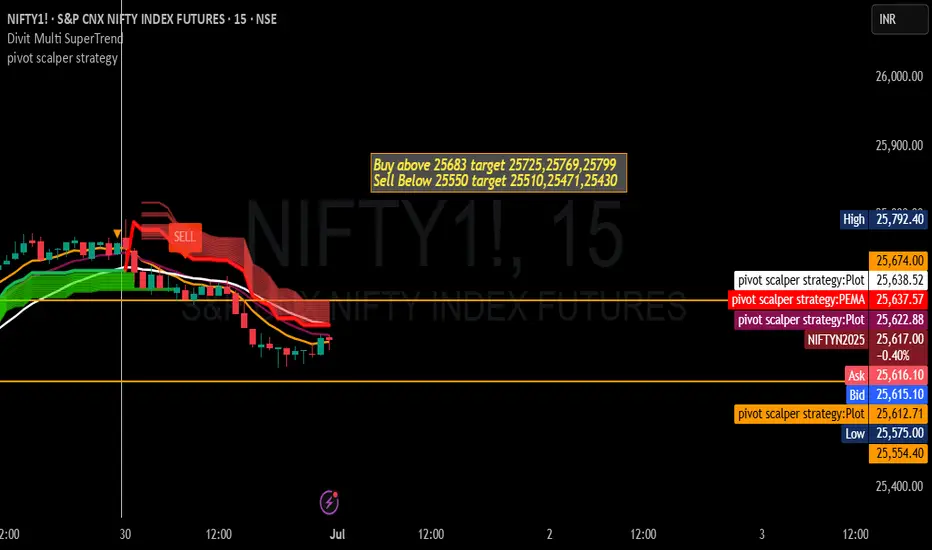
Nifty Futures Trading Strategy for 01st July 2025📊 NIFTY FUTURES – 15-Minute Candle Breakout Strategy
⏱ Timeframe: 15-Minute Candle
Stay alert around key breakout zones. Only act after candle close confirmation.
🟢 BUY Setup – Bullish Breakout
📍 Trigger:
Buy above the high of 15-minute candle with a confirmed close above ₹25,683
🎯 Targets:
✅ ₹25,725 – First Target
✅ ₹25,769 – Second Target
✅ ₹25,799 – Final Target
🛡️ Suggested Stop Loss: Below ₹25,683 (based on volatility or your risk profile)
📝 Tip: Ensure volume confirmation and momentum indicators (like RSI or MACD) are supportive before entry.
🔴 SELL Setup – Bearish Breakdown
📍 Trigger:
Sell below the low of 15-minute candle with a confirmed close below ₹25,550
🎯 Targets:
✅ ₹25,510 – First Target
✅ ₹25,471 – Second Target
✅ ₹25,430 – Final Target
🛡️ Suggested Stop Loss: Above ₹25,550 (adjust based on market movement)
📝 Tip: Avoid entering on false breakdowns – wait for volume and price confirmation.
⚠️ Trading Notes:
📌 Focus on confirmed candle closes, not just wicks or spikes.
🔍 Avoid trading during news events or low-volume sessions.
💼 Use proper risk-reward ratio (minimum 1:2) and position sizing.
📄 Disclaimer:
🚫 I am not SEBI registered. The above information is shared purely for educational and informational purposes only. Trading in the stock market and futures involves risk. Please consult your registered investment advisor before making any trading decisions. You are solely responsible for any outcomes.
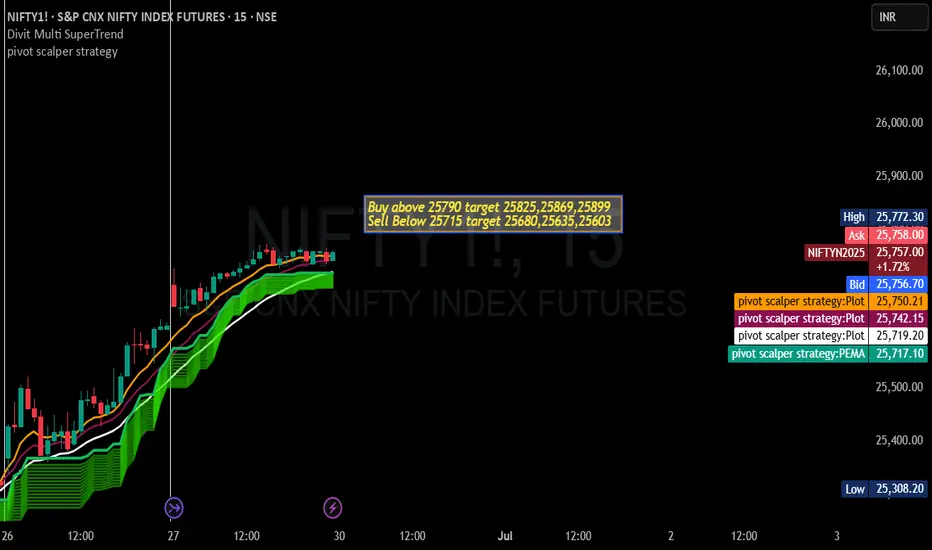
Nifty Futures Trading Strategy for 30th june 2025📊 NIFTY Futures – Intraday Trade Setup
🔹 Time Frame: 15-Minute Candle
🔹 Instrument: NIFTY Futures
🟢 Buy Setup – Bullish Breakout
✅ Entry Criteria:
🔼 Buy Above the High of a 15-min Candle & Close Above ₹25,790
🎯 Targets:
🎯 Target 1: ₹25,825
🎯 Target 2: ₹25,869
🎯 Target 3: ₹25,899
🛑 Stop-Loss: Below breakout candle low or as per your risk management.
🔴 Sell Setup – Bearish Breakdown
✅ Entry Criteria:
🔽 Sell Below the Low of a 15-min Candle & Close Below ₹25,715
🎯 Targets:
🎯 Target 1: ₹25,680
🎯 Target 2: ₹25,635
🎯 Target 3: ₹25,603
🛑 Stop-Loss: Above breakdown candle high or based on risk tolerance.
⚠️ Disclaimer
🚫 I am not a SEBI registered advisor. The above analysis is purely for educational and informational purposes only. Trading in the stock market involves risk. Please consult your financial advisor before taking any position. I am not liable for any profit or loss incurred based on this analysis.
Weekly bias - Price heading towards 26000 resistance zoneNifty futures has created a bullish weekly candle and price is heading towards all high time monthly closing levels of 26000. Key levels going forward is discussed.
Tip : The more clarity you have, the more power you gain.

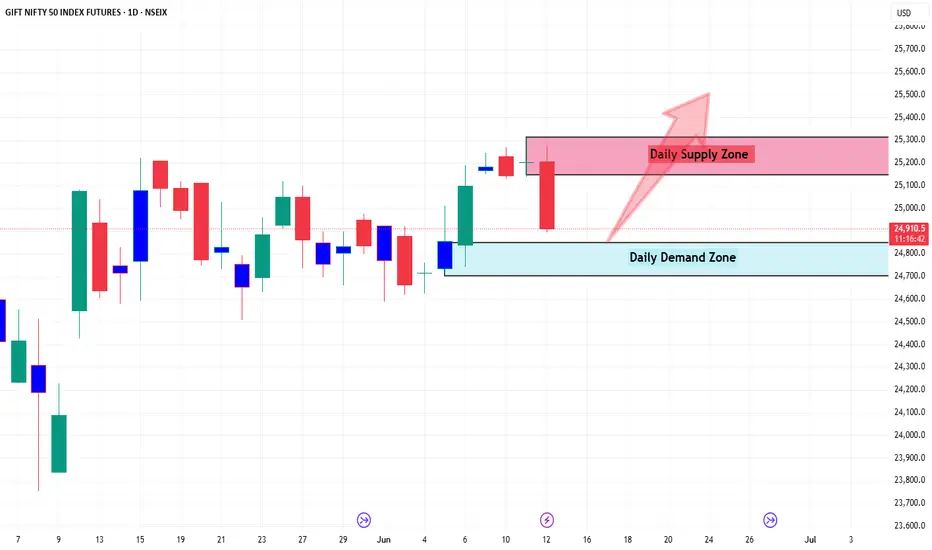
Nifty at Support - Time to BUYNifty Futures is at Support from 24848 where there is a Daily Demand
Expecting Price Pullback from that level to 25500+ in the coming week
Weekly bias - Bulls in control of priceNifty futures price gave a bullish candle for the week closed above 25000 futures level.
Now 25000 acts as support zone for the price and any dip towards it if held should be considered as a buying opportunity. The immediate trend is hinting that price may break out of the range towards the upside with short term targets being 25400 and beyond.
Tip : All see, few observe

Weeky bias - price back inside range still holding supportsNifty futures took resistance at 25300 zone last week and came back to support zone of 24500.
Last Friday price produced bullish candle at support post gap down opening. As of now, price is still range bound and looking to hold support. A break of PWL and support zones may hint at a negative closing for the week else it is positive.

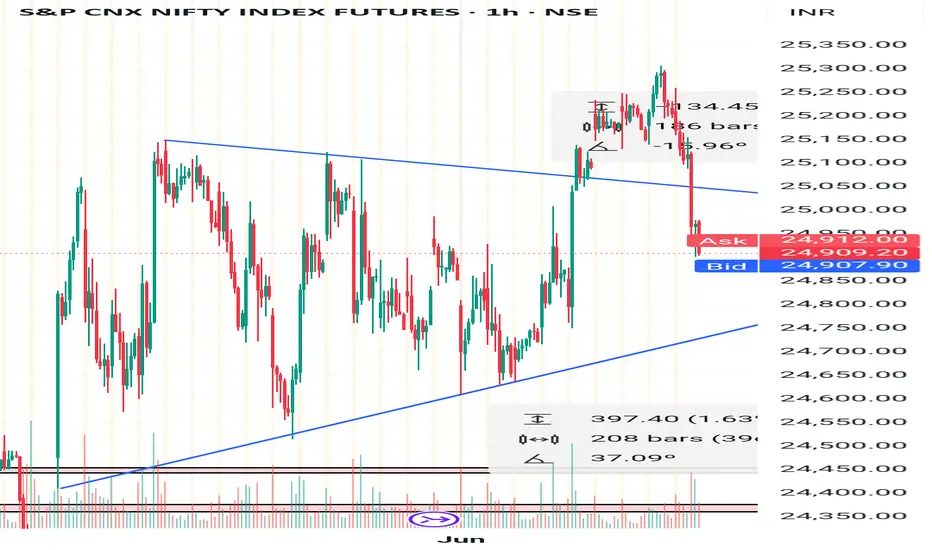
Nifty : symmetry triangle fake BONifty moving in a symmetric triangle
Broke out strong on RBI interest rate decision day
Breakout faded as bulls failed to move price higher
Consecutive last 3 trading days closing<openings
During closing hours big boys moved the price downside and closed below key round level 25000 and trendline of the triangle.
Possible target are marked in chart
Play bear put spread with 1:4 RR.
Happy trading.
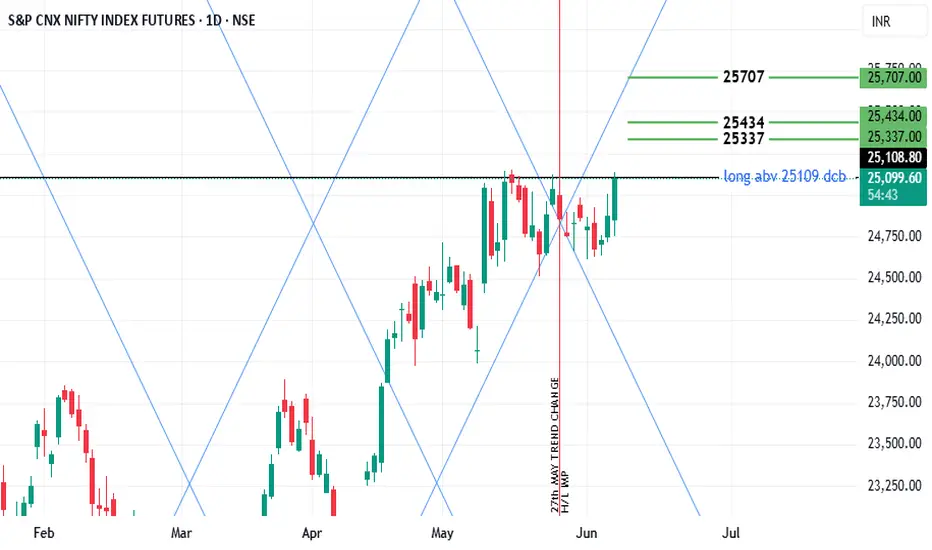
NF TRGS 25337/43427th May Imp Time cycle date . High / Low imp.
Trgs on Chart. Bias strongly up .
Trade as per levels. Exit if price closes below previous day low , until then ride the trend .
look of for updates.