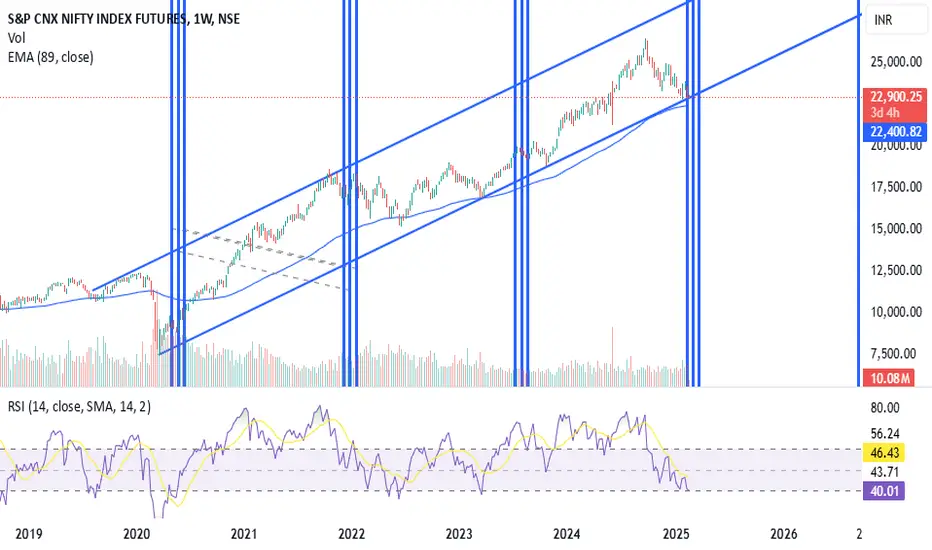
nifty tgt 350002003-2008 Rally as per Elliot Wave Theory was in 3 Waves - Wave A, B and C with all tops and bottoms on a single trend line, Same happened in 2009-2020, now in current Bull run from 2020 till date we have already seen 2 sharp rallies, 8000-18000 wave A, then 17000 to 26300 ie Wave B, both waves followed by sharp corrections;
Soon we will start final and most fierce leg C for 18-20 months ending at 34000—37000 in late 2026 —- after that will be real bear correction of over 30%!
In mid or end of Fy27 we will find Fy26A EPS as 1205-1250 and Fy27E as 1400-1500; at 25-27 PE fy27EPS the value of Nifty will reach 34000-37000 and thereafter there will be a huge fall till 24000;
I had accurately predicted in 2023 Diwali for Diwali 2024 tgt as 26700 (actual was 26300)
I had in April 2020 said that correction will be over in 3-6 months only;
Now at 23000 I think if we haven’t made bottom already may be at max another 1-2% on Nifty correction but from 22700-800 we will go to 34000-37000 in next 15-24 months and then crash back again to 24000!
Trade ideas

Nifty would be close to a short-term bottom.As seen on weekly charts of nifty it has entered a time-cycle zone and multiple supports are in this zone. A trend-line on weekly chart, Weekly moving average, monthly mid of bollinger band or 20 SMA and a bullish time-cycle zone all these supports are in the range of 22200-22800.
A close above a previous day high will show 1st signs of reversal and close above weekly high will confirm the reversal.
Investing partially will be recommended at current levels.
Nifty Future for 17 Feb 2025,For 17 Feb 2025, I spotted a seller level at 23080. Another level of 23000, I feel a balanced but decisive zone. So to summarise,
Above 23080, I will prefer a long
At 23080, I will sell
Near 23000, I will wait for price to stay sometime then above buy and below sell.
23000 being a round figure, highly decisive zone so don't jump too quickly into trade as buyers and sellers will fight in this zone.
(I am NOT sebi registered advisor so it's strictly for paper trade, don't use real money.)

Gift nifty trend reversal started start buy on dip in niftyHow to take trades using Harmonic pattern projection Trade setup is explained below :-
To take fresh trade in Buy/ Sell side we have to check if Price if Above / below 23.6 mentioned as D(23.6%)
Then we can take fresh buy or sell trade with SL or recent high/ low mentioned as point D( 0 %).
Targets :
T1: 35 % to 38.2 % level is our 1st Target
( This is reversal zone so if price taking support and not break zone then book profit. If breaking then hold trade with SL just above or below cost)
T2: 50% level is our 2nd Target
T3: 61.8% to 65 % is our 3rd Target
( This is also reversal zone so we have to book profit at this area and if break then take fresh entry with SL of 2nd Target 50% .)
Next Targets are 78.6 % , 88.9 % 100% , 113.5 % , 127.2% , 138.2% ,150% and 161.8% to 165%.
161.8 to 165% if profit booking area so book full profit and wait for reversal.
How to take reversal trade :
If price going upside/ downside then then buy or sell levels appear on Chart ( Automatically show when price reach any reversal zone of harmonic projection parlttern based .
After showing reversal levels wait for confirmation until 23 .6 % level not break if break then exit from current buy / sell trade and take fresh reverse trade buy/ sell .
Trailing SL:
After reach 1st Target trail SL to just above or below cost ( for example we are holding sell trade from 100 1st Target 110 hit then move trailing sl to 104-105 and move SL as price move upside or Downside)

Nifty Future - Key levels To Look For Date : 14.02.2025
Nifty Future
Timeframe : Day chart
Remarks :
1 22849 - 50% of internal wave 5 (extension) - support/resistance
2 22608 - 61.8% of internal wave (extension) - upcoming support
3 22473 - 78.6% of corrective wave C- next support
4 22265 - 78.6% of internal corrective wave - follow up support
5 21829 - 100% of internal wave 5 - follow up support
6 21810 - 100% of corrective wave C (extension) - follow up support
7 AB=CD - Harmonics - 21800 - Strong bottoming out
8 21800 to 21829 is strong area of sharp bounce/pull back up to 50% from starting wave A
Regards,
Ankur


Nifty Fut for 12 Feb 2025Today I spotted 2 zonal levels for sellers in nifty future, namely 23366 & 23299. For buyers, I feel comfortable level is 23098. I will keep above levels for trading on 12 Feb 2025, So to summarise, above 23366 buyer's (still sellers may strike anytime), 23366 to 23299 fight of buyers and sellers (watch OFA very closely on very small TF, below 23299 Sellers zone, at and above 23098 buyers zone, below 23098, sellers but cautious as buyers may strike anytime. #pt

Gift nifty trend reversal started,buy tomorrow buy on dipHow to take trades using Harmonic pattern projection Trade setup is explained below :-
1st D point : 0% is recent top or bottom.
Trailing SL: 17.5% is work as trailing SL of buy or sell trade if hit then we have to book profit
.If price goes below 17.5% then early or risky traders can reversal trade ,
Targets :
Target T1 : 28.3%
Target T1 : 37.8 %
Target T3 : 48.1%
T3: 60.2% to 66.9 % is our 3rd Target since this is reversal zone so must book profit if break then take fresh trade again
Next Targets are 77.5 % , 89.6 % 100% , 113.5 % , 127.3% , 141.2% and 160.2 , 177.5. final Target 200%
160.2 to 177.5% if profit booking area so book full profit and wait for reversal.
How to take reversal trade :
If price going upside/ downside then then buy or sell levels appear on Chart ( Automatically show when price reach any reversal zone of harmonic projection pattern based .
After showing reversal levels wait for confirmation until 17.5 % or 28.3 % level not break if break then exit from current buy / sell trade and take fresh reverse trade buy/ sell .
Trailing SL:
After reach 1st Target trail SL to just above or below cost ( for example we are holding sell trade from 100 1st Target 110 hit then move trailing sl to 104-105 and move SL as price move upside or Downside)
Blue Line is 1st support/ Resistance
Green line is 2nd support/ resistance
Red line is 3rd Support/ resistance

Nifty Future 11 Feb 2025, Decisive Level 23540For date, 11 Feb 2025 , Sellers have a dedicated level of 23540 , which prove to be decisive for 11th feb. I will definately keep this in mind before entering a trade and above area is for bulls and below area is for bears (I believe).
Disclaimer: Don't trade with real money, and if things work out, it's probably just luck. I don't have any formal expertise of this topic and am currently learning by studying errors. I myself doing paper trading only

Todays trade setup in nifty.once price reaches demand zone and faces rejection, We will initiate buy side trade with sl below the zone and target Swing Zone Supply .

Todays Nifty's trade.Today nifty did not take rejection from demand zone . broke demand zone with big volume red candle .
and price did not reach the target zone . still trading below the zone . expecting tomorrow to continue down trend .

G-Nifty 06-02-2025 weekly expiry Market expected to remain range bound between 100 to 150 points with major components turning flat. OTM writing on either side will be beneficial… With safety margins…

Nifty Future chart suggest we are about see time wise correctionNifty future chart, most probably price is going to stay in the range for up coming months. That what I think about it. We can 1600-2000 point range for up coming months. Lets sell the range and hope for the best

Gift Nity Three major resistance at one place 23900 and 23950.
Major trendline and Falling wedge resistance and Supply zone at peak level of H4.
If rejection comes short term target will be 23100
This is just possibilities not financial advice

Nifty Futures Date 03.02.2025
Nifty Futures
Timeframe : Weekly
Subject : The Most Critical Trendline Ever Since 2020
Remarks ;
1 This is "the most" critical trendline ever in the recent past since Covid lows.
2 Market has re-tested the same thrice in the last 4 years & came close to it twice.
3 Last week's low was exactly spot on same trendline i am taking about.
4 Therefore, "22809" becomes the most important weekly closing of recent past.
5 Any weekly closing below 22809 is strictly exit from all long position especially "index".
6 Don't set any target below 22809 & do not try to find any support areas immediately.
Regards,
Ankur

NIFTY 50 - 01-02-2025 BUDGET DAY REVIEW Market ended flat post budget. But we need to focus on what will be next from here. nifty futures hovering at 23500 downward side which is a kind of negative signals for the days to come where market can correct upto our initial support levels of 21800 till March 16th 2025. So more focus should be on WRITING OTM CALLS where ever you fell the volatility is high and market is touching resistance.
The idea behind the same is to capture the max of the volatility & LOGIC is if the market faces resistance more than thrice in a week the volumes on the same side come single sided and make the market downward trending till the premium get bloated.
Be ready for the CAT and monkey game for 1 month at-least. It will keep everyone nerves high.
Regards
Ajay Ekka

Big Moves R ComingNifty big moves are coming.
Trading short term trend will be profitable.
23000 is trigger/stop for the move.

Todays Nifty setup Todays setup in nifty . Sell from supply rejection . Buy from demand rejection. Target next zone . Sl above or below the zone.
Wait for the price to reach a key zone and take trade accordingly. On rejection break out or break down

Sell nifty from supply zone I will sell nifty, if nifty faces consolidation or rejection at supply zone with a sl above the zone, targeting demand zone. small sl and big target .

MAHA KUMB pattern.. a modified patterngeometric pattern and break out .multi triangle pattern breakout and targets

Nifty FUT Next move in possible SL 1Hr candle close only, Target Trigger Price
All detail for chat. good entry at mark price only. and must stoploss minimum risk and good profit. risk ratio 1:1 to manage modified SL. This is not call, Just my idea. Please understand your risk and take full responsibility of your actions

Todays trade plan in nifty .Long above demand zone when price faces rejection , and short below demand Zone . sl will be 30 points and target will be 150 points .

Nifty Futures Date 23.01.2025
Nifty Futures (3 hr chart)
Yesterday bounced exactly from Wave C 61%.
Formation of broadening wedge is extreme volatile patter & in case of breakdown of Wave C 61% + broadening wedge would lead to another 5%-10% cuts in index
Regards,
Ankur
