GIFT NIFTY (SANTA RALLY)
Triangles are fascinating chart patterns in technical analysis. There are three main types: ascending, descending, and symmetrical. Each indicates different market conditions and potential price movements. Here's a quick overview:
Ascending Triangle: This bullish pattern features a horizontal resistance line and an ascending support line. It suggests that buyers are gaining strength and a breakout to the upside is likely.
Descending Triangle: This bearish pattern has a horizontal support line and a descending resistance line, indicating that sellers are gaining control and a breakdown to the downside is probable.
Symmetrical Triangle: This neutral pattern consists of converging trendlines, with neither buyers nor sellers having a clear advantage. The breakout can occur in either direction, and the subsequent move is often significant.
Trade ideas

PRE MARKET ANALYSIS OF NIFTY FOR 24 DEC 202424 Dec 2024
WORLD MARKETS
1. World Markets are bearish.
INDIA VIX AND GIFT NIFTY
1. India VIX is down 10% Indicating reduction in volatiltiy . This due to Gap up today.
2. GIFT Nifty is indicating 84 points down tick at 23680 levels.
INDEX HEAVY WEIGHTS
1. HDFC Bank has made a bullish candle. Any breakout above 1805 is bullish. However any break below 1795 will be bearish.
2. ICICI Bank is neutral. Move above 1306 is bullish and move below 1285 is bearish.
3. Reliance is bearsih. It is sell on rally.
TRADING PLAN.
1. NIFTY OPEN BETWEEN 23835 - 23705 : No Trade.
2. NIFTY OPEN ABOVE 23835 : Wait for a consolidation and break above 23900.
3. NIFTY OPEN BELOW 23705 : Wait for a consolidation and break below 23630.
DISCLAIMER
1. I AM NOT A SEBI REGISTERED TRADER. THIS INFORMATION IS FOR EDUCATIONAL PURPOSES ONLY. PLEASE CONSULT YOUR REGSITERED FINANCIAL ANALYST FOR ANY TRADE RELATED QUERY. THE AUTHOR OF THIS ARTICLE HOLDS NO LIABILITY FOR ANY TRADE TAKEN BY THE READER.

NIFTY 50Nifty 50 currently at the resistance level of 23790-23825
If break & sustained above, move till 24020 possible
If any negative formation made at these level, look for a short opportunity till previous day low
Levels are given as the futures

Nifty Tomorrow trendTomorrow nifty cap down opening you can buy 23050 call option..
Cap up opening 24000 but buy
23050 biggest support
Nifty never break this point.
Trent may be return positive
Monthly nifty break 23050 level may be nifty fall long period

PCR in Trading However, no PCR can be considered ideal, but usually, a PCR below 0.7 is typically viewed as a strong bullish sentiment while a PCR more than 1 is usually considered as a strong bearish sentiment.
A high PCR indicates a bearish sentiment, as more traders buy puts, expecting the market to decline. Similarly, a low PCR suggests a bullish sentiment, with more traders buying calls in anticipation of a market rise.
PCR > 1: When the PCR is greater than 1, it suggests that there are more open put contracts than call contracts, indicating a bearish sentiment. Traders and investors anticipate the underlying asset's price to fall. PCR = 1: When the PCR is close to 1, it implies a balanced sentiment in the market.

How to draw support & resistance To identify support or resistance, you have to look back at the chart to find a significant pause in a price decline or rise. Then look forward to see whether a price halts or reverses as it approaches that level.
he Fibonacci indicator consists of Fibonacci retracement levels, which are 23.6%, 38.2%, 50%, 61.8% and 78.6% which are drawn between two price levels and can be used to indicate support and resistance in the market.

Gift nifty accuracy of weekly / Swing Zones .Our trading style emphasizes patience and precision. We only trade when the price reaches a key zone, observing for consolidation, reversal, or breakout/breakdown signals. Once these conditions are met, we take trades in the direction of the price. We avoid trading at random prices, prioritizing high-quality setups. With this approach, we aim to place small stop losses and target larger gains, focusing on fewer but more accurate trades.

Nifty cautious approach for coming months.Hi,
Please do check out the chart analysis on Nifty for the coming week starting 23rd Dec 2024.
Thanks.

Nifty Index Futures: Key Technical Insights for December 2024The Nifty Index Futures chart highlights significant market developments, signaling potential shifts in momentum. Here’s a concise analysis:
Key Highlights
Trendline Breakdown:
The long-standing upward channel has been breached, indicating bearish pressure.
Bearish Patterns:
A confirmed head-and-shoulders pattern with a neckline breakdown suggests further downside.
Emerging lower highs and lower lows confirm a bearish trend structure.
Critical Levels:
Resistance: 24,400 and 25,000.
Support: 23,625, 23,222, and 21,827.
Scenarios:
Bullish: A recovery above 24,400 could target 25,000.
Bearish: Sustained trading below 23,625 may lead to 23,222 or lower.
Trade Plan:
Short Trade: Consider shorting below 23,625 with a stop-loss at 24,000 and targets at 23,222 and 21,827.

Nifty 38k by 2030?Gift Nifty while not looking good in short term is still poised to touch 38000 levels by 2030. Keep adding on all dips.

Nifty FutureThis Market has been a Delight for those who understand what the hell is happening. I hear though..... that ALGO users have had their Pants taken off with the volatility. I will TRY and update everyday going forward time permitting. ( My internet went BLANK at 11.30 am and I couldn't update thereafter.) You all have to understand something very simply. I take NO RESPONSIBILITY for any Trades taken and OR any Profits/Losses incurred. What I do whole heartedly take Responsibility for is this. I will to the Best of My Ability without any Remuneration or Obligation from any of You, I will help at all given times. (BTW... my last comment... 24040 NF go short..... it never climbed back . All the Best and God Bless Always

Nifty - Weekly Head and Shoulder viewAnalysis
Nifty futures as of now has completed the weekly Head and Shoulder Pattern. A weekly close below 23900 will confirm this
A downside target of 11% can be projected, with coincides with the election panic low of 21265
This view will be invalidated if Nifty closes above 25000
Trade Plan
Stick to swing trades if going long, it's ok to book profit early - we are not in a trending market anymore.
Try to short on confirmation, save a big chunk of your capital to go long at 21800 levels
Good luck, Happy trading!

NIfty Weekly Bull Run Resumes after Flag Hello Everyone,
Nifty Weekly Creating FLAG pattern along with channel trendline support and EMA 50 as support also a RSI oversold conditions. as compare to previous flag if this going to happened then NIFTY 31000 possible till start of 2026 . buy on dips is the strategy for investors.
hope you liked then hit like this will help me to post more technical analysis and ideas.

Nifty FutureAgain this is a 1 tf chart to show you guys the BOTTOM...... but have to post it under a 15 tf coz TV wont allow me to do so. This to me is the bottom for now before A PULLBACK. WILL EXPLAIN LATER THE PULLBACK And the retracements. All the Best

Nifty Futures 18-12-2024 Nifty futures seems to be in a support reversal zone. So indices can go volatile today. Suggestions don’t enter volatility wait for cool down timeframes to avoid unwanted stop loss.
Expected course will be 24133 touch and back in 2-3 15 min candles as per historical figures.

Nifty Intraday Levels | 16-DEC-2024Nifty Options Scalping
1️⃣ Zones to Watch:
👉Green Zone: Institutional support
👉Red Zone: Institutional resistance
👉Gap: 100-200 points between zones
👉Zone Creation: Based on pivot points and Fibonacci
👉Chart: Use Nifty futures chart for reference
2️⃣ Trade Execution:
👉Order Flow: Triggers trades
👉Timeframes: 1-min & 5-min for scalping
👉Risk-Reward: 1:2 (Risk 1 to gain 2)
👉Strike Price: ATM or slightly ITM options
👉Position Sizing: Adjust to risk tolerance
3️⃣ Rules:
👉9:15 AM Sharp: Ready for market open
👉Risk Management: Top priority
👉Quick Trades: "Morning breakfast" scalps
👉Stop-Loss: 10 points
#ThankU For Checking Out Our IDEA , We Hope U Liked IT 📌
🙏 FOLLOW for more content!
👍 LIKE if you found it useful!
✍️ COMMENT below with your thoughts and feedback

The GREENS Vs The REDThere are two most important and fundamental questions that every trader should ask to himself and should not put his hard-earned money in the market before answering them.
>> The first one is why more than 95-98% traders lose money in the market?
>> And the second one is How those 2-5% traders are still able to make money in the market?
🤔 Is it about fundamental or technical analysis that fill this gap here or is it something else that is ignored on part of the losing traders?
Well one can be a good analyst who mastered those arts in months or over years but may still lose 🎃 when it comes to real trading.
Social media has made it too easy to learn analysis but trading still keeps its difficult spot in the real world.
The space 📏 between the winners and the losers is surely more about discipline and consistency.
Losers generally lose because of fear or greed.
Fear 😣 could be of missing the trade, so entering too early or could be of losing a winning trade and always exiting with minor profit. Both scenarios lead to damage when trade goes against the expected direction.
Greed 🤑 may result into keep on holding a losing trade in hope or not booking good profit in the hope of more and then booking loss. Greed may also lead to unacceptably higher position sizes or over-trading. One should not forget that greed in a good cause is still greed and can damage capital in trading.
Both greed and fear lead to lousy decision making and hence loss in almost all cases.
Winning approach is more about discipline. It is to know one's reasons for trading. These reasons could be their tested setups- No setup, no trade.
Its also about knowing when to stop 🤚. Stop when a defined loss in a trade reaches or stop when specific number of trades are lost.
Winners 🥇 understand that there is no perfect exit when in profit. Either exit at a target or at least with some profit. Protecting capital, without overtrading, could boosts confidence in future trades.
Hence the task of winning more can be achieved by losing less with the above-mentioned approach. One can also lose less by keeping (acceptably) wider stop and hence limiting the number of trades by by-passing volatility.
I hope this would make sense for some traders.
Do boost 🚀 comment below to get educational ideas more frequently.
Regards.

Perfect example of SL hunt and trapToday's price action is a textbook example of how the big players hunt and trap the retailers. Price goes below previous supports with big bearish candles and reverses sharply to go higher.
I forgot the name, a very famous trader once told that one of the secrets behind trading success is to put your buy order where most people put their stops!

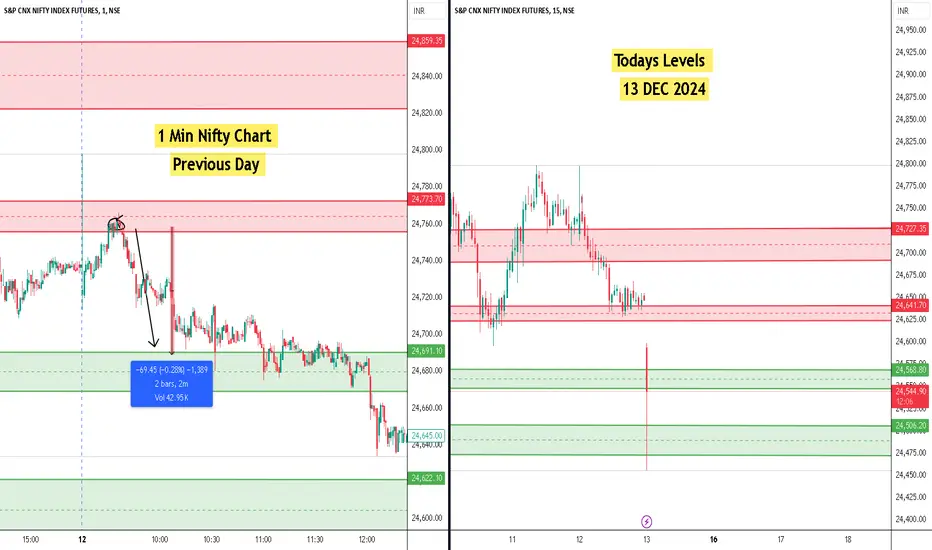
Nifty Intraday Levels | 13-DEC-2024Nifty Options Scalping
1️⃣ Zones to Watch:
👉Green Zone: Institutional support
👉Red Zone: Institutional resistance
👉Gap: 100-200 points between zones
👉Zone Creation: Based on pivot points and Fibonacci
👉Chart: Use Nifty futures chart for reference
2️⃣ Trade Execution:
👉Order Flow: Triggers trades
👉Timeframes: 1-min & 5-min for scalping
👉Risk-Reward: 1:2 (Risk 1 to gain 2)
👉Strike Price: ATM or slightly ITM options
👉Position Sizing: Adjust to risk tolerance
3️⃣ Rules:
👉9:15 AM Sharp: Ready for market open
👉Risk Management: Top priority
👉Quick Trades: "Morning breakfast" scalps
👉Stop-Loss: 10 points
#ThankU For Checking Out Our IDEA , We Hope U Liked IT 📌
🙏 FOLLOW for more content!
👍 LIKE if you found it useful!
✍️ COMMENT below with your thoughts and feedback
View on NiftyNifty50 is forming CPI(Change in Polarity) chart Pattern. Which Indicated a long view in nifty. Buy position can be formed with proper risk management with swing low as stoploss.

Nifty Long Trade Buy@24500 Exit @23790At current level log trade can be initiated. Nifty has formed a higher bottom structure. Swing low can be stoploss for the long possition.

nifty at demand zone.nifty at demand zone , if faces rejection and sustains we can see an upmove till supply zone .
wait for proper rejection and candle closing. sl below the demand zone .
Zone to Zone trading .

waiting for a break outnifty is in a tight range with less demand , news based writing and rotation happening. a quick up move upto 25200 expected in the coming days
