"D" Day !!!!!
**📊 NIFTY FUTURES - 3-Day Composite Profile Analysis**
**Current Setup:**
- Classic D-shaped composite profile showing strong initiative buying over last 3 days
- Price currently balanced at Value Area High (~26,003)
- POC: 25,955 | VAH: 26,003 | VAL: 25,880
**Potential Scenario - Fake Breakdown
Related futures

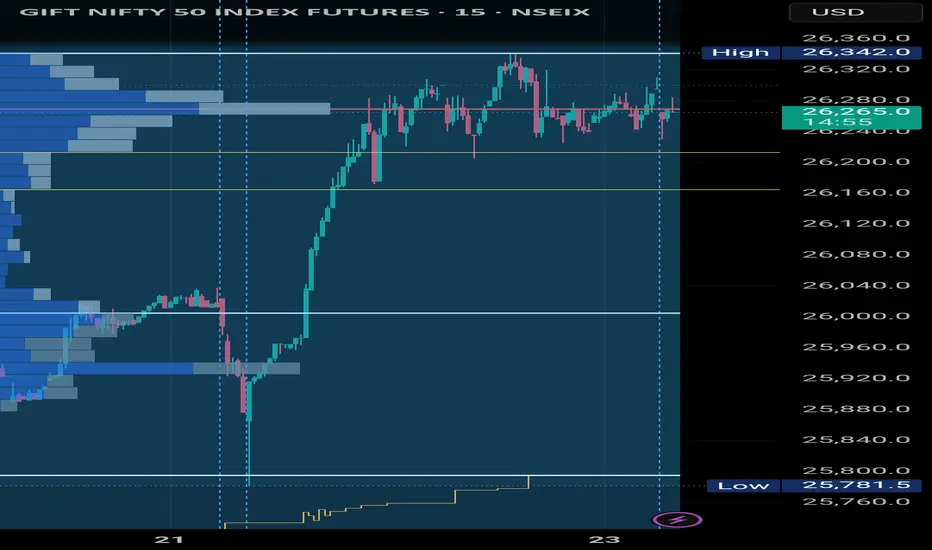
Trade deal on Monday ????# NIFTY FUTURES - Clean Breakout & Successful Retest 🎯
## Key Observations:
**Price Action:**
- Strong breakout from the consolidation range (marked in blue)
- Successfully retested the breakout level around 26,000
- Currently trading at 26,170.50, holding well above the breakout zone
**Technical

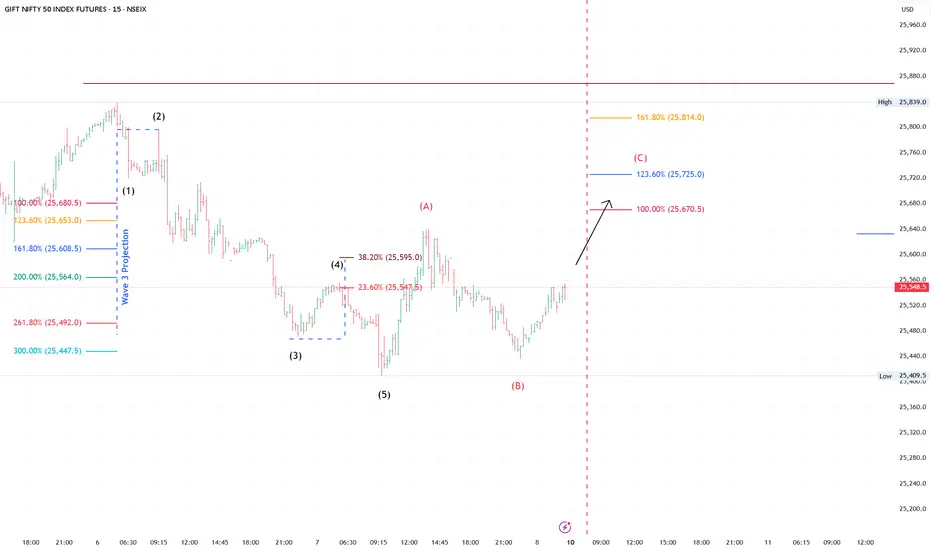
SGX Nifty – Elliott Wave Breakdown & Short Setup (15-Min Chart)SGX Nifty is on its way to complete Wave C correction around 100% - 123% range at level of 25,670 to 25,725.
Thereafter SGX Nifty may turn to Sideways to Bearish...
Plan accordingly.
Part 10 Trade Like InstitutionsOption Buying vs. Option Selling
Option Buyers have limited risk (premium paid) and unlimited potential profit. However, time decay works against them as Theta reduces the option’s value daily.
Option Sellers (Writers) have limited profit (premium received) but potentially unlimited risk. Sellers

Expiry Day Trading - Most tempting day to trade or gamble...Expiry day has its own characteristics. It gives so many emotions in the mind. Hope is the main emotion when traders think about it. If I can predict the movement right, I can make more than my month's salary on an expiry day of trading is the average/ordinary or even sharp-minded trader will think.

PCR Trading Strategies Types of Options Based on Market Style
Options can be classified based on the exercise style:
American Options: Can be exercised any time before or on the expiry date. (Common in the U.S. stock market.)
European Options: Can only be exercised on the expiry date. (Used in Indian markets for index

Nifty Futures trading strategy 27th October 2025📊 NIFTY FUTURE TRADE SETUP (INTRADAY) ⚡
📈 BUY SETUP:
➡️ Buy Above: The high of the 15-min candle that closes above 25,965
🎯 Targets:
🥇 26,000
🥈 26,035
🥉 26,075
🛑 Stop Loss: Below the same candle’s low
📉 SELL SETUP:
➡️ Sell Below: The low of the 15-min candle that closes below 25,698
🎯 Targets:

Part 2 Ride The Big MovesWhat Are Options? The Basics
Options are derivative instruments, meaning their price depends on something else — the underlying asset. Each option contract has four key components:
Underlying Asset: The stock or index the option is based on.
Strike Price: The agreed-upon price at which the asset

Gift nifty 25214 buy 25165 buy buy buyVolume chart analysis trump triff 50% to minus 35% only 15% only call buy not put
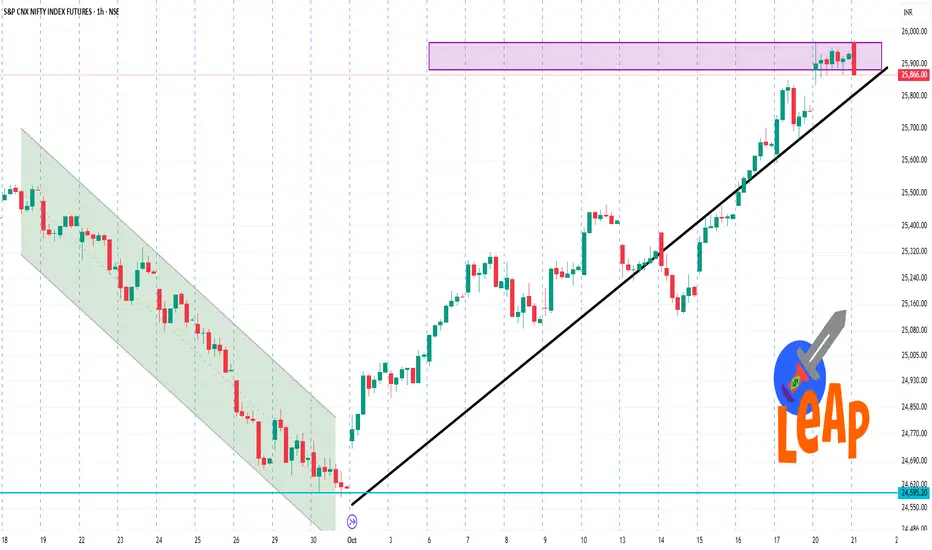
NIFTY1! 1 Hour Time Frame 🔄 Key Levels to Watch
Support Levels: Approximately ₹25,600. A bounce from this area could indicate a potential upward movement.
Resistance Levels: Around ₹25,900. A breakout above this level may signal a continuation of the upward trend.
📌 Pivot Points for Reference
Based on daily and weekly pi
See all ideas
Summarizing what the indicators are suggesting.
Neutral
SellBuy
Strong sellStrong buy
Strong sellSellNeutralBuyStrong buy
Neutral
SellBuy
Strong sellStrong buy
Strong sellSellNeutralBuyStrong buy
Neutral
SellBuy
Strong sellStrong buy
Strong sellSellNeutralBuyStrong buy
A representation of what an asset is worth today and what the market thinks it will be worth in the future.
Displays a symbol's price movements over previous years to identify recurring trends.
Frequently Asked Questions
The current price of GIFT NIFTY 50 INDEX FUTURES is 25,884.0 USD — it has fallen −0.08% in the past 24 hours. Watch GIFT NIFTY 50 INDEX FUTURES price in more detail on the chart.
The volume of GIFT NIFTY 50 INDEX FUTURES is 37.26 K. Track more important stats on the GIFT NIFTY 50 INDEX FUTURES chart.
Open interest is the number of contracts held by traders in active positions — they're not closed or expired. For GIFT NIFTY 50 INDEX FUTURES this number is 0.00. You can use it to track a prevailing market trend and adjust your own strategy: declining open interest for GIFT NIFTY 50 INDEX FUTURES shows that traders are closing their positions, which means a weakening trend.
Buying or selling futures contracts depends on many factors: season, underlying commodity, your own trading strategy. So mostly it's up to you, but if you look for some certain calculations to take into account, you can study technical analysis for GIFT NIFTY 50 INDEX FUTURES. Today its technical rating is neutral, but remember that market conditions change all the time, so it's always crucial to do your own research. See more of GIFT NIFTY 50 INDEX FUTURES technicals for a more comprehensive analysis.