Pre-market Analysis Nifty Bank Nifty 16 August 2023Market Recap
Nifty advanced 0.03% to close at 19434.55
Bank Nifty declined 0.24% to close at 44090.95
India VIX advanced 4.10% to close at 11.99
Trade ideas

nifty or banknifty crucial update blwlast week sold gvn hope u enjoyed from 19700 to19350 now trading at 19380@ support indicate in daily chart 19300if stya blw thna mkt correction will start after lvl sell on rise must. will more in trade hrs. where 19700 strong resst. only abv mkt up side -- now eys on 19300 take support or dedcat bounce19450--500++ ya sell on rise when up side stya tuned with us for full detail.

sell nifty blw 19570 looks lside dwn 19480--428sell nifty blw 19570 looks lside dwn 19480--428 yes looks dwn pressure due to rbi poilicy or cpi data relsedsl will be 19655

Pre-market Analysis Nifty Bank Nifty 14 August 2023Market Recap
Nifty declined 0.59% to close at 19428.30
Bank Nifty declined 0.77% to close at 44199.10
India VIX advanced 1.07% to close at 11.52

Nifty Futures 14th August 2023Go through the charts...levels targets....check previous charts and let m know if you want to understand these levels and markings.
Note how beautifully the levels work

Nifty levels for 14th AugustPrimary trend in Nifty is negative
Please watch out both levels upside and downside

NIFTY 50 Nifty 50 gave an impulsive one-directional movement which was not even mitigated once to make the structure look strong. However, after the recent inducements, I believe we might soon see an Imbalance fill, the move currently has slowed down due to less liquidity but the price will soon take in the search of liquidity and pierce through all the levels to rebalance the downside.


Pre-market Analysis Nifty Bank Nifty 11 August 2023Market Recap
Nifty declined 0.46% to close at 19543.10
Bank Nifty declined 0.76% to close at 44541.80
India VIX advanced 2.33% to close at 11.40

Nifty Futures levels 11th August 2023Go through the charts...levels targets....check previous charts and let m know if you want to understand these levels and markings.
Note how beautifully the levels work

Market analysis Expiry Day_market Moved in consolidation zone .Opened in gap down consolidated in no trading zone.

Pre-market Analysis Nifty Bank Nifty 10 August 2023Market Recap
Nifty advanced 0.32% to close at 19,632.55
Bank Nifty declined 0.19% to close at 44,880.70
India VIX declined 1.63% to close at 11.14

Nifty Futures 10th Aug 2023I have posted enough charts on this platform. Important to learn from these charts see the price action levels and targets marked.
Incase of any confusion plz message.

Expiry day trade idea...All the anchored vwaps are dynamic support and resitance. There is no need to draw support resistabnce zones. But do not take any trade blindly. Please combine anchored vwap lables with price action. For more confirmation you can use intraday vwap indicator with three standard deviations. Or you can add order flow analysis also. According to my observation market is imbalance in between 19755.65 to 19736.10(market doesn't like imbalances). For day trading you can use 1 minute timeframe chart also.
N:B - Gap up opening --- sold into / Gap down opening --- bought into.
Keenly watch avwap labels.

Anchored vwap in day trading...All the anchored vwaps are dynamic support and resitance. There is no need to draw support resistabnce zones. But do not take any trade blindly. Please combine anchored vwap lables with price action. For more confirmation you can use intraday vwap indicator with three standard deviations. Or you can add order flow analysis also. According to my observation market is imbalance in between 19755.65 to 19736.1 . For day trading you can use 1 minute timeframe chart also.

Next Day strategy lines & leval drawing Support & resistance for next day trading.bullish market buyers active at the end of day

Day to of Trading journey Last day support & resistance strategy worked and two trades positionsn appeared.
Trading profit to loss ratio with 2:1.

Pre-market Analysis Nifty Bank Nifty 09 August 2023Market Recap
Nifty declined 0.13% to close at 19,570.85
Bank Nifty advanced 0.28% to close at 44,964.45
India VIX advanced 2.00% to close at 11.32

Nifty Futures 9th Sept 2023The price opening above, between and below the lines marked in red, blue and green usually set pace for the structure of the day. The lines in dash are untouched areas by price which may get filled depending upon the price action and place of opening.
Just observe in lower time frame like 5 min and 3 mins. Observe price action and where there can be a potential support/ resistance followed by another candle.
Go through the previous charts posted by me and carefully check the price behavior at these areas.
Follow me to get updates. Will try and explain through detailed video to all those following and keen to learn.
TRY AND COMPARE THE LEVELS OF THE RED, BLUE AND GREEN LINES COMPARED TO THE PREVIOUS DAY AND OBSERVE IF THE DIRECTION OF THE NEXT DAY CAN BE GAUGED.
BY NOW LOTS OF CHARTS HAVE BEEN POSTED SO ONE CAN GO THROUGH THEM.
KEEP FOLLOWING FOR A DETAILED ANALYSIS ON MY CHARTS.

Pre-market Analysis Nifty Bank Nifty 08 August 2023Market Recap
Nifty advanced 0.41% to close at 19,597.30
Bank Nifty declined 0.09% to close at 44,837.50
India VIX advanced 5.01% to close at 11.10

Trendlines decipher the trend in a simple mannerPost change in polarity of the falling trendline, Nifty has been taking support on the rising trendline.

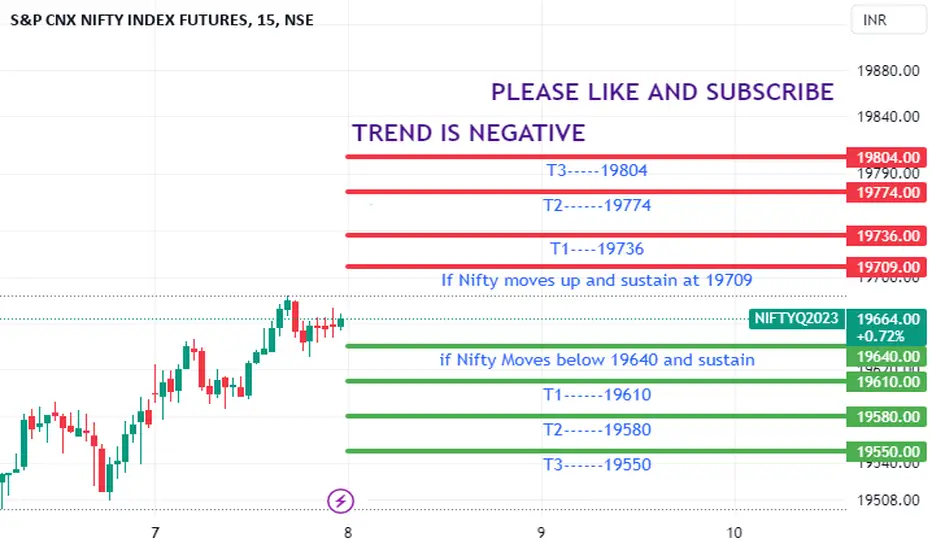
Pre-market Analysis Nifty Bank Nifty 07 August 2023Market Recap
Nifty advanced 0.70% to close at 19517.00
Bank Nifty advanced 0.82% to close at 44879.50
India VIX declined 5.48% to close at 10.57
