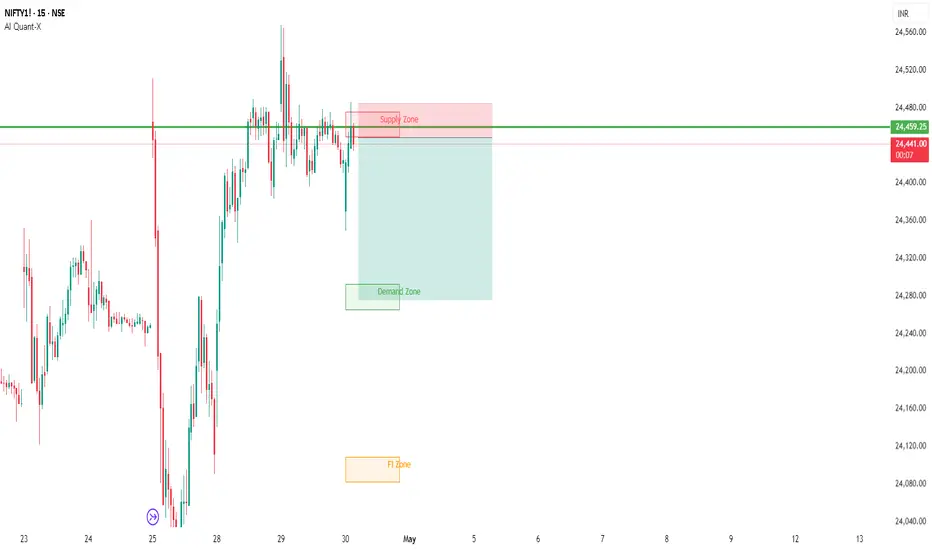
Going long in niftyNifty taking rejection / support of supply zone .. buying nifty when prices closes above the supply zone . sl below supply zone target XI zone.
Traade based on supply break out and retest of zone .
NIFTY1! trade ideas

GIFT NIFTY @ 24825 - Analysis on 20-May-2025LTP 24825
Base Support: 24589
Upper Support Zone: 24834-800-24777
Nifty bullish as long as it is above 24589.
Below this level, Nifty weak.
As per my analysis Nifty may take support between 24834-24777.
Let us wait and watch.

Nifty fut weekly bias - bullish Nifty has created a bullish weekly candle after breaking Previous week high's and also key swing resistance zone of 24800 zone. Next key resistance zone on weekly TF starts from the zone of 25830 from which the selling started

GIFT NIFTY Analysis: Bigger Picture - Long Term - 17-MAY-2025LTP: 25089
Supports: 23728/21821
Resistance: 26440
As per my analysis, Gift Nifty has already started the next bull run for 31K+ long term.
Targets:
Immediate target: 25500
Minimum targets: 26255-26600-27307
Normal targets: 28400-28821-29500
Ultimate targets: 30434, 31250-31600-32377
My strategy: Buy on Dips as long as the support levels hold for 31K+++.

RSI Divergence part 1RSI divergence is fairly reliable, especially when used alongside other technical indicators for confirmation. However, like all technical tools, it's not foolproof and should be used as part of a broader strategy that includes risk management.

GIFT NIFTY @ 24640 - Analysis on 15-May-2025LTP 24640
Supports: 24212, 23755
Resistances: 24800/25089
Break of 24577, we can see 24319-212, 23849-23755, extensions can be 23461, 23073, 22777.
Important support on the downside 22777.
Break of 24800/25089, we can see 25500/26K+++.

RSI Divergence part 1RSI: Divergence appears when the RSI's highs or lows diverge from price. For example, if the price makes new lows but the RSI bottoms at higher levels, it signals bullish divergence; if the price makes new highs but the RSI peaks at lower levels, it signals bearish divergence.

Support and Resistance part 2The support and resistance (S&R) are specific price points on a chart expected to attract the maximum amount of either buying or selling. The support price is a price at which one can expect more buyers than sellers. Likewise, the resistance price is a price at which one can expect more sellers than buyers.

nifty sell trade nifty sell once price closes below the supply zone, Sl above the zone and target is gap filling . Simple concept buy from demand and sell from supply zones .
As price is facing rejection at supply planning sell side trade with small sl .

Ind–Pak Tension Sparks Panic! Gift Nifty Crashes 436 Points Now!Tension across the India–Pakistan border isn’t just making headlines — it’s shaking the markets too.
As per recent reports, there’s been a rise in military activity and geopolitical instability, which triggered a massive reaction in Gift Nifty.
Overnight, Gift Nifty tanked 436 points (~1.8%), with back-to-back red candles and volume spikes confirming a fear-driven move.
Sharp fall on the 30-min chart with increased volume — signs of panic selling.
Geo-political fear is real — institutions hate uncertainty, and this newsflow rattled sentiment.
Key support zones are broken — intraday structure now shifts toward the bearish side.
Volatility likely to spike in today’s opening — option premiums can go wild.
Premium sellers need to stay cautious — blindly deploying short straddles/condors can backfire.
This isn’t just a technical breakdown — it’s a sentiment-driven move.
When fear enters the market, logic takes a back seat — so best is to wait and watch the price behavior post opening.
Watch List: Nifty, Bank Nifty, and Defence sector stocks like HAL, BEL, BDL — expect heightened volatility.
Rahul’s View:
Don’t try to be a hero when headlines are hot. Smart traders protect capital and adapt to risk. Let price stabilize, then take calculated trades — not emotional ones.

Gift nifty updated levels, better to make hedge by put buying How to take trades using Harmonic pattern projection Trade setup is explained below :-
Entry : 1st SL point : 0% is recent top or bottom.
Trailing D: 15.1% is work as trailing SL of buy or sell trade if hit then we have to book profit
.If price goes below 2nd D 22.5% to 24.5% range then early traders can make fresh reversals trade after breaking 1st D 15.1% safe traders can reversal trade after breaking Point D 22.5.4% to 24.5% range
Targets :
Target T1 : 36.1% to 38.3%
Target T3 : 49.1% to 52.5%
T3: 60.9% to 64.8% is our 3rd Target since this is reversal zone so must book profit if break then take fresh trade again
Target T4 : 76.4% to 79.7%
Next Targets are 100% , 127.2% ,141.4% and final Target 161.8%.
How to take reversal trade :
If price going upside/ downside then then buy or sell levels appear on Chart ( Automatically show when price reach any reversal zone of harmonic projection ).
Trailing SL:
After reach 1st Target trail SL to just above or below cost ( for example we are holding sell trade from 100 1st Target 110 hit then move trailing sl to 104-105 and move SL as price move upside or Downside)
Re- Entry :
For Re-entry in any pull back Point D ( 15.1% ) is used for re-entry then SL recent high or low Point SL ( 0% ) .
Blue Line is 1st support/ Resistance
Green line is 2nd support/ resistance
Red line is 3rd Support/ resistance

Divergence Based TradingDivergence occurs when the stochastic oscillator's peaks or troughs disagree with the price. For instance, if the stochastic makes lower highs while the price is rising, it indicates a bearish divergence. Likewise, higher stochastic lows against lower price lows indicate a bullish divergence.

GIFT NIFTY @ 24521Support: 24000/23430
Resistance: 24755
As long as the supports hold, we can see 26K first.
Up move not yet completed. More to go.
My view: Buy on Dips only.

Nifty May 2025 Monthly Futures – Key Levels for the 1st Week
📅 By Raghav on 1-5-2025
Hello everyone!
Here are the key Nifty May Futures levels to watch out for this week:
🔵 Support Zones (where buying interest might emerge):
24,107 – 24,117:
Important demand zone. Price bounced here before — keep an eye if Nifty retests it.
24,346 – 24,356:
Recent reaction zone. Buyers might step in again around this range.
24,389 – 24,400:
Immediate support zone. Price paused here earlier—watch for any reversal signs.
🔴 Resistance Zones (where sellers may become active):
24,462 – 24,471:
Sellers were aggressive here earlier. If price moves up, it could face pressure here again.
24,538 – 24,545:
Strong resistance at the top. Price failed to break through this range earlier.
🧠 Market Structure Brief:
Nifty broke below consolidation support with strong red candles.
Short-term momentum is weak. Bulls must defend the 24,107 zone to avoid deeper correction.
Only a sustained move above 24,471 might invite bullish momentum.
🔔 Key Points to Remember:
Avoid aggressive longs near 24,462–24,545.
Look for price action support near 24,107–24,117 before planning buy entries.
Stay light in position sizing during volatile conditions.
📜 Disclaimer: This analysis is for educational purposes only. I am not a SEBI registered advisor.

Nifty monthly bias - bullish behavior continuesNifty monthly chart looks bullish after bouncing from a key support level, analysis based on simple price action shows the probable price behavior going ahead.

nifty can be sold .Nifty taking rejection from supply zone on smaller time frame , We can sell nifty from here . SL will be above the Zone and target will be Demand Zone .
Simple trading setup sell from Supply buy from Demand .
Nifty Future Eying 24800?Nifty Futures:
CMP:24380
TF: 15 minutes
The Harmonic pattern suggests that the price could head towards 24800+
The internal counts suggests that one more leg on the upside is due..
keeping a close watch/trailing for the long set up

selling Nifty from XI zone .nifty price is taking rejection from supply zone on smaller time frame . selling nifty with SL above the XI zone and targetting Supply Zone .

Gift Nifty Trend directionGift Nifty 23120 - Is moving in rounding bottom pattern on daily chart pattern. Support at 22660.
AS long as 22660 not broke out it shall move to 24100.

Nifty fut price analysisPrice has showed a bullish behavior from a key monthly level and it is heading towards key weekly level of 23500 zone.

nifty long tradebuy nifty when candle closes above demand zone . considering demand rejection . sl below the zone and target supply zone

Nifty View **Nifty**, officially known as **Nifty 50**, is a benchmark stock market index in India, representing the weighted average of 50 of the largest and most liquid Indian companies listed on the **National Stock Exchange (NSE)**.
### 🔹 Key Details:
- **Full Name:** Nifty 50 (National Stock Exchange Fifty)
- **Launched:** April 22, 1996
- **Managed By:** NSE Indices Limited (a subsidiary of NSE)
- **Base Year:** 1995
- **Base Value:** 1000 points
- **Index Type:** Broad-based market index
- **No. of Companies:** 50
---
### 🔸 Sectors Covered:
Nifty 50 includes companies from **14 sectors** such as:
- Financial Services (largest weight)
- Information Technology
- Consumer Goods
- Oil & Gas
- Automobiles
- Pharma
- Metals
- Telecom
- Power
---
### 🔹 Top Companies in Nifty 50 (as of early 2025):
1. **Reliance Industries**
2. **HDFC Bank**
3. **ICICI Bank**
4. **Infosys**
5. **TCS**
6. **Larsen & Toubro (L&T)**
7. **Kotak Mahindra Bank**
8. **ITC**
9. **Hindustan Unilever**
10. **Bharti Airtel**
---
### 🔸 Importance of Nifty 50:
- Used as a **benchmark index** for mutual funds and ETFs.
- Represents the **health of the Indian equity market**.
- Attracts **domestic and global investors**.
- Indicates the **market sentiment** and overall economic conditions.
---
### 🔹 Nifty 50 Derivatives:
- **Nifty Futures & Options (F&O)** are among the most traded derivatives in India and Asia.
- Widely used by traders for hedging and speculation.
---

Gift nifty if break 22690 then temporary bottom formation done How to take trades using Harmonic pattern projection Trade setup is explained below :-
Entry : 1st SL point : 0% is recent top or bottom.
Trailing D: 11.4% is work as trailing SL of buy or sell trade if hit then we have to book profit
.If price goes below 2nd D 21.4% to 23.6% range then early traders can make fresh reversals trade after breaking 1st D 11.4% safe traders can reversal trade after breaking Point D 21.4% to 23.6% range
Targets :
Target T1 : 35.1% to 38.3%
Target T3 : 49.1% to 53.2%
T3: 60.9% to 64.8% is our 3rd Target since this is reversal zone so must book profit if break then take fresh trade again
Target T4 : 76.4% to 79.7%
Next Targets are 100% , 127.2% ,141.4% and final Target 161.8%.
How to take reversal trade :
If price going upside/ downside then then buy or sell levels appear on Chart ( Automatically show when price reach any reversal zone of harmonic projection pattern based .
After showing reversal levels wait for confirmation until 21.4% or 28.3 % level not break if break then exit from current buy / sell trade and take fresh reverse trade buy/ sell .
Trailing SL:
After reach 1st Target trail SL to just above or below cost ( for example we are holding sell trade from 100 1st Target 110 hit then move trailing sl to 104-105 and move SL as price move upside or Downside)
Re- Entry :
For Re-entry in any pull back Point D ( 11.4% ) is used for re-entry then SL recent high or low Point SL ( 0% ) .
Blue Line is 1st support/ Resistance
Green line is 2nd support/ resistance
Red line is 3rd Support/ resistance
