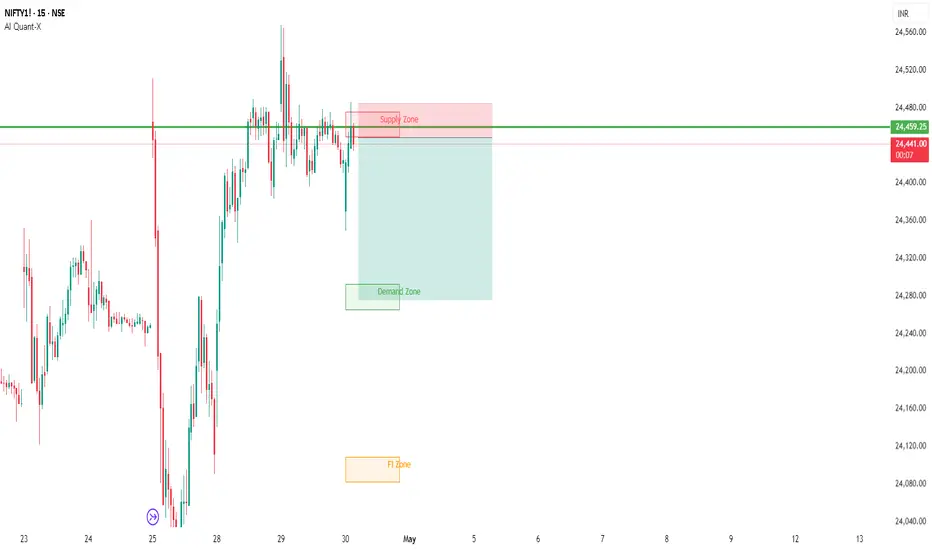
nifty sell trade nifty sell once price closes below the supply zone, Sl above the zone and target is gap filling . Simple concept buy from demand and sell from supply zones .
As price is facing rejection at supply planning sell side trade with small sl .
Trade ideas

Ind–Pak Tension Sparks Panic! Gift Nifty Crashes 436 Points Now!Tension across the India–Pakistan border isn’t just making headlines — it’s shaking the markets too.
As per recent reports, there’s been a rise in military activity and geopolitical instability, which triggered a massive reaction in Gift Nifty.
Overnight, Gift Nifty tanked 436 points (~1.8%), with back-to-back red candles and volume spikes confirming a fear-driven move.
Sharp fall on the 30-min chart with increased volume — signs of panic selling.
Geo-political fear is real — institutions hate uncertainty, and this newsflow rattled sentiment.
Key support zones are broken — intraday structure now shifts toward the bearish side.
Volatility likely to spike in today’s opening — option premiums can go wild.
Premium sellers need to stay cautious — blindly deploying short straddles/condors can backfire.
This isn’t just a technical breakdown — it’s a sentiment-driven move.
When fear enters the market, logic takes a back seat — so best is to wait and watch the price behavior post opening.
Watch List: Nifty, Bank Nifty, and Defence sector stocks like HAL, BEL, BDL — expect heightened volatility.
Rahul’s View:
Don’t try to be a hero when headlines are hot. Smart traders protect capital and adapt to risk. Let price stabilize, then take calculated trades — not emotional ones.

Gift nifty updated levels, better to make hedge by put buying How to take trades using Harmonic pattern projection Trade setup is explained below :-
Entry : 1st SL point : 0% is recent top or bottom.
Trailing D: 15.1% is work as trailing SL of buy or sell trade if hit then we have to book profit
.If price goes below 2nd D 22.5% to 24.5% range then early traders can make fresh reversals trade after breaking 1st D 15.1% safe traders can reversal trade after breaking Point D 22.5.4% to 24.5% range
Targets :
Target T1 : 36.1% to 38.3%
Target T3 : 49.1% to 52.5%
T3: 60.9% to 64.8% is our 3rd Target since this is reversal zone so must book profit if break then take fresh trade again
Target T4 : 76.4% to 79.7%
Next Targets are 100% , 127.2% ,141.4% and final Target 161.8%.
How to take reversal trade :
If price going upside/ downside then then buy or sell levels appear on Chart ( Automatically show when price reach any reversal zone of harmonic projection ).
Trailing SL:
After reach 1st Target trail SL to just above or below cost ( for example we are holding sell trade from 100 1st Target 110 hit then move trailing sl to 104-105 and move SL as price move upside or Downside)
Re- Entry :
For Re-entry in any pull back Point D ( 15.1% ) is used for re-entry then SL recent high or low Point SL ( 0% ) .
Blue Line is 1st support/ Resistance
Green line is 2nd support/ resistance
Red line is 3rd Support/ resistance

Divergence Based TradingDivergence occurs when the stochastic oscillator's peaks or troughs disagree with the price. For instance, if the stochastic makes lower highs while the price is rising, it indicates a bearish divergence. Likewise, higher stochastic lows against lower price lows indicate a bullish divergence.

GIFT NIFTY @ 24521Support: 24000/23430
Resistance: 24755
As long as the supports hold, we can see 26K first.
Up move not yet completed. More to go.
My view: Buy on Dips only.

Nifty May 2025 Monthly Futures – Key Levels for the 1st Week
📅 By Raghav on 1-5-2025
Hello everyone!
Here are the key Nifty May Futures levels to watch out for this week:
🔵 Support Zones (where buying interest might emerge):
24,107 – 24,117:
Important demand zone. Price bounced here before — keep an eye if Nifty retests it.
24,346 – 24,356:
Recent reaction zone. Buyers might step in again around this range.
24,389 – 24,400:
Immediate support zone. Price paused here earlier—watch for any reversal signs.
🔴 Resistance Zones (where sellers may become active):
24,462 – 24,471:
Sellers were aggressive here earlier. If price moves up, it could face pressure here again.
24,538 – 24,545:
Strong resistance at the top. Price failed to break through this range earlier.
🧠 Market Structure Brief:
Nifty broke below consolidation support with strong red candles.
Short-term momentum is weak. Bulls must defend the 24,107 zone to avoid deeper correction.
Only a sustained move above 24,471 might invite bullish momentum.
🔔 Key Points to Remember:
Avoid aggressive longs near 24,462–24,545.
Look for price action support near 24,107–24,117 before planning buy entries.
Stay light in position sizing during volatile conditions.
📜 Disclaimer: This analysis is for educational purposes only. I am not a SEBI registered advisor.

Nifty monthly bias - bullish behavior continuesNifty monthly chart looks bullish after bouncing from a key support level, analysis based on simple price action shows the probable price behavior going ahead.

nifty can be sold .Nifty taking rejection from supply zone on smaller time frame , We can sell nifty from here . SL will be above the Zone and target will be Demand Zone .
Simple trading setup sell from Supply buy from Demand .
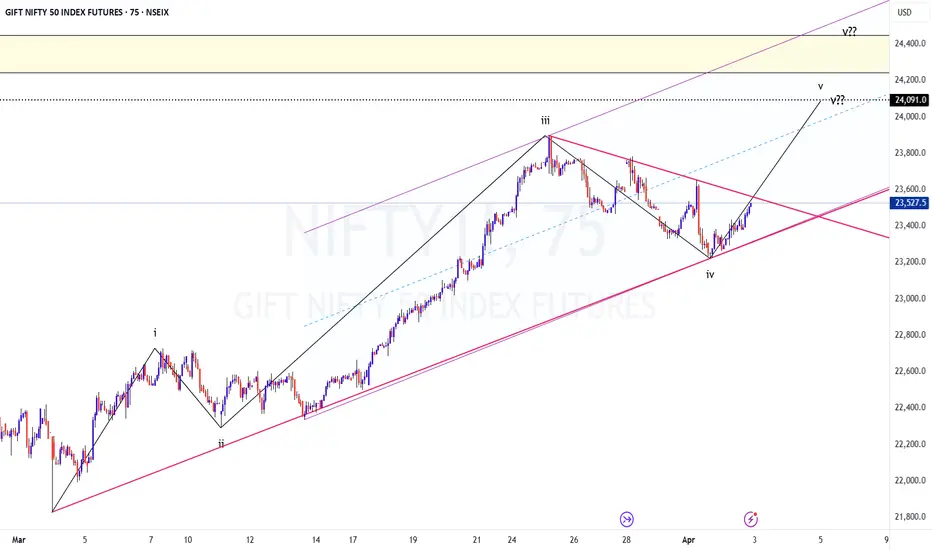
Nifty Future Eying 24800?Nifty Futures:
CMP:24380
TF: 15 minutes
The Harmonic pattern suggests that the price could head towards 24800+
The internal counts suggests that one more leg on the upside is due..
keeping a close watch/trailing for the long set up

selling Nifty from XI zone .nifty price is taking rejection from supply zone on smaller time frame . selling nifty with SL above the XI zone and targetting Supply Zone .

Gift Nifty Trend directionGift Nifty 23120 - Is moving in rounding bottom pattern on daily chart pattern. Support at 22660.
AS long as 22660 not broke out it shall move to 24100.

Nifty fut price analysisPrice has showed a bullish behavior from a key monthly level and it is heading towards key weekly level of 23500 zone.

nifty long tradebuy nifty when candle closes above demand zone . considering demand rejection . sl below the zone and target supply zone

Nifty View **Nifty**, officially known as **Nifty 50**, is a benchmark stock market index in India, representing the weighted average of 50 of the largest and most liquid Indian companies listed on the **National Stock Exchange (NSE)**.
### 🔹 Key Details:
- **Full Name:** Nifty 50 (National Stock Exchange Fifty)
- **Launched:** April 22, 1996
- **Managed By:** NSE Indices Limited (a subsidiary of NSE)
- **Base Year:** 1995
- **Base Value:** 1000 points
- **Index Type:** Broad-based market index
- **No. of Companies:** 50
---
### 🔸 Sectors Covered:
Nifty 50 includes companies from **14 sectors** such as:
- Financial Services (largest weight)
- Information Technology
- Consumer Goods
- Oil & Gas
- Automobiles
- Pharma
- Metals
- Telecom
- Power
---
### 🔹 Top Companies in Nifty 50 (as of early 2025):
1. **Reliance Industries**
2. **HDFC Bank**
3. **ICICI Bank**
4. **Infosys**
5. **TCS**
6. **Larsen & Toubro (L&T)**
7. **Kotak Mahindra Bank**
8. **ITC**
9. **Hindustan Unilever**
10. **Bharti Airtel**
---
### 🔸 Importance of Nifty 50:
- Used as a **benchmark index** for mutual funds and ETFs.
- Represents the **health of the Indian equity market**.
- Attracts **domestic and global investors**.
- Indicates the **market sentiment** and overall economic conditions.
---
### 🔹 Nifty 50 Derivatives:
- **Nifty Futures & Options (F&O)** are among the most traded derivatives in India and Asia.
- Widely used by traders for hedging and speculation.
---

Gift nifty if break 22690 then temporary bottom formation done How to take trades using Harmonic pattern projection Trade setup is explained below :-
Entry : 1st SL point : 0% is recent top or bottom.
Trailing D: 11.4% is work as trailing SL of buy or sell trade if hit then we have to book profit
.If price goes below 2nd D 21.4% to 23.6% range then early traders can make fresh reversals trade after breaking 1st D 11.4% safe traders can reversal trade after breaking Point D 21.4% to 23.6% range
Targets :
Target T1 : 35.1% to 38.3%
Target T3 : 49.1% to 53.2%
T3: 60.9% to 64.8% is our 3rd Target since this is reversal zone so must book profit if break then take fresh trade again
Target T4 : 76.4% to 79.7%
Next Targets are 100% , 127.2% ,141.4% and final Target 161.8%.
How to take reversal trade :
If price going upside/ downside then then buy or sell levels appear on Chart ( Automatically show when price reach any reversal zone of harmonic projection pattern based .
After showing reversal levels wait for confirmation until 21.4% or 28.3 % level not break if break then exit from current buy / sell trade and take fresh reverse trade buy/ sell .
Trailing SL:
After reach 1st Target trail SL to just above or below cost ( for example we are holding sell trade from 100 1st Target 110 hit then move trailing sl to 104-105 and move SL as price move upside or Downside)
Re- Entry :
For Re-entry in any pull back Point D ( 11.4% ) is used for re-entry then SL recent high or low Point SL ( 0% ) .
Blue Line is 1st support/ Resistance
Green line is 2nd support/ resistance
Red line is 3rd Support/ resistance

Monthly bias Nifty fut seems to be continuing it's downtrend on the monthly TF. The likely target for this can be 20K support zone. This view stands negated if we get a monthly closing above 24K resistance zone.

GIFT NIFTY ELLIOTT WAVE COUNT starting from the low of 4TH MARCH 2025 in 1 hour TF, GIFT NIFTY shows clear 5 WAVE IMPULSE and time wise double correction in form of WXY.after completion of correction new impulse is also clearly visible which is 1ST WAVE OF 3RD WAVE. 3RD WAVE can go up to 23500-23800 as per fib extension but for that 22800 is major resistance,and after that 230000 is psychological level of resistance. GAP in.tradingview.com UP OPENING AND SUSTAIN ABOVE THAT LEVEL WILL OPEN MORE UPSIDE LEVELS. CHART PATTERN SHOWS INVERSE HEAD & SHOULDER OR FLAG&POLE PATTERN.

GIFTNIFTY towards 24K?Looks like the price in it's 5th leg up on this impulse.. 24050 to 24350 is the PRZ. We have a good amount of juice left on the upside for now..
Whether this is A of the corrective rise or 1st of new 5 wave impulse?
We will have to wait..
In either case, a pullback is due once we hit the PRZ.
Disclaimer: I am not a SEBI registered Analyst and this is not a trading advise. Views are personal and for educational purpose only. Please consult your Financial Advisor for any investment decisions. Please consider my views only to get a different perspective (FOR or AGAINST your views). Please don't trade FNO based on my views. If you like my analysis and learnt something from it, please give a BOOST. Feel free to express your thoughts and questions in the comments section.
NIFTY INDEX close to end of downtrend from sep 2024 .look like final leg of selling can come in April 2025 accumulate good quality and quantity in any fall towards 22000-22500 levels hold with 21000 monthly closing support . chances in favor of next bull market to start soon may or June 2025 . towards 28000-29000 levels with march 2026 .considering there are all Micro Environment and Macro Environment are in favor .

NIFTY Futures - Short !! 26-3=2025Price Action: After a strong rally, NIFTY is consolidating within a supply zone.
Key Zone: 23,700–23,720 acting as resistance.
Bearish Trigger: A breakdown below 23,680 can push prices lower.
Targets: 23,620 → 23,580
Stop-loss: Above 23,725 to manage risk.
⚠️ Watch for volume confirmation before entry.

GIFT NIFTY @ 23765: Bull or Bear? 26-Mar-2025LTP 23765
Resistance: 24389
Support: 323555/23234
As long as Nifty above 23555, we can see more upside towards 23836, 24100+++
Primary Scenario: Bull
Alt Scenario: Bear.
But I don't expect big fall. I expect just a correction for new highs.

GIFT Nifty Projections for week 3 of March and beyondFundamentals/Basis :
Due to most uncertainties of the US related news including Trump Tariff wars, US shutdown vote, Russia Ukraine war ceasefire talks, US possible recession, most of the global economies were in downward trend including US,excepting china which is seeing correction /growth.
How India will deal with US tariffs is a wait and watch , which could come into effect starting April. With Ministers flying to US to negotiate and trying to find middle path, one can expect a reasonable middle ground with US tariffs, by increasing US supplies,reducing tariffs etc from the Indian govt. At this moment, Indian government might not go for a tit-for-tat approach , which will hurt its interests.
Technicals :
Most of the corrections had happened since the election of Trump, the Nifty had been on the decline since its highs of oct last year and is at lower than yearly lows.
Price of Gift Nifty gives an early indication of the Nifty 50 movement.
Price is moving in a channel ,shown in the rectangular box and has a minor breakout.
Trade Idea:
If the Price breaks out of 22600, can test 22720-780- and after a retrace to a max of 450 can bounce again to 22940-23080
If the price could not break or sustain 22600 ,probable to fall with the channel again and test 22280-320.
These higher and lower levels mentioned will be decision points for further trends for the rest of the year.
Disclaimer : Analysis expressed are my own personal analysis and views. Not a SEBI registered analyst. Plan and trade as per your analysis.

Nifty 50 view🚀 Nifty 50 — Big Move Loading?
📈 Nifty is knocking on a major resistance zone at 23,900–24,000! But here's the deal—until we see a strong breakout, it's time to sit tight and let the market decide the next big move.
💡 What Should You Do?
✅ Wait for a clean breakout above 24,000 before jumping in—don’t chase fake moves!
✅ Already holding positions? Stick to your plan with a strict stop-loss at 23,500.
✅ Patience pays! Let the market confirm the trend before committing heavy capital.
🔍 Key Levels to Watch:
📍 Resistance: 23,900–24,000 (Breakout trigger zone)
📍 Support: 23,500 (Your safety net)
⚠️ The Smart Play: Stay disciplined—don’t trade on hope, trade on confirmation! The real fireworks start when Nifty cracks 24,000 with strong momentum. 🎇🚀
