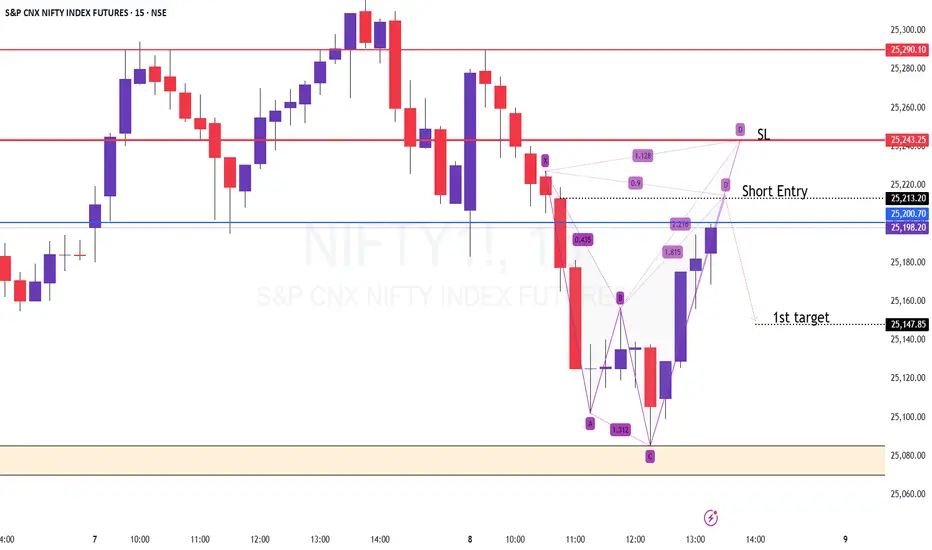
NIFTY Future - Harmonic Shark Pattern approaching PRZ - IntradayTF: 15 minutes
CMP: 25190
The Harmonic pattern formed intraday is close to the PRZ at 25210-220
One can expect 50% retracement of the CD leg (that is 25150) as the first target.
SL at 25240 in NF
Disclaimer: I am not a SEBI registered Analyst and this is not a trading advise. Views are person
Related futures
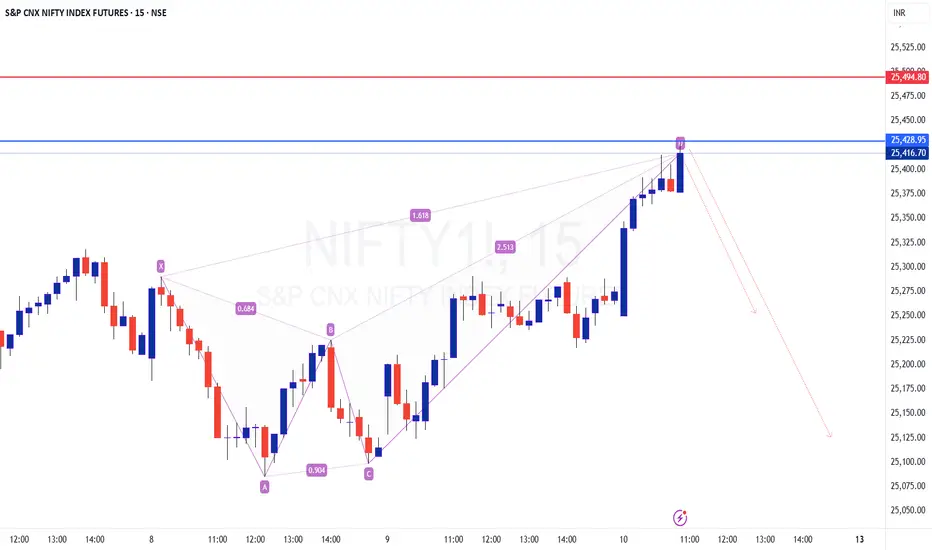
Nifty Future - Harmonic CRAB at the PRZ
TF: 15 minutes
CMP: 25420
The Harmonic Crab pattern is in play and is now at the resistance/PRZ zone of 25400-420
Please be informed that, more often than not, price action at the PRZ is frequently extended beyond the 1.618 fib level (since this pattern itself is known as Extension pattern).
Fir
"Bull Flag on the cards"???# NIFTY FUTURES - Short-term Consolidation Expected 📉
**Current Price:** 25,220 | **Change:** -1.00 (-0.00%)
---
## 🎯 ANALYSIS OVERVIEW
**Timeframe:** Next 2-3 days only
**Bias:** Short-term BEARISH (Contra view)
**Larger Trend:** BULLISH (Target 26,000+)
---
## 📊 TECHNICAL SETUP
### Patt

Get set Gooooo;;;;;;;;;;;**Key Observations:**
- Clean breakout above the resistance trendline held since May 12th
- Markets have been range-bound for 6 months (May-October)
- We might at least cross the upper range before the market decides its next major move
- Current price: 25,392.80
**Trading Plan (Today is BO Day):**
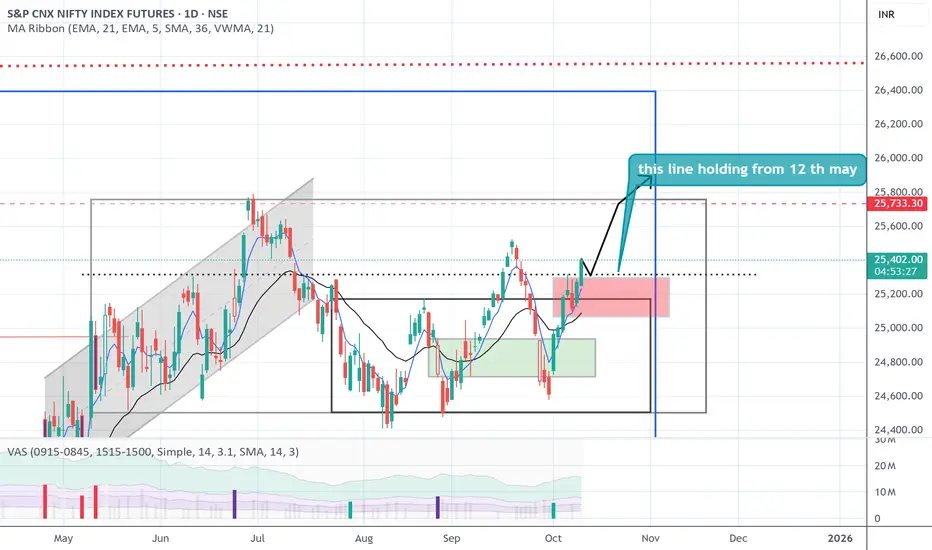
24k to 26k still in play# NIFTY 50 FUTURES - Range Trading Opportunity 📊
## Market Structure Analysis
NIFTY has completed its **breakout phase** and **channel formation**, and is now entering a **range-bound trading environment**. The market has tested the lower end of the channel and is showing signs of support.
## Key

Developing Monthly bias How to build bias for any month ?
Building Monthly Bias with CPR
1. Identify the Central Pivot Range (CPR) for the month
• CPR is the average price level for the month.
• It remains constant throughout the month and acts as the balance point.
2. Mark Key Levels:
• Above CPR: Previous Monthly H

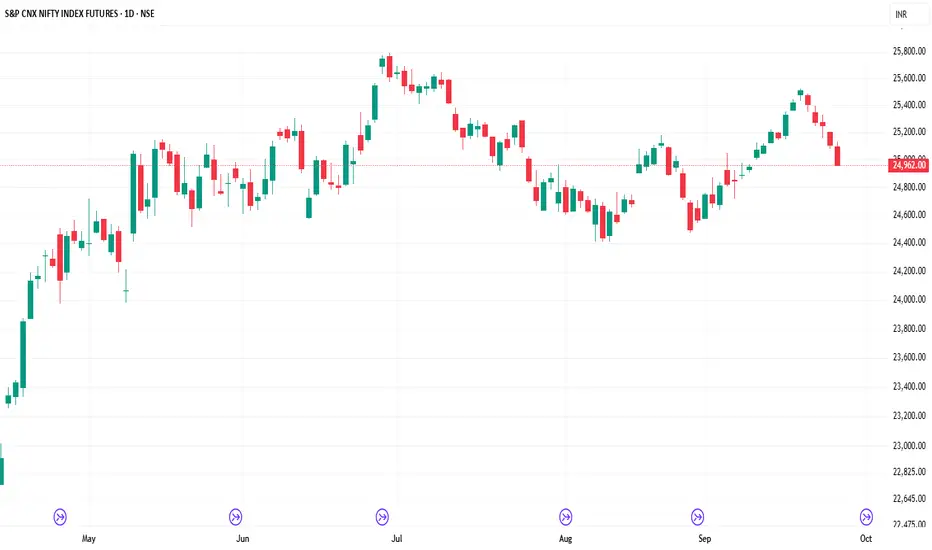
Price Signals Weakness: Hints at Lower low formation on Daily TFThis week, Nifty has formed a distinctly bearish candle, indicating strong dominance by the sellers. This development suggests that the price action may be preparing for the formation of another lower low on the daily timeframe. The possible scenarios in line with this outlook have been discussed in

INFY 1D Time frame📊 Daily Snapshot
Closing Price: ₹1,484.65
Day’s Range: ₹1,476.50 – ₹1,502.70
Previous Close: ₹1,494.60
Change: Down –0.64%
52-Week Range: ₹1,307.00 – ₹2,006.45
Market Cap: ₹6.17 lakh crore
P/E Ratio (TTM): 22.62
Dividend Yield: 2.90%
EPS (TTM): ₹65.63
Beta: 1.09 (indicating moderate volati
How to Survive Gold Volatility During News Events?Hello Traders!
Gold is one of the most volatile instruments in the market, especially during big news events like US Fed announcements, inflation data, or geopolitical updates.
Many traders either get stopped out too early or end up chasing wild moves.
So how do you survive and trade smartly when g
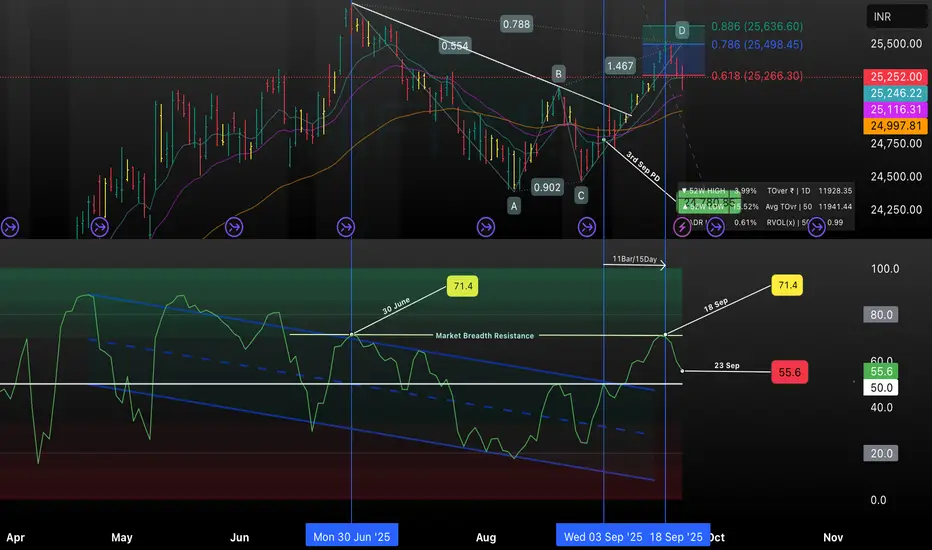
NIFTY 1D | Bearish Harmonic Pattern, RSI Rejection at ResistanceThis chart highlights a bearish harmonic setup forming on NIFTY’s daily timeframe, with key confluence at the 0.618 and 0.786 Fibonacci retracement levels. A descending trendline and ABCD points are marked, exposing short-term reversal probability. The RSI indicator shows clear rejection at the 71.4
See all ideas
Summarizing what the indicators are suggesting.
Neutral
SellBuy
Strong sellStrong buy
Strong sellSellNeutralBuyStrong buy
Neutral
SellBuy
Strong sellStrong buy
Strong sellSellNeutralBuyStrong buy
Neutral
SellBuy
Strong sellStrong buy
Strong sellSellNeutralBuyStrong buy
A representation of what an asset is worth today and what the market thinks it will be worth in the future.
Displays a symbol's price movements over previous years to identify recurring trends.
Frequently Asked Questions
The current price of GIFT NIFTY 50 INDEX FUTURES is 26,112.5 USD — it has risen 0.54% in the past 24 hours. Watch GIFT NIFTY 50 INDEX FUTURES price in more detail on the chart.
Track more important stats on the GIFT NIFTY 50 INDEX FUTURES chart.
The nearest expiration date for GIFT NIFTY 50 INDEX FUTURES is Jun 30, 2026.
Traders prefer to sell futures contracts when they've already made money on the investment, but still have plenty of time left before the expiration date. Thus, many consider it a good option to sell GIFT NIFTY 50 INDEX FUTURES before Jun 30, 2026.
Open interest is the number of contracts held by traders in active positions — they're not closed or expired. For GIFT NIFTY 50 INDEX FUTURES this number is 0.00. You can use it to track a prevailing market trend and adjust your own strategy: declining open interest for GIFT NIFTY 50 INDEX FUTURES shows that traders are closing their positions, which means a weakening trend.
Buying or selling futures contracts depends on many factors: season, underlying commodity, your own trading strategy. So mostly it's up to you, but if you look for some certain calculations to take into account, you can study technical analysis for GIFT NIFTY 50 INDEX FUTURES. Today its technical rating is strong buy, but remember that market conditions change all the time, so it's always crucial to do your own research. See more of GIFT NIFTY 50 INDEX FUTURES technicals for a more comprehensive analysis.