crudeoil chart analysis 15 minute time if crudeoil sustain above 6840 level then we can expect next target level 6950 .
( educational purpose only)
CLM2020 trade ideas


CrudeOil Important levels to watch !! CrudeOil important levels to watch are as follows
#Support: 7025
Sell below: 7025 only on 15 minute candle closure below the level.
Target 1: 6960
Target 2: 6860
#Resistance: 7130
Buy Above: 7130 only on 15 minute candle closure Above the level.
Target 1: 7200
Target 2: 7290-7300
=> # Remember each level will act as a support and resistance individually so there is a probability of reversal and a pullback on either side so its better to make an habit to book profits at each targets and re-enter again after a breakout from the same with a proper stoploss as per your own risk appetite.
=> # Please do your own research before initiating any trade. Always use stoploss in order to protect your capital.
=> #If you are Unable to trade properly and dissatisfied with your manual trading results due to psychological disadvantages or busy schedule or "Fear & Greed" emotions, then Algorithmic trading can be the most useful solution to overcome such problems. Kindly follow us and join us using details mentioned below the idea.
=> # Please refer our swing based support and resistance indicator if you find it useful give it a like.
=> # Follow us for more such information and educational ideas and Indicators. Give it a like if you appreciate the idea. Queries will be answered in comment section.
#Disclaimer: This is just a view and published here only for educational purpose, this should not be considered as a buy or sell signal. Trading in stock market may involve financial risk therefore, do your own research before taking any position.

Crude oil Range bond (6900-7500) ****************************************************************************************************
****************************************************************************************************
* All the information shared in this chart is provided for strictly educational purposes only.
* This chart is sharing information are based on the theory of technical analysis .
* This is not an offer to buy or sell stocks, futures , options, commodity, forex, interests or any other trading security.
* Back test yourself before jump into live market consult your financial adviser and use proper risk management.
******************************************************************************************************
******************************************************************************************************
Crude oil bullish till 7500 (rangebound 6900-7500) my buying price around 6850-7000-7100
Stop loss will be buy at hammer at support with Stop loss of same candle
I will kept my order selling order around 7500 -7550-7600 same stop loss will be inverted hammer candle or any bearish candle.
____________________________________________________________
Visit Us for more details and follow us for more Education Analysis
____________________________________________________________
Trading_Cafe24
Thank you :)

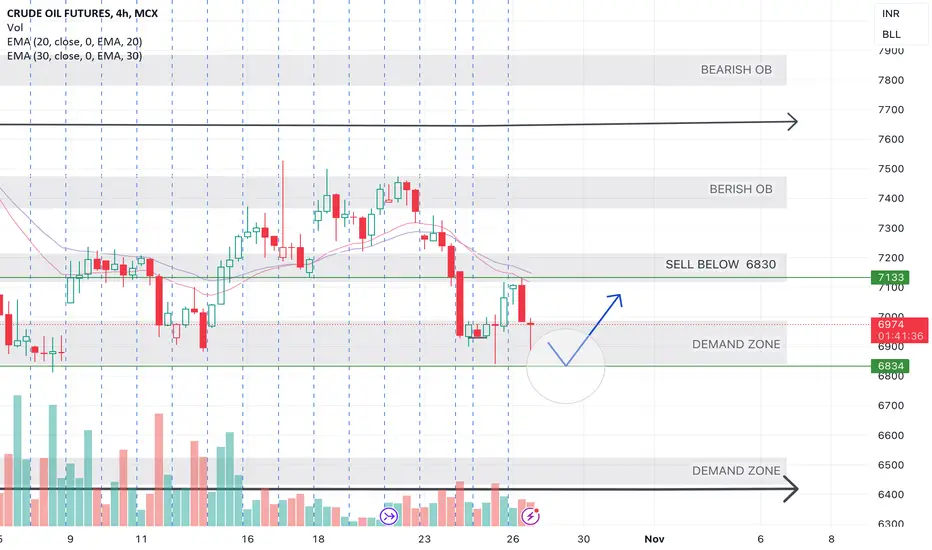
🛢️ #CRUDEOIL Update 📆 26th October
🚨 Critical Juncture Alert 🚨
Crude oil is teetering ( changing direction) near a pivotal level, with potential correction ahead.
Should it hold steady, support at 6830 is plausible in the demand zone.
Crude Oil Important levels to watch !! CrudeOil important levels to watch are as follows
#Support: 7385
Sell below: 7385 only on 15 minute candle closure below the level.
Target 1: 7320
Target 2: 7240
#Resistance: 7475
Buy Above: 7475 only on 15 minute candle closure Above the level.
Target 1: 7525
Target 2: 7580
Target 3: 7680
=> # Remember each level will act as a support and resistance individually so there is a probability of reversal and a pullback on either side so its better to make an habit to book profits at each targets and re-enter again after a breakout from the same with a proper stoploss as per your own risk appetite.
=> # Please do your own research before initiating any trade. Always use stoploss in order to protect your capital.
=> #If you are Unable to trade properly and dissatisfied with your manual trading results due to psychological disadvantages or busy schedule or "Fear & Greed" emotions, then Algorithmic trading can be the most useful solution to overcome such problems. Kindly follow us and join us using details mentioned below the idea.
=> # Please refer our swing based support and resistance indicator if you find it useful give it a like.
=> # Follow us for more such information and educational ideas and Indicators. Give it a like if you appreciate the idea. Queries will be answered in comment section.
#Disclaimer: This is just a view and published here only for educational purpose, this should not be considered as a buy or sell signal. Trading in stock market may involve financial risk therefore, do your own research before taking any position.

Expectations for Crude OIL (NFA)This is what I am thinking for Crude Oil for this week and the upcoming week

did u see yesterda crude gold natral gas rocked all gvn lvl heredid u see yesterda crude gold natral gas rocked all gvn lvl here more lvl keep eys here soon will update dontmisssssss

crude spot eyes on 85$ if stya lw nxt dwn rally possible 84-83$crude spot eyes on 85$ if stya lw nxt dwn rally possible 84-83$ in mcx blw 7100 stya blw thna nxt dwn rally 7044-7010++++ sell on rise woth tight sl 86.10

crude oil in sell side for short termHello,
As per our NEW AI tool indicator crude oil in selling, as per chart above candle SL, below target.
This is for education purpose only.

crude mcx or spot crucial update blw crude spot sustain abv 88$ looks up side 89--91$ again possible where strong support 85.50$ nly blw will create panic till 83.50--81$ -- in mcx sustain abv 7290 mkt up side only till 7250--7430++++ where support 7150 if stya blw thna dwn only till 7088--7055

CLX2023CLX2023 - NYMEX Source CFTC for US markets
Use Nasdaq Data
See attached spreadsheet CFTC Macro Analysis
This spreadsheet as the CFTC CoT Data as a well as the data sourced from ICE Europe for ICE Brent Crude Futures

CRUDEOIL UPDATE - OCTOBER 18If #Crudeoil slips below 7350, it's likely to enter a bearish zone, with the potential for consolidation between 7133 and 7350.

CrudeOil important Levels to watch !CrudeOil important levels to watch are as follows
#Support: 7045
Sell below: 7045 only on 15 minute candle closure below the level.
Target 1: 6930
Target 2: 6750
#Resistance: 7204
Buy Above: 7204 only on 15 minute candle closure Above the level.
Target 1: 7300
Target 2: 7460
=> # Remember each level will act as a support and resistance individually so there is a probability of reversal and a pullback on either side so its better to make an habit to book profits at each targets and re-enter again after a breakout from the same with a proper stoploss as per your own risk appetite.
=> # Please do your own research before initiating any trade. Always use stoploss in order to protect your capital.
=> #If you are Unable to trade properly and dissatisfied with your manual trading results due to psychological disadvantages or busy schedule or "Fear & Greed" emotions, then Algorithmic trading can be the most useful solution to overcome such problems. Kindly follow us and join us using details mentioned below the idea.
=> # Please refer our swing based support and resistance indicator if you find it useful give it a like.
=> # Follow us for more such information and educational ideas and Indicators. Give it a like if you appreciate the idea. Queries will be answered in comment section.
#Disclaimer: This is just a view and published here only for educational purpose, this should not be considered as a buy or sell signal. Trading in stock market may involve financial risk therefore, do your own research before taking any position.

Scope for 7500Since crude is the center of attention of the ongoing crisis and also as we see that an order has been traded at that price range, Crude oil might retest the same level within this week session.

CRUDE update and sideways levelsafter volatile days and a breakdown price or trading in crude is likely to go sideways based on technicals and cahrting POV
(no news adjusted or considered)
so if you interested in tarding crude
buy at 6800-900 and sell at 7300-400

CRUDE OIL MCX - OCTOBER 2nd Week PlanTime frame for study - 4 hr
Conclusion -
-- Continuous two Uptrend seen in crude till 7990 level
-- A correction wave of A,B,C seen till 6970 to 7010 levels for B wave
-- For C wave if any support taken near 6970 - 7010 then immediate target can be 7367 with some ups and down
This chart is only for educational purpose. Do your own study before taking any trades.

Crudeoil expected range this week(16 Oct - 20th Oct)Crude oil expected range this week: 7130 to 7400
Pullback expected in the midweek
Support at 7130
Resistance at 7400

crude oil in its last phase of correction next tar 6200-7600in.tradingview.com
crude in its last leg of correction.
2 year impulsive rally
1 yr corrective consolidation
positive div on rsi
hammer at bottom
abv 6200 tar 6800-7600-8100-10000-11111
till it doesnt cross 6200 it can oscillate between 6200-5500-5200

Can $MCX:CRUDEOIL1! will test 6950Dear Followers,
I hope this message finds you well. I wanted to provide you with a brief update on the stock MCX:CRUDEOIL1! I have been monitoring.
It appears that the stock is approaching a potential resistance level Near 7280-7300 This is an important technical point where the price has historically had difficulty breaking through. It suggests that we may see a temporary halt in the current upward momentum and Possibly it will test 6900 In Downmove.
Resistance Levels to Watch out.
R1= 7250
R2=7320
R3=7380
Support Levels To Watchout.
S1= 7000
S2= 6900
S3= 6830
As always, please remember that investing involves risks, and it's important to carefully consider your options. If you have any questions or would like to discuss this further, please don't hesitate to reach out.
Best regards,
Ajay Metha

whats next on crude? dont get into trapavoid LONG for crude as of now
price likely to face resistance on 7400 and 7500
price will look to sweep liquidity from 6800 lvl
fresh buying can be seen at 6652-50

buy crude stya abv 7190 tgt 7330++ looks buy crude stya abv 7190 tgt 7330++ looks buy only looks breakout abv 86$ till 87--88 sl keep 85$ looks dedcat bounce here dontmiss with lvl trade with lvl to lvl

sell crude 7035@--50 tgt looks 6910 sell on risesell crude 7035@--50 tgt looks 6910 sell on rise keep tight ls 7099 wti blw 85$ blw looks dwn only as per chart
