WTI crude getting ready for 67$It has been a while preparing for this and the lower Bollinger band has moved up to 58.58 in the meantime as immediate support. The indication remains that wave c higher will unfold. I cannot determine right away if this is wave c or iii and that we can conclude later but one leg higher first is wha
About Light Crude Oil Futures
Crude Oil is a naturally occurring liquid fossil fuel resulting from plants and animals buried underground and exposed to extreme heat and pressure. Crude oil is one of the most demanded commodities and prices have significantly increased in recent times. Two major benchmarks for pricing crude oil are the United States' WTI (West Texas Intermediate) and United Kingdom's Brent. The differences between WTI and Brent include not only price but oil type as well, with WTI producing crude oil with a different density and sulfur content. The demand for crude oil is dependent on global economic conditions as well as market speculation. Crude oil prices are commonly measured in USD. Although there have been discussions of replacing the USD with another trade currency for crude oil, no definitive actions have been taken.
Related commodities

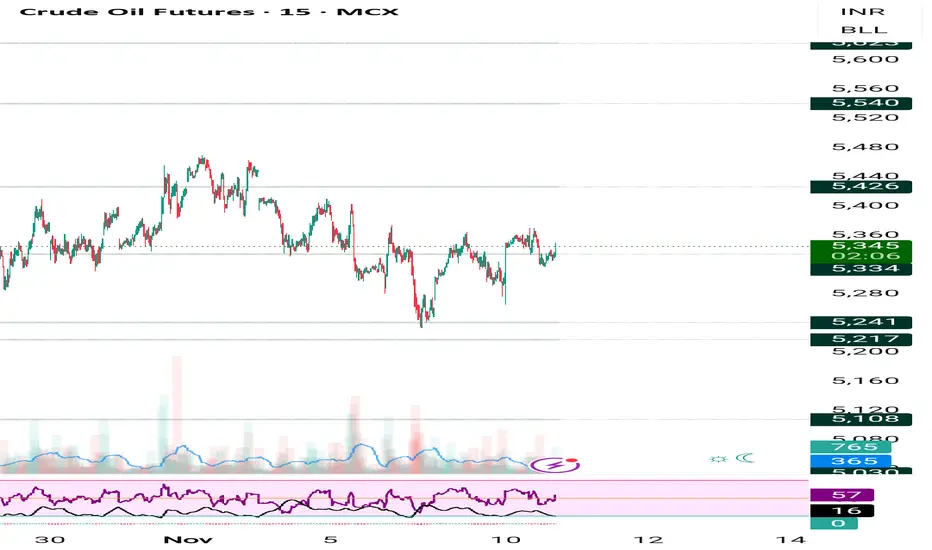
Crude buy 250-280 points range buy on low sell on high 🔑 Key Highlights
- Price Action: Crude trading at ₹5,343, holding above ₹5,300 support.
- Trend: Active Long Build‑Up confirmed.
- Supports: ₹5,300 / ₹5,250 / ₹5,200.
- Resistances: ₹5,380 / ₹5,420 / ₹5,480.
- Bias: Bullish continuation if above ₹5,300; corrective pullback risk below ₹5,250.

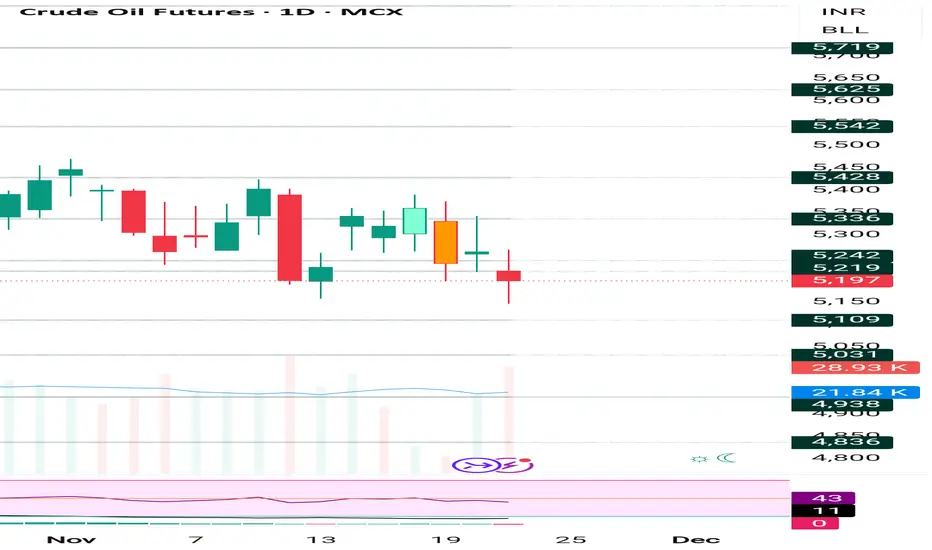
Crude MCX AI tool showing sideways till 5100 or 5280 not break Parameters Data
Asset Name : Price 🟥 Crude Oil MCX (Dec) : 5,188
Price Movement 🟨 Sideways will continue to 5,280, 5,350 if break 5,350 then breakout Until 5,100 not break if break then 5,030, 4,950 possible.
Reason 🟨 Demand Concerns vs. OPEC+ Cuts: Global demand ki chinta aur US inventories mei
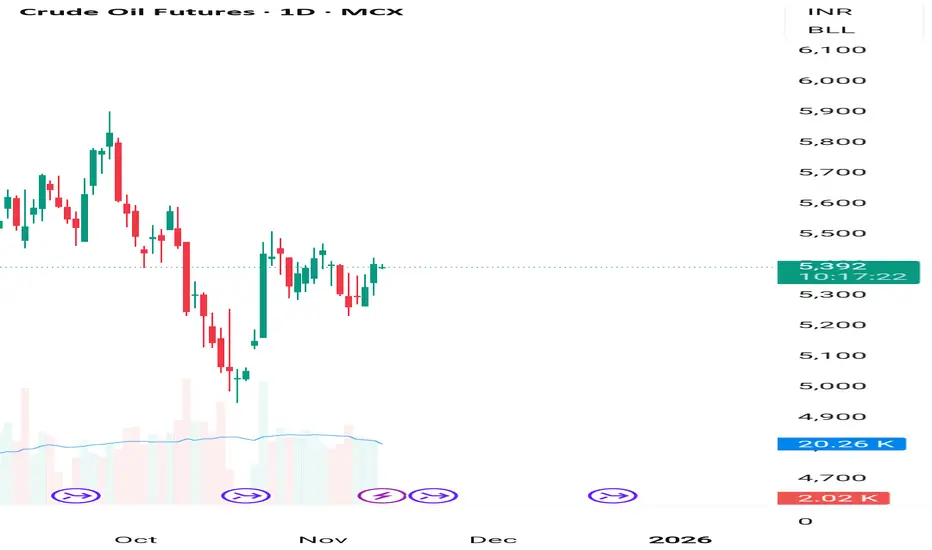
Crude oil AI tool showing unmove will continue until 5300 break 🔑 Key Highlights
- Price Action: Crude is holding firm above ₹5,350, showing renewed bullish momentum.
- Trend: Long Build‑Up (Price↑ + OI↑), indicating fresh long positions.
- Supports: ₹5,350 / ₹5,300 / ₹5,250.
- Resistances: ₹5,420 / ₹5,480 / ₹5,550.
- Bias: Bullish continuation if ₹5,350
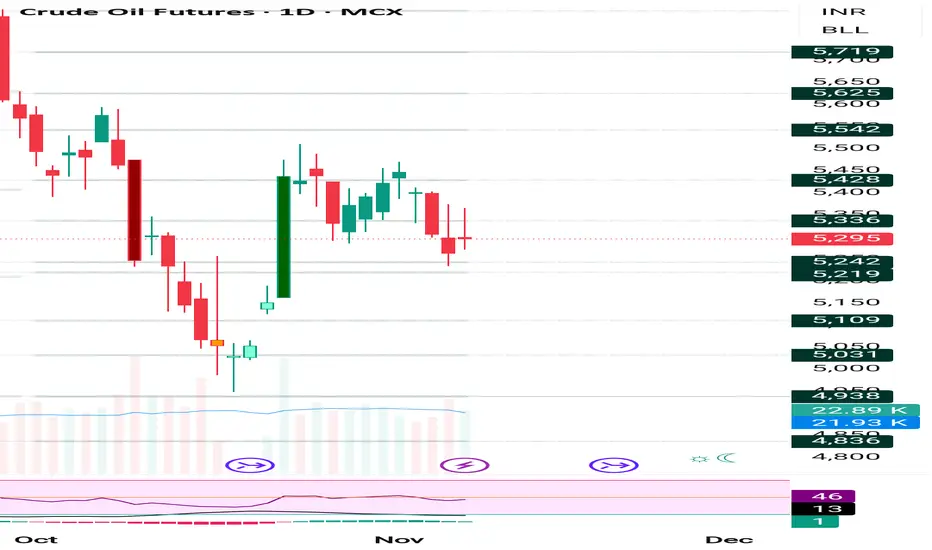
Now we are holding buy trade @5280 , target 5410,5490,5560🔑 Key Highlights (Locked Permanently)
- Supports/Resistances: 5250 is the critical support; breach flips bias.
- Indicators: ADX >25, RSI 63, PCR 0.91 — all thresholds confirmed.
- Liquidity: Turnover ₹12,400 Cr, VWAP 5345 — strong institutional activity.
- Volatility: IV 16.2%, RV 14.5% — bot
MCX Crude Oil – Options Chain Based Market OutlookThe latest MCX Crude Oil options chain signals a sideways to mildly bearish bias for the next session, with price likely to remain trapped within a narrow band due to heavy option writing at key strikes.
Key Levels (Based on OI Structure)
Support Zones
5150 – Strongest support (Highest Put OI: 6,5

Crude start buying on dip 5250-5200 buying area levels on chart Crude start buying on dip 5250 to 5200 buying area , levels given on chart
How My Harmonic pattern projection Indicator work is explained below :
Recent High or Low :
D-0% is our recent low or high
Profit booking zone ( Early / Risky entry) : D 13.2% -D 16.1 % is
range if break them profi
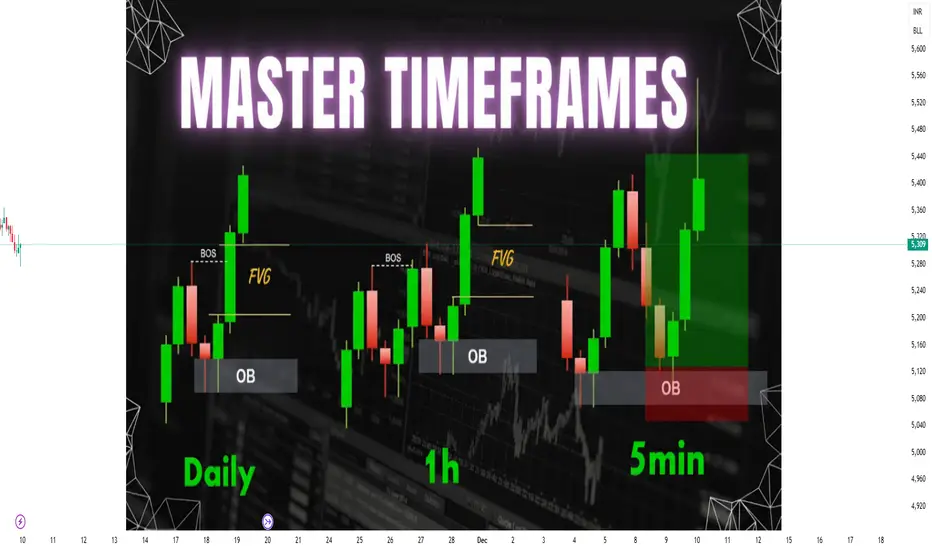
Multi-Timeframe Analysis (Intraday, Swing, Positional)1. Understanding Multi-Timeframe Analysis
Multi-Timeframe Analysis refers to the process of observing the same security across different timeframes to identify trend alignment, potential reversal zones, and optimal trading opportunities. Every timeframe provides unique insights:
Higher Timeframe:
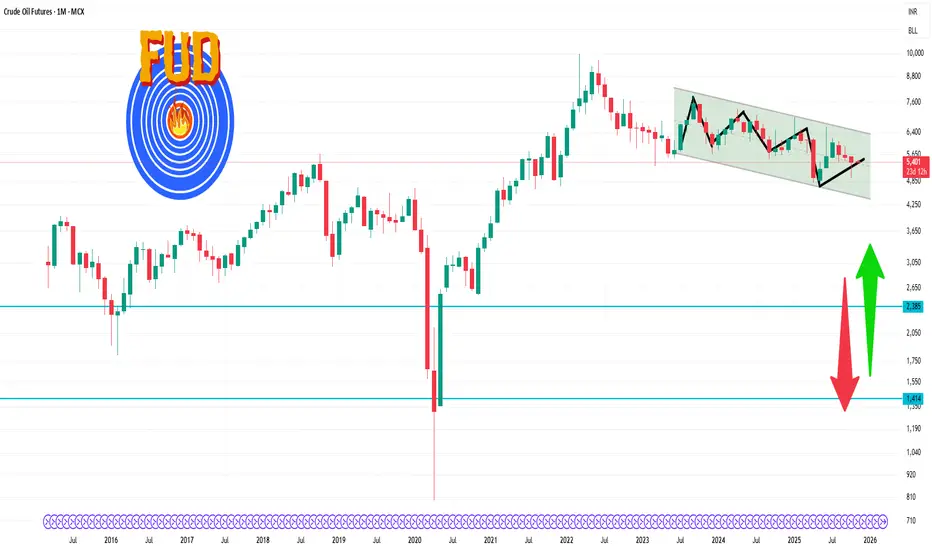
Crude Oil Futures 1 Month Time Frame 🔍 Current Price
Last quoted: ~ ₹ 5,422 per barrel.
Recent 1-month high: ~ ₹ 5,903
Recent 1-month low: ~ ₹ 4,944
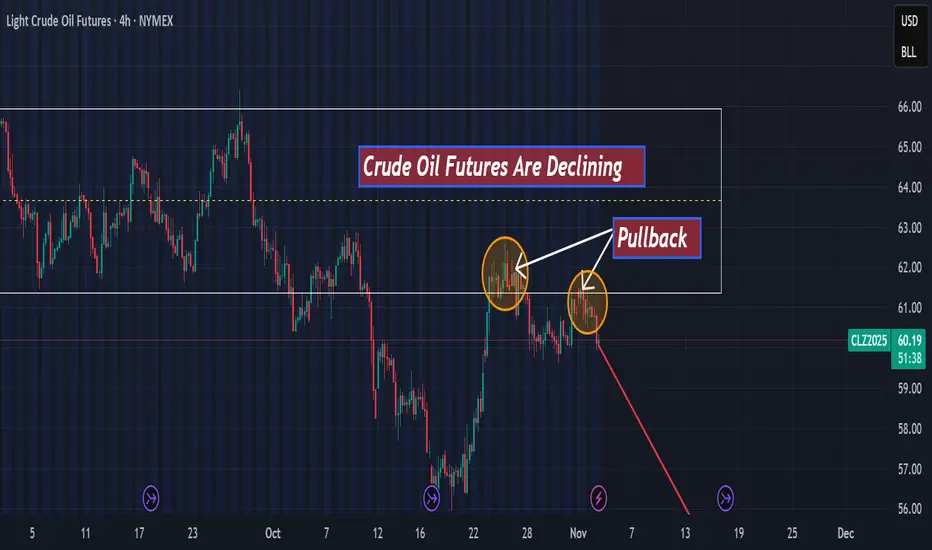
Light Cude Oil Futures are declining hello,
According to my technical analysis, there is a high probability of a decline toward $55 in the next few days for two main reasons:
-A first Pullback on the support level.
-A second pullback retesting that support.
See all ideas
Summarizing what the indicators are suggesting.
Neutral
SellBuy
Strong sellStrong buy
Strong sellSellNeutralBuyStrong buy
Neutral
SellBuy
Strong sellStrong buy
Strong sellSellNeutralBuyStrong buy
Neutral
SellBuy
Strong sellStrong buy
Strong sellSellNeutralBuyStrong buy
A representation of what an asset is worth today and what the market thinks it will be worth in the future.
Displays a symbol's price movements over previous years to identify recurring trends.
Frequently Asked Questions
The current price of Light Crude Oil Futures is 58.06 USD / BLL — it has fallen −1.59% in the past 24 hours. Watch Light Crude Oil Futures price in more detail on the chart.
The volume of Light Crude Oil Futures is 325.65 K. Track more important stats on the Light Crude Oil Futures chart.
Open interest is the number of contracts held by traders in active positions — they're not closed or expired. For Light Crude Oil Futures this number is 379.53 K. You can use it to track a prevailing market trend and adjust your own strategy: declining open interest for Light Crude Oil Futures shows that traders are closing their positions, which means a weakening trend.
Buying or selling futures contracts depends on many factors: season, underlying commodity, your own trading strategy. So mostly it's up to you, but if you look for some certain calculations to take into account, you can study technical analysis for Light Crude Oil Futures. Today its technical rating is strong sell, but remember that market conditions change all the time, so it's always crucial to do your own research. See more of Light Crude Oil Futures technicals for a more comprehensive analysis.