LNG01G2026 trade ideas
#Natural gasNatural gas corrected from $9.2/MMBtu to $2.2/MMBtu.
The latest EIA report showed US utilities added 75 bcf of gas into storage last week, more than market expectations of a 69 bcf increase, as mild weather kept heating demand low
Technically, now Natural gas is forming narrow wedge with some diversions seen in RSI. Despite fundamentally it is negative, diversions on weekly charts shows Natural gas can touch $3.4/MMBtu by May
#Natural gas #Cup&HolderProduction continues to fluctuate in the high 90s Bcf/d to low 100s Bcf/d as pipeline maintenance events temporarily curb gas flows
Preliminary data showed gas output fell to a three-week low of 100.8 billion cubic feet per day on Thursday.
At the same time, gas demand is expected to increase from 91.3 bcfd this week to 91.6 bcfd next week as warmer weather is making more people turn on their air conditioners.
Technically
Forming Cup & Holder formation on Daily chart breaking above 194 can take NG to 220 levels
NATURALGASHi guys, In this chart i Drew My Best Levels in NATURALGAS for Long position using 15min Time frames.... I found a good level here. I Observed these Levels based on price action and Demand & Supply which is My Own Concept Called "PENDAM ZONES" ... Don't Take any trades based on this chart/Post...because this chart is for educational purpose only not for Buy or Sell Recommendation.. Thank Q
Naturalgas reversal zones 11-5-2023Note: Always try to find a good price action patterns or any candle stick patterns in marked zones in smaller timeframe to take entry with small stop loss. Or can take entry based on one 5 min candle close below or above the zone with SL previous candles high or low (*try to avoid big candles).
(Color code for Support & Resistance zones: Red - Sell, Green - Buy, Price once cross above resistance it is obvious it will work as support, vis versa price cross below support zone ). Please understand that market can break all the support and resistance anytime. If any doubt for take entry in price action patterns, please ask in comment box, i will try to help.
Disclaimer: Im not tip provider and this chart is not indented to take trade in my levels, It is shared here for learning purpose. Trading in this pattern is all your own risk. #NG, #Naturalgas
NATURAL GAS S/R ZINES FROM 278 TO 129MCX:NATURALGAS1! NATURAL GAS is at yearly to minthly buying / support zones, can commense major trend reversal on monthly, quarerly and yearly time frame, major s/r levels till 278 targets have been marked along with s/r level till 129 if doeas go downside.
respect the zones and trade only if you know how to trade the support/resistance areas effectively.
Natural gas reversal zones 29-3-2023Note: Always try to find a good price action patterns or any candle stick patterns in marked zones in smaller timeframe to take entry with small stop loss. Or can take entry based on one 5 min candle close below or above the zone with SL previous candles high or low (*try to avoid big candles).
(Color code for Support & Resistance zones: Red - Sell, Green - Buy, Price once cross above resistance it is obvious it will work as support, vis versa price cross below support zone ). Please understand that market can break all the support and resistance anytime. If any doubt for take entry in price action patterns, please ask in comment box, i will try to help.
Disclaimer: Im not tip provider and this chart is not indented to take trade in my levels, It is shared here for learning purpose. Trading in this pattern is all your own risk. #NG, #Naturalgas
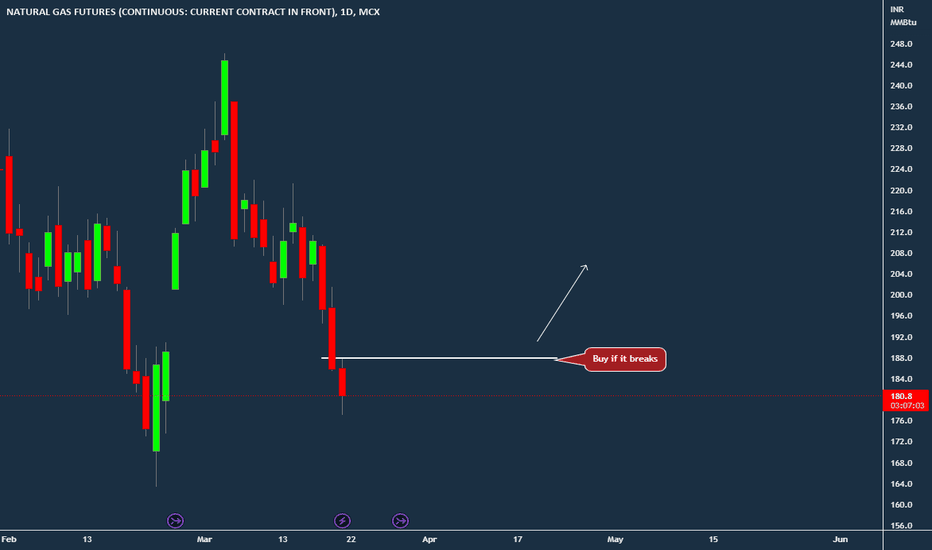
[MCX] Natural Gas Mean ReversionNote -
One of the best forms of Price Action is to not try to predict at all. Instead of that, ACT on the price. So, this chart tells at "where" to act in "what direction. Unless it triggers, like, let's say the candle doesn't break the level which says "Buy if it breaks", You should not buy at all.
=======
I use shorthands for my trades.
"Positional" - means You can carry these positions and I do not see sharp volatility ahead. (I tally upcoming events and many small kinds of stuff to my own tiny capacity.)
"Intraday" -means You must close this position at any cost by the end of the day.
"Theta" , "Bounce" , "3BB" or "Entropy" - My own systems.
=======
I won't personally follow any rules. If I "think" (It is never gut feel. It is always some reason.) the trade is wrong, I may take reverse trade. I may carry forward an intraday position. What is meant here - You shouldn't follow me because I may miss updating. You should follow the system I share.
=======
Like -
Always follow a stop loss.
In the case of Intraday trades, it is mostly the "Day's High".
In the case of Positional trades, it is mostly the previous swings.
I do not use Stop Loss most of the time. But I manage my risk with options as I do most of the trades using derivatives.
=======
NG (MCX): Week of - 20/03/2023Levels:
Support: 195, 180. 173, 163, 150
Resistance: 200-205, 210, 215, 220
OI Data (24rd March Expiry):
Nearest Major Resistance per OI data: 220
Nearest Major Support per IO data: 180
Trade setup:
+++++++++++++++++++++++++++++++++++++++++
Trade | Level | SL | T1 | T2
-----------------------------------------
BUY | > 210 | 210 | 220 | 235
-----------------------------------------
SELL | < 190 | 200 | 180 | 165
+++++++++++++++++++++++++++++++++++++++++


