Natural Gas MCX Future Weekly Technical Analysis 15-19 July📈 NG MCX Future Technical Chart Analysis
📊 Range Trigger Point: 196.00
📉 Weekly Range: 16.40
📅 Level Type: Weekly
📅 Valid For: 15 to 19 July, 2024
📈 Buy Above: 198.44
💼 Average Position: 196.50
🎯 Buy Target 1: 206.14
🎯 Buy Target 2: 212.40
🛑 Stoploss: 192.97
📉 Sale Below: 194.56
🎯 Sale Target 1: 185.86
🎯 Sale Target 2: 179.60
🛑 Stoploss: 200.03
✨ Follow and engage for more insightful updates. Your engagement fuels our dedication to providing top-notch content! 🚀❤️
#NG #MCX #Commodities #Trading #TechnicalAnalysis #StockMarket
NG1! trade ideas

Natural gas avoid fresh sell we sold @249Disclaimer -
This information is only for educational purposes, this is not for any buy or sell recommendations .
On Our Harmonic pattern indicator
based trade setup take trade as explained below :-
ENTRY -
When price breaks 30% retracement Which is D points then take Entry on Buy or Sell Trade
SL -
SL is (-3%) Which is mentioned in Chart . our SL is just above or below of Recent high or Low .
TARGET -
Target 1- (T1 : 61.8 %)
Target 2- (T2 : 88.6 %)
Target 3- (T3 : 127.2 %)
Target 4- (T4 : 161.8 %)
Please note:-
It's working on news based and volitile market very well so exit if SL hit

Natural Gas (NG) - Potential Breakout Watch - July 11, 2024
Current Situation: Natural Gas is currently trading around 195.75 (based on your previous info).
Analysis: We're observing a potential breakout situation on the chart.
Bullish Breakout: If Natural Gas breaks and closes above 196.5, it could signal a potential price increase.
Target: No specific target mentioned, but a breakout typically suggests prices could move upwards.
Invalidation: A price drop below 194.5 would weaken the bullish case and suggest a potential downside move.

Natural Gas MCX Fut Technical Chart Analysis 11 July, 2024📈 NG MCX Future Technical Chart Analysis
📊 Range Trigger Point: 194.90
📉 Day Range: 7.60
📈 Buy Above: 196.80
💼 Average Position: 195.90
🎯 Buy Target 1: 199.60
🎯 Buy Target 2: 202.50
🛑 Stoploss: 194.27
📉 Sale Below: 195.00
🎯 Sale Target 1: 190.20
🎯 Sale Target 2: 187.30
🛑 Stoploss: 197.53
✨ Follow and engage for more insightful updates. Your engagement fuels our dedication to providing top-notch content! 🚀❤️
#NaturalGas #NG #MCX #Commodities #Trading #TechnicalAnalysis #EnergyTrading #StockMarket #Finance

Natural Gas Bullish Wedge Breakout Watch - 10 JULY VANTAGE:NG Eyes Bullish Breakout! (July 10, 2024)
1-hour Chart: Falling wedge pattern hints at a potential price reversal.
Current Price: ≈ 199.5
Bullish Signal: Watch for a break and close above 199.5 (resistance).
Downtrend resumes if price falls below 198.3.(Support)
Volume: Increased trading volume on the breakout would strengthen the bullish case.
Disclaimer:
This information is for educational purposes only and should not be considered financial advice.


Go SHORT on NaturalGas FuturesEnter at CMP - 195.6-195.0 (Jul'24 contract), with SL - 209.6 and Target1-182, Target2-156.6 & Target3-150.6. Post achieving Target3, risk takers can book half and target Final - 135, by moving SL to 159.6. If my prediction is right, it should take Target3 by 18th Jul'24 or can go till 24th Jul. July contract expiry is 26th Jul.

NATURAL GAS-Likely pull out rallyNATURAL GAS:Has sucessfully breached its horizontal trend line resistence.likely EMA Cross over suggests a move towards 202-205 with 197 SL(For educational purpose only)

Natural gas sold at 249 trail SL 206 Target 193, 184, 175 Disclaimer -
This information is only for educational purposes, this is not for any buy or sell recommendations .
On Our Harmonic pattern indicator
based trade setup take trade as explained below :-
ENTRY -
When price breaks 30% retracement Which is D points then take Entry on Buy or Sell Trade
SL -
SL is (-3%) Which is mentioned in Chart . our SL is just above or below of Recent high or Low .
TARGET -
Target 1- (T1 : 61.8 %)
Target 2- (T2 : 88.6 %)
Target 3- (T3 : 127.2 %)
Target 4- (T4 : 161.8 %)
Please note:-
It's working on news based and volitile market very well so exit if SL hit

Natural gas sell given at 249 , 203 Target hit trail SL 212Disclaimer -
This information is only for educational purposes, this is not for any buy or sell recommendations .
On Our Harmonic pattern indicator
based trade setup take trade as explained below :-
ENTRY -
When price breaks 30% retracement Which is D points then take Entry on Buy or Sell Trade
SL -
SL is (-3%) Which is mentioned in Chart . our SL is just above or below of Recent high or Low .
TARGET -
Target 1- (T1 : 61.8 %)
Target 2- (T2 : 88.6 %)
Target 3- (T3 : 127.2 %)
Target 4- (T4 : 161.8 %)
Please note:-
It's working on news based and volitile market very well so exit if SL hit

NATURALGAS WEEKLY UPDATE - JULY 1st - 5thNatural Gas Braces for Potential Rangebound Bearishness
Current Situation: Natural gas appears to be settling into a potential rangebound pattern with key levels to watch.
Support: The support level sits at 211.9. A break below this point could signal further downside movement.
Resistance: Overhead resistance is located at 220. A decisive break above this level could indicate a potential trend reversal towards the upside.
Bearish Bias: While the rangebound pattern suggests some consolidation, the overall sentiment leans bearish. This is based on (you can add specific reasons here, for example: recent price decline, technical indicators, or fundamental factors).
Selling (shorting) if the price breaks decisively below support at 211.9, with a stop-loss order placed above resistance.
Waiting for a confirmed breakout above resistance before entering long positions.
Important Considerations:
The market can be unpredictable. It's crucial to conduct your own research and utilize risk management strategies like stop-loss orders.
This information is for educational purposes only and should not be considered financial advice.

NG MCX Future Weekly Technical Chart Analysis 1-5 July, 24📈 NG MCX Future Technical Chart Analysis
📆 Weekly Levels: 1-5 July, 24
📊 Range Trigger Point: 217.80
📉 Weekly Range: 22.30
📈 Buy Above: 231.08
💼 Average Position: 228.45
🎯 Buy Target 1: 231.58
🎯 Buy Target 2: 240.10
🛑 Buyer Stoploss: 223.65
💰 Sale Below: 225.82
🎯 Sale Target 1: 204.02
🎯 Sale Target 2: 195.50
🛑 Seller Stoploss: 233.25
✨ Boost, follow, and engage for more insightful updates. For detailed analysis and live discussions, check out our community channels. Your engagement fuels our dedication to providing top-notch content! 🚀❤️
#NG #NaturalGas #GasPrices #NatGas #EnergyTrading #MCX #CommoditiesFutures #CommoditiesOptions

Natural gas near support area buy above 232 , sl recent low Disclaimer -
This information is only for educational purposes, this is not for any buy or sell recommendations .
On Our Harmonic pattern indicator
based trade setup take trade as explained below :-
ENTRY -
When price breaks 30% retracement Which is D points then take Entry on Buy or Sell Trade
SL -
SL is (-3%) Which is mentioned in Chart . our SL is just above or below of Recent high or Low .
TARGET -
Target 1- (T1 : 61.8 %)
Target 2- (T2 : 88.6 %)
Target 3- (T3 : 127.2 %)
Target 4- (T4 : 161.8 %)
Please note:-
It's working on news based and volitile market very well so exit if SL hit

Natural gas at support buy above 237 eith recent low SLDisclaimer -
This information is only for educational purposes, this is not for any buy or sell recommendations .
On Our Harmonic pattern indicator
based trade setup take trade as explained below :-
ENTRY -
When price breaks 30% retracement Which is D points then take Entry on Buy or Sell Trade
SL -
SL is (-3%) Which is mentioned in Chart . our SL is just above or below of Recent high or Low .
TARGET -
Target 1- (T1 : 61.8 %)
Target 2- (T2 : 88.6 %)
Target 3- (T3 : 127.2 %)
Target 4- (T4 : 161.8 %)
Please note:-
It's working on news based and volitile market very well so exit if SL hit

Natural Gas Update || June 25 - 26Natural Gas: Bulls Charge Above Supply Zone
Timeframe: 4 Hour
Analysis:
Natural gas is exhibiting bullish signals on the 4-hour chart. The price recently bounced from a supply zone, indicating buying pressure and a potential reversal to the upside. Additionally, a falling wedge pattern appears to be forming, which is a technical indicator that often precedes a price surge.
Key Levels:
Resistance: 235.5 (Recent bounce level)
Target: 245 (Based on the falling wedge pattern)
Support: Supply zone (Level where the price bounced from)
Stop-Loss: Place a stop-loss order below the support level (supply zone) to limit potential losses if the price falls and breaks the pattern.
Risk Management: Always remember to practice proper risk management. Only allocate a small percentage of your capital to this trade and use a stop-loss order to limit potential losses.
Confirmation: A confirmed breakout occurs when the price closes above the resistance level of $2.355 with increased trading volume.
Additional Notes: This analysis is based on technical indicators and should be used in conjunction with other fundamental and market sentiment factors.
Past performance is not necessarily indicative of future results.
Falling Wedge Pattern (Optional):
I hope this TradingView post helps!

Natural gas sell Trade active from 249 hold it Disclaimer -
This information is only for educational purposes, this is not for any buy or sell recommendations .
On Our Harmonic pattern indicator
based trade setup take trade as explained below :-
ENTRY -
When price breaks 30% retracement Which is D points then take Entry on Buy or Sell Trade
SL -
SL is (-3%) Which is mentioned in Chart . our SL is just above or below of Recent high or Low .
TARGET -
Target 1- (T1 : 61.8 %)
Target 2- (T2 : 88.6 %)
Target 3- (T3 : 127.2 %)
Target 4- (T4 : 161.8 %)
Please note:-
It's working on news based and volitile market very well so exit if SL hit

NATURALGAS UPDATE - JUNE 13th - 14thNatural Gas: Potential Short Trade Setup (Technical Analysis)
Entry: Short below 249.5 (with confirmation, e.g., price breaking below a support level)
Targets:
T1: 248 (1st profit target, 1.5 points from entry)
T2: 246 (2nd profit target, 3.5 points from entry)
Stop-Loss: 250 - 251
Risk Management:
Always remember to practice proper risk management. This strategy suggests a stop-loss placement 1.5 points above the entry point, limiting potential losses if the price reverses.

NATURALGAS UPDATE | MCX | JUNE 12 - 13th Natural Gas - Long Trade Setup
Entry: Long above 261
Targets: T1: 265
T2: 267
T3: 270
Stop-Loss: 256 -257
News Highlights:
Hotter Summer Forecast: Above-normal temperatures in the US are expected to increase natural gas demand for cooling, boosting prices.
Increased Electricity Demand: Rising electricity output suggests higher natural gas consumption by utilities, providing further bullish support.
Lower Production & Ample Supply: While production is down, inventories remain high, potentially limiting excessive price surges.
Disclaimer: This information is for educational purposes only and should not be considered financial advice. Please consult with a licensed financial professional before making any trading decisions.

Natural gas buy on dip 261 , 275+ Target support 238Disclaimer -
This information is only for educational purposes, this is not for any buy or sell recommendations .
On Our Harmonic pattern indicator
based trade setup take trade as explained below :-
Early trades Buy or sell below/ above 23.6 %, safe trades buy or sell above / below 41% , after taking trade next upside or downside levels will be target ,
When reverse buy or sell signal appear then book profit on Target or trail SL to 23.6 % If trailing SL hit then early trade can be taken above or below 23.6 and safe trade can b taken above/ below 41% ..
Please note:-
It's working on news based and volitile market very well so exit if SL hit

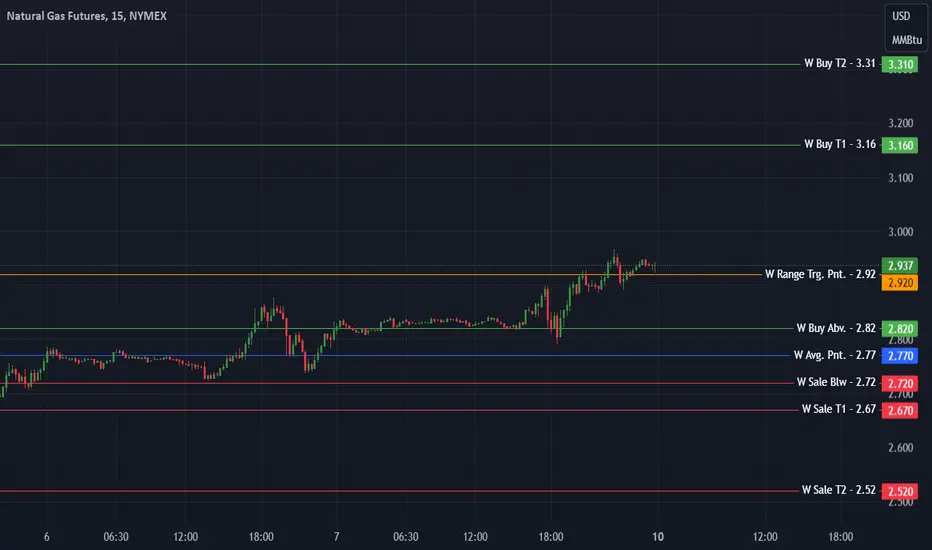
Henry Hub Natural Gas Future Weekly Analysis 10-14 June, 24📈 Henry Hub Natural Gas Future Technical Chart Analysis
📆 Weekly Levels for 10-14 June, 2024:
📊 Weekly Movement Point: 2.92
📉 Weekly Range: 0.39
📈 Buy Above: 2.82
💼 Average At: 2.77
🎯 Buy Target 1: 3.16
🎯 Buy Target 2: 3.31
🛑 Buyer Stoploss: 2.69
💰 Sale Below: 2.72
🎯 Sale Target 1: 2.67
🎯 Sale Target 2: 2.52
🛑 Seller Stoploss: 2.85
✨ Boost, follow, and engage for more insightful updates. For detailed analysis and live discussions, check out our community channels. Your engagement fuels our dedication to providing top-notch content! 🚀❤️
#HenryHub #NaturalGas #GasFutures #CommoditiesTrading #MarketAnalysis #NG #GasPrices #NatGas #EnergyTrading #MCX #CommoditiesFutures #CommoditiesOptions
Natural gas buy on dip levels mentioned on chart Disclaimer -
This information is only for educational purposes, this is not for any buy or sell recommendations .
On Our Harmonic pattern indicator
based trade setup take trade as explained below :-
Early trades Buy or sell below/ above 23.6 %, safe trades buy or sell above / below 41% , after taking trade next upside or downside levels will be target ,
When reverse buy or sell signal appear then book profit on Target or trail SL to 23.6 % If trailing SL hit then early trade can be taken above or below 23.6 and safe trade can b taken above/ below 41% ..
Please note:-
It's working on news based and volitile market very well so exit if SL hit

Natural Gas MCX Future Technical Analysis for 7 June. 24📈 NG MCX Future Technical Chart Analysis
📆 Daily Levels for 7 June, 2024:
📊 Range Point: 234.00
📉 Day Range: 12.40
📈 Buy Above: 235.56
💼 Average At: 234.10
🎯 Buy Target 1: 241.66
🎯 Buy Target 2: 246.40
🛑 Buyer Stoploss: 231.43
💰 Sale Below: 232.64
🎯 Sale Target 1: 226.34
🎯 Sale Target 2: 236.77
🛑 Seller Stoploss: 236.77
✨ Boost, follow, and engage for more insightful updates. For detailed analysis and live discussions, check out our community channels. Your engagement fuels our dedication to providing top-notch content! 🚀❤️
#NG #NaturalGas #GasPrices #NatGas #EnergyTrading #MCX #CommoditiesFutures #CommoditiesOptions

Start of Major Bull Cycle in Natural Gas ? Natural Gas has just finished its major bear correction ( ABC) after a major bull cycle (12345) as depicted on the chart. Most of the Fibonacci projection & retracement are holding true as per the rules (will publish it separately as a learning material). Also, after the ABC correction, there is sharp rise in the price. How do we plan an entry now?
The price seems to be in the minor 3rd wave of wave 1 of the major bull cycle. Lets wait for the price to retrace to about 38% fib levels (re-calculate 38% fib if it breaks today's high to find fresh 38% fib support) and then enter with a stop loss below 50% fib levels. We can ride it till the top of the wave 3 for quick intraday/swing trade.
It is headed for 280 & 300 levels in a very short span of time
Disclaimer: The above analysis is only for educational purpose. Please consult your financial advisor before taking any investment decision
