Part 4 Learn Institutional TradingAdvantages of Option Trading
Leverage:
Options allow control over large quantities of an asset with a small investment (premium). This magnifies potential profits.
Limited Risk for Buyers:
When buying options, the maximum loss is limited to the premium paid.
Hedging Capability:
Options can offset potential losses in the underlying portfolio.
Flexibility:
Options can be combined in various strategies to suit market outlooks—bullish, bearish, or neutral.
Multiple Strategies:
Options offer numerous strategies like straddles, strangles, spreads, collars, and iron condors, giving traders the ability to profit in different market conditions.
Natural Gas Futures
No trades
Trade ideas

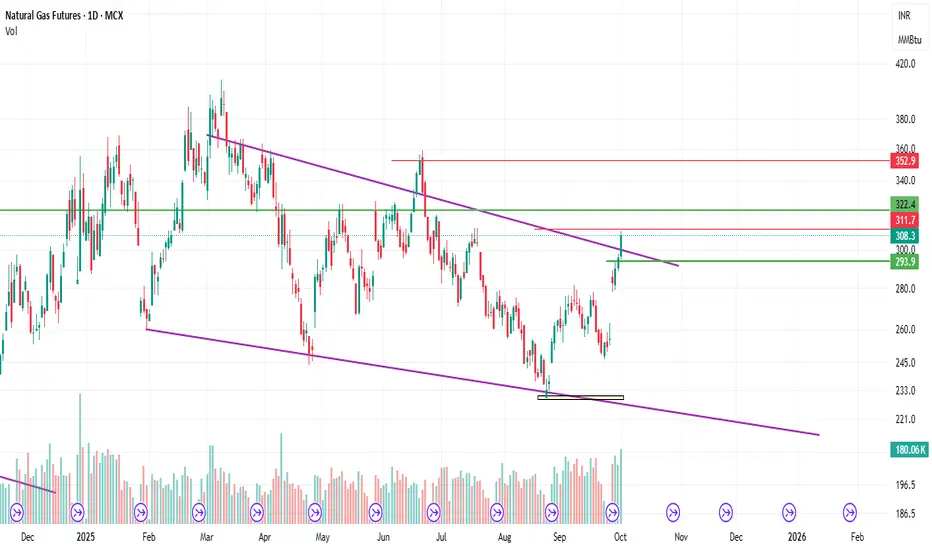
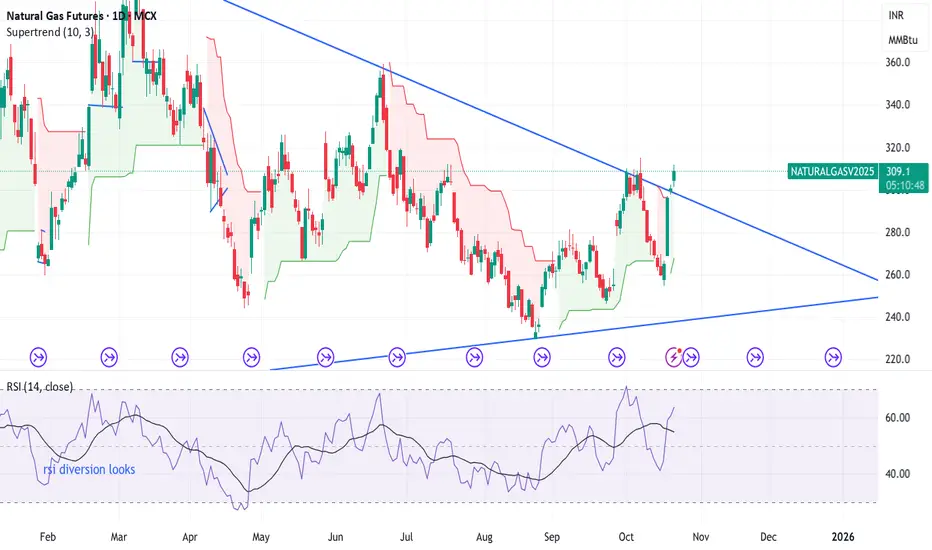
Prime area for reversalThere has been an explosive price surge that is not supported by corresponding volume, and the chart is currently near its seasonal highs. This move appears overextended, increasing the likelihood of a gap-filling correction in the near term. Traders should watch closely for signs of reversal, as initiating fresh long positions at current levels carries elevated risk.

Geopolitical Energy TradingThe Intersection of Power, Politics, and Global Markets
Energy is the lifeblood of the global economy. Every modern industry—from manufacturing and transportation to technology and agriculture—relies on steady energy supplies. Yet, energy trading is not simply a matter of market forces like supply and demand. It is deeply shaped by geopolitics—the strategic and political relationships among nations. Geopolitical energy trading refers to the global buying, selling, and movement of energy resources such as oil, gas, coal, and renewables, influenced by political decisions, regional alliances, conflicts, and national interests.
In the 21st century, as countries compete for energy security, control over resources, and technological dominance in renewables, the geopolitical stakes of energy trading have never been higher.
1. The Foundation of Geopolitical Energy Trading
Energy trading is the mechanism through which countries and corporations buy and sell energy commodities across borders. Traditional markets have been dominated by fossil fuels—crude oil, natural gas, and coal. However, as the world moves toward cleaner energy, renewable energy credits, carbon permits, and electricity are becoming new instruments of trade.
Geopolitics enters this equation because energy resources are unevenly distributed. For instance:
The Middle East holds massive oil reserves.
Russia dominates natural gas exports to Europe.
The United States has become a major exporter of LNG (liquefied natural gas) and crude oil.
China is the world’s largest energy importer and a leading investor in renewable technologies.
This imbalance of resources creates dependencies, alliances, and rivalries that shape global energy flows.
2. Oil and Geopolitics: The Old Power Game
Crude oil has long been the most geopolitically sensitive commodity. The Organization of the Petroleum Exporting Countries (OPEC), formed in 1960, was one of the first examples of nations using collective control over energy supply to influence global politics and prices.
Oil’s strategic role became clear during events such as:
The 1973 Oil Crisis, when Arab OPEC members imposed an embargo on Western nations supporting Israel, causing oil prices to quadruple.
The Iran-Iraq War (1980s) and the Gulf War (1991), which disrupted oil production and transportation.
Russia-Ukraine tensions, where energy pipelines became tools of political leverage over Europe.
Oil prices often rise during conflicts in major producing regions, as traders fear supply disruptions. In response, consuming nations build strategic petroleum reserves (SPRs) to guard against shortages.
3. Natural Gas: The New Energy Weapon
Natural gas, once considered a regional fuel due to its transportation challenges, has become a global commodity thanks to LNG technology. Pipelines and LNG terminals now connect producers and consumers across continents.
However, gas also holds strong geopolitical weight. For decades, Europe’s dependence on Russian gas shaped diplomatic relations. When Russia invaded Ukraine in 2022, it used gas supply cuts as a political tool, leading to an energy crisis in Europe. European countries had to rapidly diversify, importing LNG from the US, Qatar, and Australia.
Similarly, China has built extensive energy partnerships through its Belt and Road Initiative (BRI), investing in pipelines from Central Asia and maritime terminals across Asia and Africa. These moves aim to secure long-term energy supplies while expanding China’s geopolitical influence.
4. The Rise of Energy Independence
Geopolitical energy trading also involves efforts by countries to reduce dependency on foreign suppliers. This strategy is known as energy independence.
For example:
The United States experienced an energy revolution through shale oil and gas extraction (fracking), turning it from a major importer into an exporter.
India is investing heavily in solar and green hydrogen to reduce crude import dependence.
European nations are accelerating renewable adoption to minimize reliance on unstable regions like the Middle East and Russia.
Energy independence reshapes global trade routes and weakens traditional energy powerhouses, redistributing influence among nations.
5. Renewables and the New Geopolitics
As the world transitions toward clean energy, a new form of geopolitical competition is emerging. Instead of fighting over oil wells, countries now compete for lithium, cobalt, rare earth elements, and solar panel technology—key inputs for renewable energy systems and electric vehicles.
For instance:
China dominates over 70% of the global solar panel and battery manufacturing market.
Chile, Australia, and Bolivia hold vast lithium reserves essential for EV batteries.
Africa is becoming a crucial player due to its mineral wealth.
This creates a new type of “green geopolitics” where nations with renewable technologies and resources hold strategic leverage. Control over energy transition technologies—such as grid infrastructure, hydrogen systems, and battery supply chains—could define the next era of energy dominance.
6. Energy Trading Hubs and Routes
Energy trading also depends on strategic chokepoints and hubs that influence transportation and pricing. Some of the world’s most vital routes include:
The Strait of Hormuz (linking Persian Gulf oil to global markets)
The Suez Canal (connecting Europe and Asia)
The Malacca Strait (key route for China and East Asia)
The Panama Canal (connecting Atlantic and Pacific trade flows)
Disruptions in any of these routes—due to war, piracy, or blockades—can send shockwaves through global markets.
Major trading hubs such as Singapore, Rotterdam, Houston, and Dubai facilitate physical energy trade and derivatives trading. They serve as price benchmarks and logistics centers for global traders.
7. Political Sanctions and Market Volatility
Sanctions are one of the most powerful geopolitical tools in energy trading. When major producers like Iran, Venezuela, or Russia face international sanctions, their oil and gas exports are restricted, affecting global supply and prices.
For example:
Sanctions on Iran reduced its oil exports, tightening supply in the Asian market.
Restrictions on Russian crude and gas after 2022 reshaped global flows, with Russian energy redirected to China and India at discounted rates.
These sanctions also triggered a surge in “shadow fleets”—unregulated tankers trading sanctioned oil covertly.
Geopolitical uncertainty creates volatility, which traders exploit through derivatives like futures and options, betting on price movements influenced by political developments.
8. Role of International Organizations
Several institutions influence the global energy trade’s geopolitical balance:
OPEC+, including Russia, coordinates oil output to stabilize prices.
The International Energy Agency (IEA) advises consumer nations on energy policy and emergency stockpiles.
The World Trade Organization (WTO) and United Nations mediate energy-related disputes and environmental regulations.
COP summits set climate targets that reshape long-term energy investment patterns.
Thus, energy trading is not only an economic system but also a diplomatic and regulatory framework managed through multilateral negotiations.
9. Emerging Trends and the Road Ahead
The next decade will redefine geopolitical energy trading through several key trends:
Decarbonization Pressure: Countries are racing to meet net-zero targets, creating demand for carbon trading and green hydrogen.
Regional Energy Blocs: Alliances like the BRICS and EU Energy Union are forming to coordinate energy policy and trade.
Digital Energy Markets: Blockchain and AI-based trading platforms are making energy exchange more transparent and efficient.
Energy Storage Wars: Control over battery production and recycling will become as critical as oil reserves once were.
As energy systems become more diversified, geopolitics will revolve around technology, supply chains, and environmental diplomacy rather than just resource control.
Conclusion
Geopolitical energy trading is a complex dance between power, economics, and survival. Nations leverage energy as both a weapon and a tool of cooperation. While fossil fuels continue to dominate global trade, the rise of renewables, electric mobility, and digital infrastructure is redrawing the geopolitical map.
In this evolving landscape, countries that balance energy security, diversification, and innovation will hold the upper hand. The transition from oil-based geopolitics to a multi-energy world will not end energy rivalries—but it will transform them into a new contest over clean technologies, supply chains, and strategic influence.
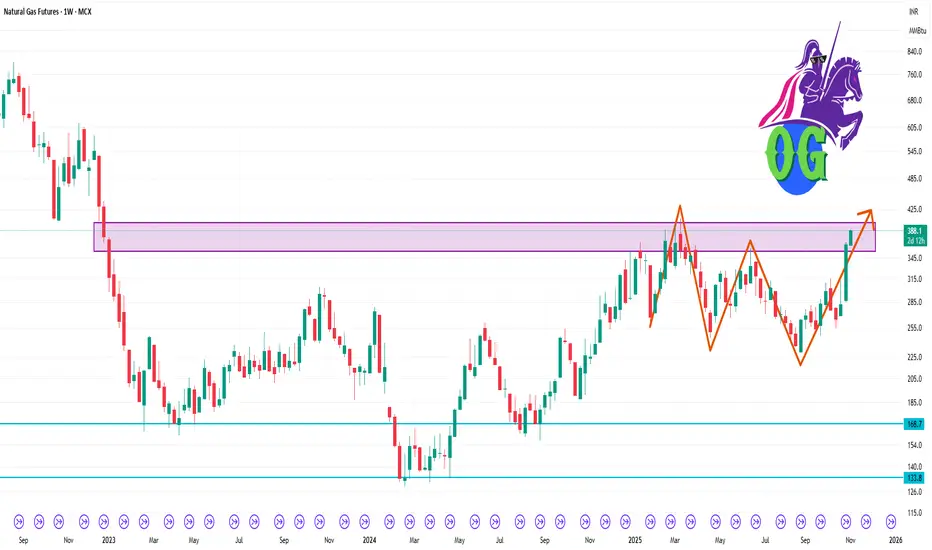
Natural Gas Futures 1 Week Time Frame 🎯 Key Levels
Support zone: ~ ₹ 270-285 per mmBtu — this appears to be a hinge demand zone based on recent pullbacks.
Intermediate support / pivot: ~ ₹ 295-310 — price has been oscillating near this zone.
Resistance zone: ~ ₹ 330-350 — breaking above this on a weekly close would shift structure more bullish.
Major breakout target: ~ ₹ 360-380 — if momentum carries, this zone becomes relevant for extension.
Natural gas updated levels 350-345 support area avoid buy at cmpNatural gas avoid buying at current price 350-345 support area
How My Harmonic pattern projection Indicator work is explained below :
Recent High or Low :
D-0% is our recent low or high
Profit booking zone ( Early / Risky entry) : D 13.2% -D 16.1 % is
range if break them profit booking start on uptrend or downtrend but only profit booking, trend not changed
SL reversal zone (Safe entry ) : SL 23.1% and SL 25.5% is reversal zone if break then trend reverse and we can take reverse trade
Target : T1, T2, T3, T4 and .
Are our Target zone
Any Upside or downside level will activate only if break 1st level then 2nd will be active if break 2nd then 3rd will be active.
Total we have 7 important level which are support and resistance area
Until , 16% not break uptrend will continue if break then profit booking will start.
If break 25% then fresh downtrend will start then T1, T2,T3 will activate
1,3,5,10,15,20 minutes are short term levels.
30 minutes 60 minutes , 2 hours,3 hours, ... 1 day and 1 week chart positional and long term levels
How to Catch Momentum Traders1. Understanding Momentum Trading
Momentum trading is based on a simple but powerful concept: “The trend is your friend.” Momentum traders look for assets that show strong upward or downward trends and enter trades expecting those moves to continue. They don’t rely much on fundamental analysis or long-term value; instead, they focus on price action, volume, and technical signals.
Momentum in markets occurs when a large number of traders and investors pile into a position, causing rapid price acceleration. This can be driven by positive earnings reports, macroeconomic news, market sentiment, or algorithmic activity. As long as the momentum persists, traders can capture substantial profits — but when it reverses, losses can be just as swift.
2. The Psychology Behind Momentum Traders
To catch momentum traders, one must first understand their psychology. Momentum traders are drawn to:
Speed: They prefer fast-moving markets.
Volatility: Higher volatility offers bigger profit potential.
Liquidity: They trade in assets where they can enter and exit easily.
Trends: They look for confirmation of existing price direction, not reversals.
They often use breakout strategies — buying when the price breaks above resistance or shorting when it falls below support. Their collective actions amplify market moves, creating self-reinforcing cycles. Recognizing this crowd behavior helps other traders anticipate momentum-driven surges or collapses.
3. Identifying Momentum Trades in Action
Catching momentum traders begins with identifying when they enter or exit markets. Certain indicators and patterns reveal their presence:
High Trading Volume: A sudden surge in volume signals institutional or retail momentum traders jumping in. Volume confirms the strength of a price move.
Breakouts: When price breaks above previous resistance levels with strong volume, it’s often the starting point of a momentum rally.
Price Acceleration: Rapid price increases or decreases without major pullbacks are typical of momentum trading.
Volatility Expansion: Momentum traders love volatility; rising average true range (ATR) often hints that they are active.
By watching these indicators, you can anticipate when momentum traders are likely entering or exiting, giving you an advantage.
4. Tools and Indicators to Catch Momentum Traders
Momentum traders rely heavily on technical indicators, and these same tools can help others catch their movements. Key ones include:
Relative Strength Index (RSI): Measures speed and change of price movements. Momentum traders often enter when RSI crosses above 50 or 70, signaling strong bullish momentum.
Moving Average Convergence Divergence (MACD): Identifies momentum shifts. A bullish crossover often indicates that momentum traders are entering.
Volume Oscillator: Highlights surges in volume that accompany price trends.
Rate of Change (ROC) and Momentum Indicators: Directly show how fast price is changing, helping identify momentum bursts.
Moving Averages (20-day or 50-day): Price consistently staying above a moving average signals continued momentum.
By monitoring these indicators in real-time, one can identify when momentum traders are likely to act — or when they might be exhausted.
5. Following the Money: Watching Institutional Flow
While many momentum traders are retail participants, large institutional players also engage in momentum strategies using algorithmic systems. To catch them, monitor order flow and market depth:
Order Book Data: Large buy or sell orders can signal where institutional momentum traders are accumulating or distributing positions.
Volume-Weighted Average Price (VWAP): Momentum traders often enter when price crosses above VWAP, showing market strength.
Dark Pool Activity: A sudden rise in dark pool trades can hint at institutional buildup before visible market momentum.
Understanding these flows can help you anticipate short-term trends before the broader market catches on.
6. Trading Strategies to Catch Momentum Traders
Once you’ve identified momentum activity, there are several ways to trade effectively around it:
A. Trade with the Momentum
This approach means joining the trend early and riding the wave. To do this:
Wait for confirmation via volume and breakout.
Use tight stop-losses to manage risk.
Scale out gradually as momentum matures.
For example, if a stock breaks above resistance with double average volume, entering shortly after confirmation can capture a strong upward move.
B. Fade the Momentum
Advanced traders sometimes trade against momentum when it looks overextended. Signs of exhaustion include:
RSI above 80 (overbought) or below 20 (oversold).
Divergence between price and momentum indicators (e.g., price rises but RSI drops).
Sharp reversal candles like shooting stars or bearish engulfing patterns.
Timing is critical; entering too early can lead to losses, as momentum can persist longer than expected.
C. Momentum Reversal Traps
Sometimes momentum traders push prices to extremes, creating opportunities for reversal setups. By waiting for false breakouts or sudden volume drop-offs, contrarian traders can profit when momentum collapses.
7. The Role of News and Sentiment
Momentum traders react swiftly to news — earnings, economic releases, political events, or even social media hype. Monitoring news feeds, Twitter sentiment, and Reddit or X (formerly Twitter) discussions can reveal where retail momentum might strike next.
Tools like Google Trends, social sentiment trackers, and alternative data feeds help anticipate “hot” assets before they explode in price. Momentum-driven rallies often start with strong emotional triggers — greed, fear, or excitement — amplified by online chatter.
8. Risk Management When Dealing with Momentum Traders
Catching momentum traders can be profitable, but it’s risky. Momentum trades reverse sharply, and being on the wrong side can cause steep losses. To manage risk:
Set stop-losses tightly to limit exposure.
Avoid chasing late moves — entering after most of the momentum has played out.
Use trailing stops to lock in profits while allowing room for trends to continue.
Diversify across assets to avoid concentrated momentum shocks.
Momentum markets can be emotional and unpredictable — discipline is essential.
9. Recognizing Momentum Exhaustion
Momentum cannot last forever. The key to catching traders is knowing when they’re about to exit. Warning signs include:
Diminishing volume after a strong run.
Price stagnation despite positive news.
Divergences in RSI or MACD indicating weakening trend strength.
Parabolic price rise followed by sharp pullbacks.
When these appear, momentum traders are likely reducing positions or reversing direction — a perfect signal for strategic counter-trades.
10. Combining Technical and Behavioral Insights
The most successful way to catch momentum traders is by merging technical analysis with behavioral understanding. Markets move not just because of charts but because of emotions — greed, fear, and herd behavior. Recognizing patterns of crowd psychology alongside price signals provides deeper insights.
For instance:
Fear-driven selling during bad news can create oversold momentum trades.
FOMO-driven rallies often signal near-term tops.
Algorithmic bursts create predictable short-term spikes.
By studying how traders react collectively, you can identify entry and exit points that align with — or exploit — momentum participants’ behavior.
Conclusion
Catching momentum traders isn’t about outsmarting them — it’s about understanding and timing them. Momentum trading shapes short-term market movements, and those who can identify when and where it happens gain a significant advantage.
The keys are:
Recognize technical signals like breakouts, volume surges, and volatility expansion.
Track order flow and institutional participation.
Manage risk carefully with stop-losses and profit-taking strategies.
Understand trader psychology — emotion fuels momentum.
In essence, markets are waves of energy created by collective behavior. Momentum traders ride those waves — and with the right tools, timing, and mindset, you can catch them before they crest or crash.
Natural Gas – Decoding the Breakout Beyond Data NoiseNatural Gas Futures – Absorbing the Bearish Data, Anticipating Winter Demand
By Chart Pathik | 31 October 2025
Market Overview
Natural Gas prices on MCX have sustained a strong upward trajectory this week, breaking out from a prolonged symmetrical triangle pattern. This price action came in despite a seemingly negative inventory update from the latest EIA data release.
The weekly Natural Gas Storage Report showed the following:
Actual build: 74B
Forecast: 71B
Previous: 87B
Ordinarily, a higher-than-expected build signals weaker demand or temporary oversupply, which should exert downward pressure on prices. However, the market response has been surprisingly resilient. Instead of declining, prices have held above the breakout zone near 347 and even hinted at a potential gap-up move toward 362.
This is a classic case of fundamental absorption — where the market absorbs short-term negative data because broader contextual drivers have turned supportive.
Fundamental Insight – Seasonal Demand Takes Control
While inventory data often drives near-term volatility, Natural Gas has now entered a phase where demand-side dynamics are beginning to dominate. Several factors are contributing to this shift:
1. Weather-Driven Demand Surge
Across multiple continents including North America, Europe, and East Asia, colder weather patterns have started earlier than expected. The onset of winter is leading to a rapid increase in heating demand, particularly from residential and power-generation segments.
2. LNG Tightness and Supply Constraints
As global LNG demand rises in winter months, shipping delays and logistical bottlenecks often emerge. These constraints can keep spot prices elevated even in weeks where storage builds appear high.
3. Energy Sector Correlation
The broader energy complex, led by Crude Oil’s recent stabilization, tends to lift sentiment for Natural Gas as well. Positive momentum in related assets usually reinforces bullish conviction in energy commodities.
4. Broader Inventory Context
Although this week’s storage build was higher than forecast, overall inventories remain below the five-year average in several key regions. The market, therefore, is not reacting to short-term excess but rather positioning for an expected tightening over the next few weeks.
The takeaway is clear: while the latest data may appear bearish in isolation, it sits within a larger bullish framework driven by seasonal demand and tightening forward supply expectations.
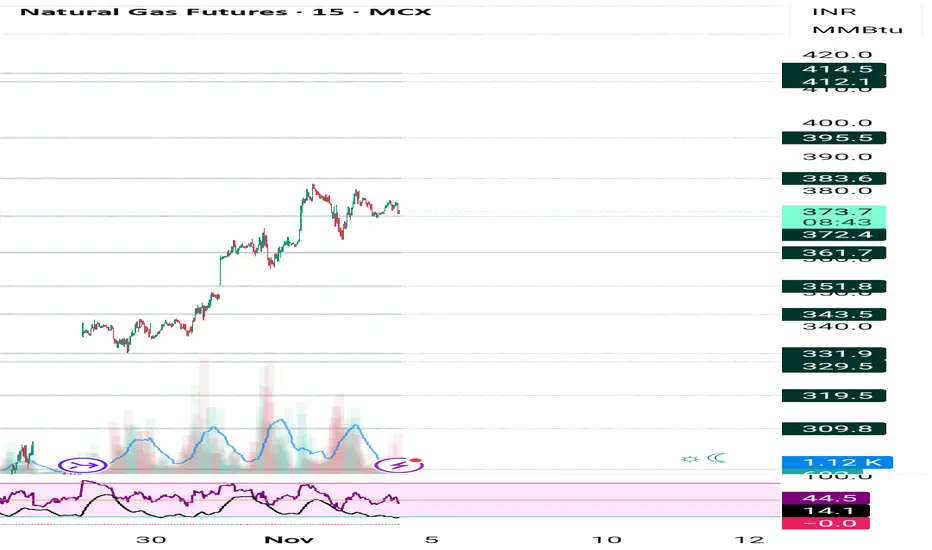
Technical Structure – Confirmed Breakout and Accumulation
The one-hour chart structure supports the bullish case. Natural Gas has broken decisively above its converging trendlines that formed the symmetrical triangle pattern. The breakout occurred with an expansion in volume, confirming genuine participation rather than speculative spikes.
Post breakout, the price retested the upper trendline successfully before resuming higher. The retest zone between 347 and 349 has now turned into immediate support. Current price action is consolidating just above this zone, suggesting controlled accumulation rather than exhaustion.
Volume analysis shows that selling activity was absorbed quickly, and the retracements came with lower volumes — a positive sign indicating that stronger hands are accumulating.
Scenario Analysis
If prices open or move above 362 and sustain, it will confirm the market’s rejection of bearish fundamentals. Such a move would likely attract momentum traders and could push prices toward the next resistance zones at 372 and 392, with positional potential up to 412.
In case prices fail to hold above 347, the breakout could temporarily invalidate, leading to a corrective move toward 336. However, considering the seasonal and fundamental backdrop, deeper declines are expected to be short-lived unless weather forecasts turn unexpectedly warmer.
Trading and Positional Perspective
For short-term traders, dips toward the breakout zone between 347 and 349 can offer favorable entry opportunities with a stop near 336. Sustaining above 357 and later 362 can lead to the next leg of the move toward 372.
Swing and positional traders may consider holding partial exposure for extended targets near 392 and 412 while progressively trailing stops as the market structure evolves.
Market Psychology and Sentiment
The most telling aspect of the current rally is its ability to rise in the face of negative data. This indicates a sentiment shift — from reacting to weekly inventory numbers to anticipating the broader winter demand story.
When price action defies data, it signals that the market is forward-looking. In this case, traders are discounting the near-term surplus and focusing on upcoming cold weather demand. The volume behavior further confirms this — showing accumulation rather than distribution.
Outlook
In the short term, the outlook for Natural Gas remains constructive as long as prices sustain above 347. Sustained trade above 362 would open the path toward 372 and beyond.
Over the next few weeks, the key drivers will be weather developments, updated storage trends, and global LNG shipping data. Any confirmation of persistent cold patterns could accelerate the rally, as physical demand aligns with the technical breakout already underway.
Chart Pathik View
Natural Gas is transitioning from a data-reactive to a narrative-driven phase. The market is positioning early for the winter demand cycle, and price behavior clearly reflects that shift.
While the weekly storage figure appears bearish on paper, the larger story is one of intelligent accumulation and forward pricing. The triangle breakout, strong retest, and volume confirmation together strengthen the bullish argument.
Above 362, the bias remains firmly upward, with the potential start of the next demand-driven rally phase.
Chart Pathik
Boost, Follow for more logical insights!

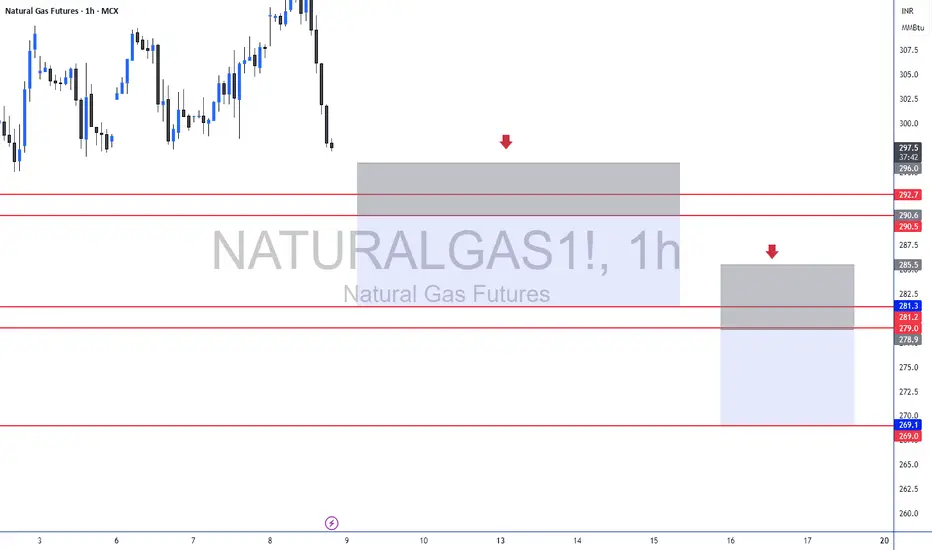
Testing Key Resistance Before Seasonal Up MovePrice is currently hovering near the top of the last resistance zone, while the rollover contract has opened slightly below it, signaling a pause after the recent rally.
If price closes below this level, a pullback toward the 3.56 support zone is likely — a healthy retest before the anticipated November weather-driven up move resumes.
Watch the 3.5 -3.6 level closely for signs of buyer re-entry and volume confirmation. A sustained hold there could mark the next leg of the seasonal bullish trend.

LONG NATURAL GAS FOR A TARGET OF 400 RSNatural Gas futures are trading around ₹280, and I remain bullish in the short to medium term. The price action suggests a likely pullback toward ₹270, which I see as a healthy correction before the next strong upside move.
Technically, Natural Gas recently broke out of a consolidation range (₹265–₹270) with solid volume support. The trend structure is forming higher highs and higher lows, while both RSI and MACD continue to support bullish momentum. Any dip near ₹270 is expected to attract fresh buying interest.
Fundamentally, tightening global supply, rising winter demand, and lower inventory levels in key regions add further strength to the bullish case. The energy sector as a whole is also seeing renewed investor interest.
I expect the price to retest ₹270 before rallying toward a final target of ₹399 over the next few weeks. As long as prices hold above ₹260 on a closing basis, the broader trend remains positive.
Strategy: Buy near ₹270 | Target: ₹399 | Stop-Loss: ₹259

Naturalgas buy given at 265 booked at 310 ,275-270 possible Natural gas buy recommended ner 265 , we booked profit at 310 , more fall possible from cmp 275-270
How My Harmonic pattern projection Indicator work is explained below :
Recent High or Low :
D-0% is our recent low or high
Profit booking zone ( Early / Risky entry) : D 13.2% -D 16.1 % is
range if break them profit booking start on uptrend or downtrend but only profit booking, trend not changed
SL reversal zone (Safe entry ) : SL 23.1% and SL 25.5% is reversal zone if break then trend reverse and we can take reverse trade
Target : T1, T2, T3, T4 and .
Are our Target zone
Any Upside or downside level will activate only if break 1st level then 2nd will be active if break 2nd then 3rd will be active.
Total we have 7 important level which are support and resistance area
Until , 16% not break uptrend will continue if break then profit booking will start.
If break 25% then fresh downtrend will start then T1, T2,T3 will activate
1,3,5,10,15,20 minutes are short term levels.
30 minutes 60 minutes , 2 hours,3 hours, ... 1 day and 1 week chart positional and long term levels

natural mcx update after triangle breakout mcx natural gas triangle breakout ------- on daily chart seen clear break triangle pattern or now looks prices up side till 330--345--360++++ very soon here .
trading ideas---- aggressive trader can buy with closing base sl 298 or let see where lvl to move
Part 12 Trading Master ClassBenefits and Risks of Option Trading
Option trading offers numerous benefits—flexibility, hedging ability, leverage, and strategic variety. Traders can profit in any market direction or even from sideways movements. Yet, risks are equally significant. Buyers risk losing the entire premium, while option sellers face unlimited potential losses if markets move sharply against them. Time decay, volatility shifts, and poor execution can quickly erode profits. Hence, knowledge, discipline, and strategy are key. Traders must use options not just for gambling but as instruments of structured risk management and profit optimization, aligning every trade with a clear plan and market understanding.

Natural gas maximum downside done start buy on dip near low Natural gas start buying on dip near recent low SL 155- upside 280-295, 310
How My Harmonic pattern projection Indicator work is explained below :
Recent High or Low :
D-0% is our recent low or high
Profit booking zone ( Early / Risky entry) : D 13.2% -D 16.1 % is
range if break them profit booking start on uptrend or downtrend but only profit booking, trend not changed
SL reversal zone (Safe entry ) : SL 23.1% and SL 25.5% is reversal zone if break then trend reverse and we can take reverse trade
Target : T1, T2, T3, T4 and .
Are our Target zone
Any Upside or downside level will activate only if break 1st level then 2nd will be active if break 2nd then 3rd will be active.
Total we have 7 important level which are support and resistance area
Until , 16% not break uptrend will continue if break then profit booking will start.
If break 25% then fresh downtrend will start then T1, T2,T3 will activate
1,3,5,10,15,20 minutes are short term levels.
30 minutes 60 minutes , 2 hours,3 hours, ... 1 day and 1 week chart positional and long term levels

Divergence Secrets Option Premium Components
The option premium (price) has two parts:
Intrinsic Value: The actual value if exercised now (difference between stock price and strike price).
Time Value: The extra amount traders pay for the potential of future movement before expiry.
As expiry approaches, time value decreases, a phenomenon known as time decay (Theta).


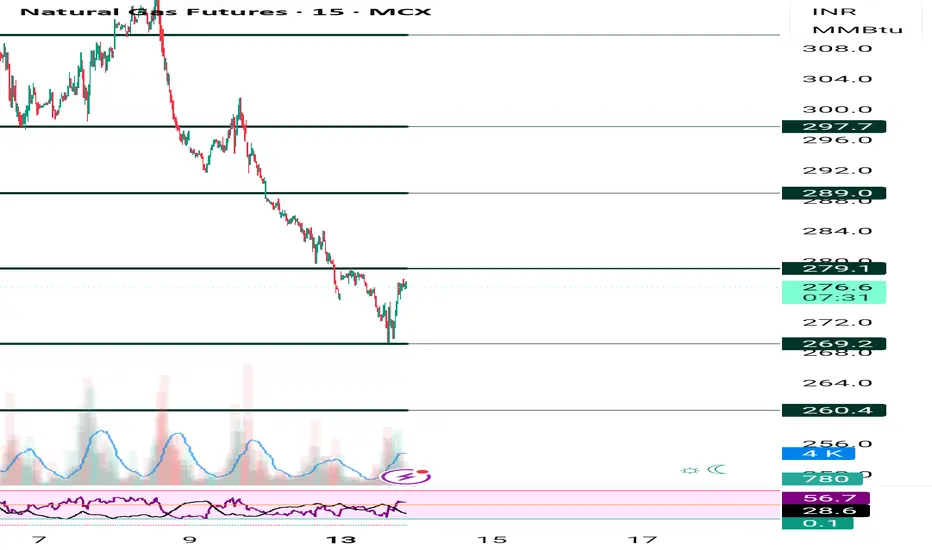
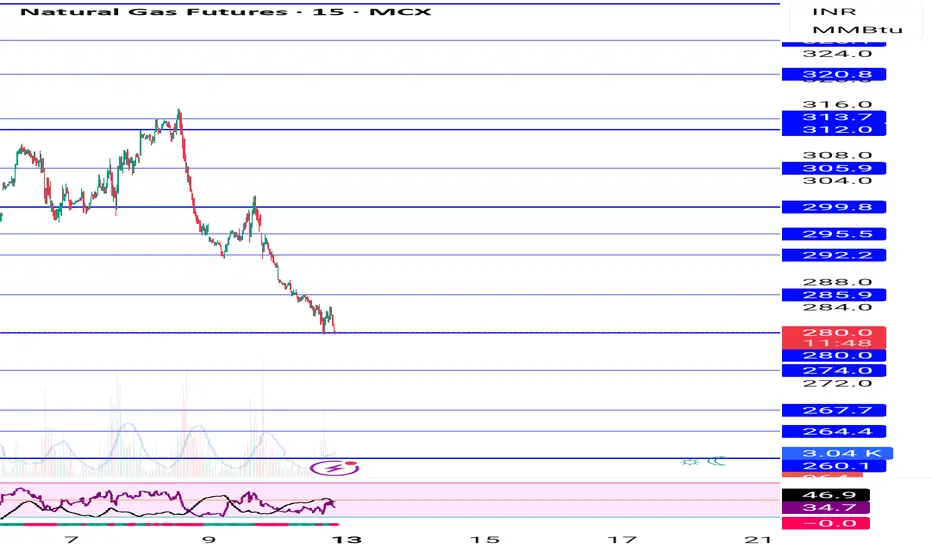
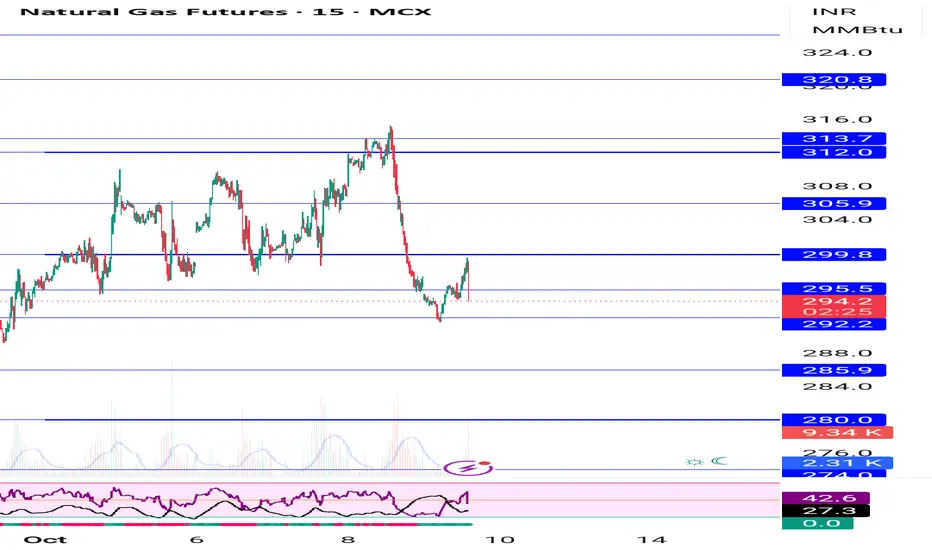
Natural gas as said yesterday more fall pending, bounce come Natural gas as said yesterday more fall possible 269 near come the. Bounce from support, start buying on dip near 270 -268
How My Harmonic pattern projection Indicator work is explained below :
Recent High or Low :
D-0% is our recent low or high
Profit booking zone ( Early / Risky entry) : D 13.2% -D 16.1 % is
range if break them profit booking start on uptrend or downtrend but only profit booking, trend not changed
SL reversal zone (Safe entry ) : SL 23.1% and SL 25.5% is reversal zone if break then trend reverse and we can take reverse trade
Target : T1, T2, T3, T4 and .
Are our Target zone
Any Upside or downside level will activate only if break 1st level then 2nd will be active if break 2nd then 3rd will be active.
Total we have 7 important level which are support and resistance area
Until , 16% not break uptrend will continue if break then profit booking will start.
If break 25% then fresh downtrend will start then T1, T2,T3 will activate
1,3,5,10,15,20 minutes are short term levels.
30 minutes 60 minutes , 2 hours,3 hours, ... 1 day and 1 week chart positional and long term levels
ESG Investing and Carbon Credit Trading1. Understanding ESG Investing
1.1 Definition of ESG Investing
ESG investing refers to investment strategies that incorporate environmental, social, and governance factors into the analysis of companies and assets. Rather than solely focusing on financial returns, ESG investing evaluates:
Environmental (E): A company’s impact on the natural environment, including carbon emissions, waste management, water usage, and energy efficiency.
Social (S): The company’s relationships with employees, suppliers, customers, and communities. It includes labor standards, diversity and inclusion, community engagement, and human rights.
Governance (G): Corporate governance practices such as board structure, executive compensation, shareholder rights, transparency, and ethical business conduct.
ESG investing can take several forms, such as negative screening (excluding companies that harm society or the environment), positive screening (investing in companies with strong ESG practices), or impact investing (targeting investments that generate measurable social or environmental benefits alongside financial returns).
1.2 Evolution and Global Adoption
ESG investing gained traction in the early 2000s, influenced by growing awareness of climate change, social inequality, and corporate scandals. Key drivers include:
Regulatory pressures: Governments and regulatory bodies worldwide now require companies to disclose ESG risks and sustainability reporting.
Investor demand: Institutional investors, such as pension funds and sovereign wealth funds, increasingly prioritize ESG to mitigate long-term risks.
Corporate accountability: Companies with strong ESG profiles often demonstrate resilience, lower regulatory risks, and better operational efficiency.
The market for ESG investments has expanded exponentially. According to the Global Sustainable Investment Alliance (GSIA), sustainable investment assets exceeded $35 trillion globally in 2023, representing over 36% of total professionally managed assets.
1.3 ESG Investment Strategies
Negative Screening: Avoiding investments in sectors such as tobacco, fossil fuels, weapons, or companies with poor labor practices.
Positive Screening: Selecting companies with best-in-class ESG performance, e.g., renewable energy companies or firms with exemplary governance practices.
Thematic Investing: Focusing on specific sustainability themes like clean energy, water management, or gender equality.
Impact Investing: Targeting investments that generate measurable social or environmental impact in addition to financial returns.
ESG Integration: Incorporating ESG factors into traditional financial analysis to enhance risk-adjusted returns.
1.4 Benefits of ESG Investing
Risk Mitigation: ESG-focused companies are less prone to environmental liabilities, regulatory penalties, and reputational damage.
Long-term Value Creation: Sustainable practices often translate into operational efficiency, customer loyalty, and innovation.
Enhanced Portfolio Diversification: ESG investments may have lower correlations with traditional financial markets.
Alignment with Values: Investors can support ethical and sustainable business practices.
1.5 Challenges in ESG Investing
Data Inconsistency: ESG reporting standards vary across regions and companies, making comparisons difficult.
Greenwashing: Companies may exaggerate their ESG efforts to attract investment without meaningful impact.
Financial Trade-offs: Some ESG investments may underperform in the short term due to higher costs or niche markets.
Measurement Complexity: Quantifying social and governance impact is often subjective.
2. Carbon Credit Trading: An Overview
2.1 Definition and Concept
Carbon credit trading is a market-based mechanism aimed at reducing global carbon emissions. It operates under the principle of cap-and-trade, where a regulatory authority sets a limit (cap) on the total greenhouse gas emissions allowed for companies or sectors. Entities are issued carbon credits representing the right to emit one metric ton of CO2 or equivalent greenhouse gases.
If a company emits less than its allocated credits, it can sell the surplus in the carbon market. Conversely, companies that exceed their limits must purchase additional credits or face penalties. This creates a financial incentive to reduce emissions efficiently.
2.2 Historical Context
Carbon trading emerged from global climate agreements:
Kyoto Protocol (1997): Introduced the Clean Development Mechanism (CDM), allowing emission reductions to be traded internationally.
European Union Emission Trading Scheme (EU ETS, 2005): The first major regional carbon market, setting a benchmark for emissions trading globally.
Paris Agreement (2015): Reinforced carbon markets under Article 6, encouraging countries to collaborate in emission reductions.
2.3 Types of Carbon Credits
Compliance Credits: Issued under government-regulated cap-and-trade programs.
Voluntary Carbon Credits: Bought by companies or individuals to offset emissions voluntarily, often through projects like reforestation, renewable energy, or methane capture.
2.4 Mechanism of Carbon Trading
Cap Setting: Authorities determine the total allowable emissions for sectors or companies.
Credit Allocation: Companies receive carbon credits based on past emissions or regulatory quotas.
Trading: Companies can buy or sell credits depending on their actual emissions relative to their cap.
Verification: Third-party audits ensure reported emissions reductions are accurate and credible.
2.5 Market Participants
Corporations: Major emitters such as power plants, airlines, and industrial manufacturers.
Brokers and Traders: Facilitate buying and selling of carbon credits.
Governments and Regulatory Bodies: Establish rules, issue credits, and monitor compliance.
Environmental Projects: Generate carbon credits by implementing emission-reducing projects.
3. Integration of ESG Investing and Carbon Credit Trading
3.1 ESG and Carbon Markets Synergy
ESG investing and carbon credit trading are inherently linked, particularly through the environmental component. Companies with robust ESG strategies often engage in carbon credit trading to:
Offset unavoidable emissions.
Demonstrate commitment to climate targets.
Improve sustainability credentials for investors.
Investors increasingly assess carbon strategies as part of ESG due diligence. Companies actively participating in carbon markets may be more attractive for ESG-focused portfolios, aligning financial performance with sustainability outcomes.
3.2 Financial Implications
Hedging Climate Risk: By investing in companies that trade carbon credits or adopt low-carbon practices, investors reduce exposure to regulatory or reputational risks.
Revenue Generation: Selling surplus carbon credits provides an additional income stream.
Valuation Impact: Firms with effective carbon management often enjoy higher valuations and lower cost of capital.
3.3 Case Examples
Microsoft: Pledged to become carbon negative by 2030, investing in carbon credits and renewable projects.
Tesla: Generates revenue by selling regulatory carbon credits to other automakers.
BP and Shell: Invest in carbon offset projects to complement ESG commitments and mitigate emissions.
4. Global Trends in ESG and Carbon Markets
4.1 Rising Investor Awareness
ESG investment products, including mutual funds, ETFs, and green bonds, are growing rapidly.
Millennials and Gen Z investors prioritize sustainability, influencing capital flows.
4.2 Regulatory Push
The EU, UK, and US are tightening ESG disclosure requirements.
Mandatory reporting on Scope 1, 2, and 3 emissions enhances transparency and accountability.
4.3 Technological Innovations
Blockchain and digital registries improve the traceability of carbon credits.
Artificial intelligence helps analyze ESG data and monitor compliance.
4.4 Market Growth
The global voluntary carbon market is expected to exceed $50 billion by 2030.
ESG assets under management are projected to surpass $50 trillion by 2025, highlighting a long-term trend toward sustainability-focused finance.
5. Challenges and Criticisms
5.1 ESG Investing Challenges
Subjectivity: ESG ratings vary across agencies, leading to inconsistent assessments.
Greenwashing Risk: Companies may overstate sustainability achievements to attract capital.
Limited Impact: Some ESG investments may not translate into measurable environmental or social improvements.
5.2 Carbon Credit Trading Challenges
Verification Complexity: Ensuring credits correspond to real emission reductions is challenging.
Market Volatility: Carbon prices fluctuate due to regulatory changes or market sentiment.
Ethical Concerns: Over-reliance on offsets can allow continued emissions instead of driving systemic change.
6. Future Outlook
6.1 ESG Investing
ESG integration will become standard practice for asset managers and institutional investors.
Enhanced global ESG reporting standards, such as the International Sustainability Standards Board (ISSB), will improve transparency.
6.2 Carbon Credit Trading
Expansion of voluntary and compliance markets is expected, particularly in Asia-Pacific.
Innovations like nature-based carbon credits and digital carbon registries will enhance credibility and efficiency.
Carbon pricing may become more widespread, influencing corporate strategy and investment decisions.
6.3 Combined Impact
The synergy between ESG investing and carbon credit trading can accelerate the transition to a low-carbon economy. Financial markets will increasingly reward companies that embed sustainability into strategy and operations, making environmental stewardship a core value driver.
Conclusion
ESG investing and carbon credit trading represent transformative trends in global finance, emphasizing the integration of sustainability into investment decisions. ESG investing aligns financial returns with environmental and social responsibility, while carbon credit trading provides a market-driven mechanism for reducing greenhouse gas emissions. Both are critical tools in addressing climate change, promoting corporate accountability, and meeting the growing demand for sustainable investments.
Despite challenges such as data inconsistency, greenwashing, and verification complexities, the long-term outlook remains positive. As regulatory frameworks strengthen, technology improves, and investor awareness rises, ESG investing and carbon credit markets are poised to redefine the role of finance in building a sustainable, resilient global economy.
The interconnection of ESG and carbon trading illustrates a broader shift: capital is no longer just a means of generating profit; it is a lever for societal and environmental impact. Investors, corporations, and policymakers who embrace this integrated approach will shape the future of finance and the health of the planet.

Natural gas bounce possible from current price limited fall leftNatural gas will take support near 270-265 avoid sell at current price
How My Harmonic pattern projection Indicator work is explained below :
Recent High or Low :
D-0% is our recent low or high
Profit booking zone ( Early / Risky entry) : D 13.2% -D 16.1 % is
range if break them profit booking start on uptrend or downtrend but only profit booking, trend not changed
SL reversal zone (Safe entry ) : SL 23.1% and SL 25.5% is reversal zone if break then trend reverse and we can take reverse trade
Target : T1, T2, T3, T4 and .
Are our Target zone
Any Upside or downside level will activate only if break 1st level then 2nd will be active if break 2nd then 3rd will be active.
Total we have 7 important level which are support and resistance area
Until , 16% not break uptrend will continue if break then profit booking will start.
If break 25% then fresh downtrend will start then T1, T2,T3 will activate
1,3,5,10,15,20 minutes are short term levels.
30 minutes 60 minutes , 2 hours,3 hours, ... 1 day and 1 week chart positional and long term levels
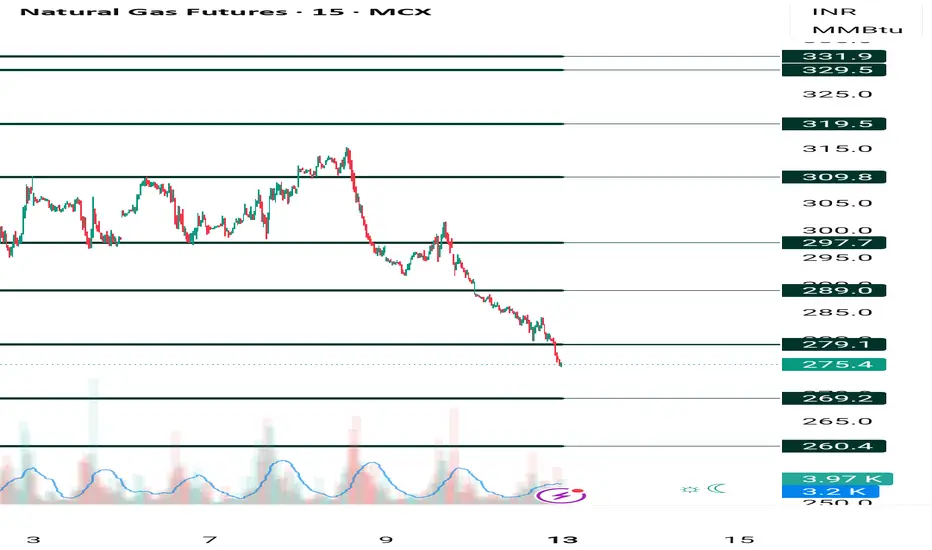
Natural gas as said yesterday more fall pending today done 275Natural gas yesterday said more fall pending today same is done , levels given on chart
How My Harmonic pattern projection Indicator work is explained below :
Recent High or Low :
D-0% is our recent low or high
Profit booking zone ( Early / Risky entry) : D 13.2% -D 16.1 % is
range if break them profit booking start on uptrend or downtrend but only profit booking, trend not changed
SL reversal zone (Safe entry ) : SL 23.1% and SL 25.5% is reversal zone if break then trend reverse and we can take reverse trade
Target : T1, T2, T3, T4 and .
Are our Target zone
Any Upside or downside level will activate only if break 1st level then 2nd will be active if break 2nd then 3rd will be active.
Total we have 7 important level which are support and resistance area
Until , 16% not break uptrend will continue if break then profit booking will start.
If break 25% then fresh downtrend will start then T1, T2,T3 will activate
1,3,5,10,15,20 minutes are short term levels.
30 minutes 60 minutes , 2 hours,3 hours, ... 1 day and 1 week chart positional and long term levels
Natural gas yesterday booked at 312 now Wait for inventory dataNatural gas wait for inventory data then take fresh buy avoid sell
How My Harmonic pattern projection Indicator work is explained below :
Recent High or Low :
D-0% is our recent low or high
Profit booking zone ( Early / Risky entry) : D 13.2% -D 16.1 % is
range if break them profit booking start on uptrend or downtrend but only profit booking, trend not changed
SL reversal zone (Safe entry ) : SL 23.1% and SL 25.5% is reversal zone if break then trend reverse and we can take reverse trade
Target : T1, T2, T3, T4 and .
Are our Target zone
Any Upside or downside level will activate only if break 1st level then 2nd will be active if break 2nd then 3rd will be active.
Total we have 7 important level which are support and resistance area
Until , 16% not break uptrend will continue if break then profit booking will start.
If break 25% then fresh downtrend will start then T1, T2,T3 will activate
1,3,5,10,15,20 minutes are short term levels.
30 minutes 60 minutes , 2 hours,3 hours, ... 1 day and 1 week chart positional and long term levels
Natural Gas Levels For October 2025Important support and Resistance Levels For Natural Gas.
When Market touches the level, the price action plays important roles.
For More Learning Reach out to us.
Natural gas continuesly buying recommended from 245 -242 levelsNatural gas continuesly buying recommended from 245-242 levels upside level given on chart until 295 not break upmove will continue
How My Harmonic pattern projection Indicator work is explained below :
Recent High or Low :
D-0% is our recent low or high
Profit booking zone ( Early / Risky entry) : D 13.2% -D 16.1 % is
range if break them profit booking start on uptrend or downtrend but only profit booking, trend not changed
SL reversal zone (Safe entry ) : SL 23.1% and SL 25.5% is reversal zone if break then trend reverse and we can take reverse trade
Target : T1, T2, T3, T4 and .
Are our Target zone
Any Upside or downside level will activate only if break 1st level then 2nd will be active if break 2nd then 3rd will be active.
Total we have 7 important level which are support and resistance area
Until , 16% not break uptrend will continue if break then profit booking will start.
If break 25% then fresh downtrend will start then T1, T2,T3 will activate
1,3,5,10,15,20 minutes are short term levels.
30 minutes 60 minutes , 2 hours,3 hours, ... 1 day and 1 week chart positional and long term levels

natural gas natural gas moving toward forward not ideal place to buy buy option near 295-298 . trg upto 352
sl 272 .