New Zealand Dollar/Australian Dollar
No trades
What traders are saying

AUDNZD just touched a sensitive areaThe AUDNZD pair is currently testing a highly sensitive zone that has historically acted as a powerful springboard for price action. We are at a "make or break" junction, watch these levels closely!
1. If the price successfully holds its ground and continues to trade above 1.1565, the historical demand will likely confirm a fresh leg up.
Target: 🎯 1.1620
Sentiment: Strong recovery potential as bulls defend the zone.
2. If the demand fails to hold and we see a slide below 1.1539, the structural narrative shifts. A breach here suggests the sellers have taken control of the trend.
Target: 🎯 1.1467
Sentiment: Potential for a rapid acceleration toward deeper support.
Confirm the move using volumes !

AUD NZDTechnically, the AUD/NZD has shown a strong bullish trend, forming higher highs and higher lows, with recent price action bouncing from key support levels and an established ascending trendline, suggesting buyers remain in control. While short-term overbought conditions may suggest a minor pullback is possible, the overall market structure indicates potential for further upside continuation, making the current levels attractive entry points for a long position targeting previous highs.

AUDNZD - OVERBOUGHT CONDITIONS HINTING AT A POSSIBLE REVERSALSymbol - AUDNZD
CMP - 1.1485
AUDNZD continues to maintain its upward trajectory, supported by fundamental divergence between the two economies. The Australian dollar remains resilient and continues to outperform the New Zealand dollar after the RBNZ implemented an aggressive 50 basis point rate cut, lowering the official cash rate to 2.5%, while the RBA remains on hold due to rising inflation concerns.
Today's move is primarily driven by the Reserve Bank of Australia’s hawkish stance, which has further fueled AUD strength. The pair has been rallying consistently without any meaningful pullbacks or retracements, and several technical indicators are now signaling potential exhaustion within the current uptrend.
A reversal setup may emerge if price action begins to show rejection patterns near key resistance zones, offering short opportunities with favorable risk-to-reward potential.
Resistance levels: 1.1485, 1.1500
Support levels: 1.1427, 1.1378
However at the same time, Keep in mind that If any further hawkish commentary or policy action emerges from the RBA, it could reinforce AUD’s strength, leading to additional upside in AUDNZD before any significant correction unfolds.

AUD/NZD Nearing Peak: Expect Controlled PullbackAUD/NZD has completed a clean 5-wave impulsive move to the upside, finishing Wave (1)/(A) near the recent peak. From here, the price looks ready to start a deeper correction in the form of Wave (2)/(B), which may pull back toward the lower support zone inside the rising channel. This corrective move could unfold in multiple legs before turning bullish again. Once Wave (2)/(B) completes, the chart expects a strong rally into Wave (3)/(C), aiming for new highs. In simple terms: a healthy pullback first, then a powerful upside continuation.
Stay tuned!
@Money_Dictators
Thank you :)

AUDNZD - READY FOR A REVERSAL?Symbol - AUDNZD
CMP - 1.14180
AUDNZD continues to maintain its upward trajectory, supported by fundamental divergence between the two economies. The Australian dollar remains resilient and continues to outperform the New Zealand dollar after the RBNZ implemented an aggressive 50 basis point rate cut, lowering the official cash rate to 2.5% - the lowest level in over three years. The central bank also signaled a willingness to ease further as the domestic economy continues to struggle.
Despite this fundamental backdrop favoring the Australian dollar, the currency pair is showing signs of exhaustion in its bullish momentum and now appears poised for a corrective phase. Selling pressure is becoming evident at higher levels, and if this activity intensifies, AUDNZD could transition into a deeper correction in the near term.
Resistance levels: 1.1430, 1.1455, 1.1472
Support levels: 1.1387, 1.1350
While the overall trend remains upward, the near-term bias has turned bearish as momentum wanes. However, if buyers manage to defend key support levels and regain control, a renewed cycle of bullish momentum may emerge - potentially extending toward higher resistance levels before a broader reversal unfolds.
AUDNZD – Intraday Short Setup🟢 AUDNZD – Intraday Short Setup
🔹 Timeframe: 15 min
🔹 Setup Type: Rally-Base-Drop (Supply Zone Rejection)
🔹 Entry Zone: 1.1333 – 1.1344
🔹 Stop Loss: Above 1.1345
🔹 Target: 1.1290 (1:3 RR)
🔹 Market Structure: Lower high forming with bearish momentum continuation
💡 Analysis Insight:
Price tapped into the identified supply zone and showed rejection wicks. Expecting short-term bearish move towards the previous low zone around 1.1290.
📉 Bias: Bearish until 1.1345 breaks cleanly.
📅 Date: 6 Oct 2025

AUDNZD – Bearish Setup (H1 Chart)📊 AUDNZD – Bearish Setup (H1 Chart)
Pair: AUDNZD
Timeframe: 1H
Bias: Short Position
🔎 Market Context:
Price has been in a downtrend, forming lower highs and lower lows.
A key resistance zone (1.14016 – 1.14272) is identified where sellers may take control again.
Current price action is showing weakness, suggesting a potential continuation to the downside.
📌 Trade Plan:
Entry Zone: 1.14016 – 1.14272
Stop Loss (SL): Above 1.14272
Take Profit (TP): 1.13156 (previous support / liquidity area)
⚖️ Risk-Reward (RR):
Approx 1:3, aligning with my weekly trading plan.
📅 Setup valid for Oct 6 – Oct 10, 2025
⚠️ Disclaimer: This post is for educational purposes only, not financial advice. Always manage your risk properly before trading.

AUDNZD Trading Idea – Momentum & Liquidity OutlookThe pair has been in a clear expansion phase, showing strength after multiple structure breaks. Momentum has favored the upside, while recent consolidation reflects market participants taking profits and rebalancing orders.
A corrective wave appears to be unfolding, which is typical after strong impulsive moves. Such phases often allow liquidity collection before the next directional expansion. The broader sentiment suggests that buyers are still active, but short-term volatility may create temporary pullbacks.
Educational Note: Markets move in cycles of impulse and correction. Recognizing these phases helps traders avoid chasing moves and instead prepare for continuation opportunities once the correction stabilizes.

AUDNZD Buy or Sell? AUDNZD tapped into the 4H Supply zone I’ve been monitoring for some time. On Friday, we also saw a bearish structure flip on the 15-minute timeframe — a potential signal that price may break the current demand zone and shift structure to the downside.
I didn't take any positions on Friday, but going into this week, my focus will be on the 4H Demand Zone for possible long opportunities. I’ll be watching how price reacts there — if we get bullish confirmation, I’ll consider a long setup.
For now, shorts don’t offer a favorable R:R, so I’ll remain on the sidelines unless demand breaks. If that happens, I’ll take the same approach, watching for clean structure and new entry zones.
Patience until the market reveals what it wants to do next.

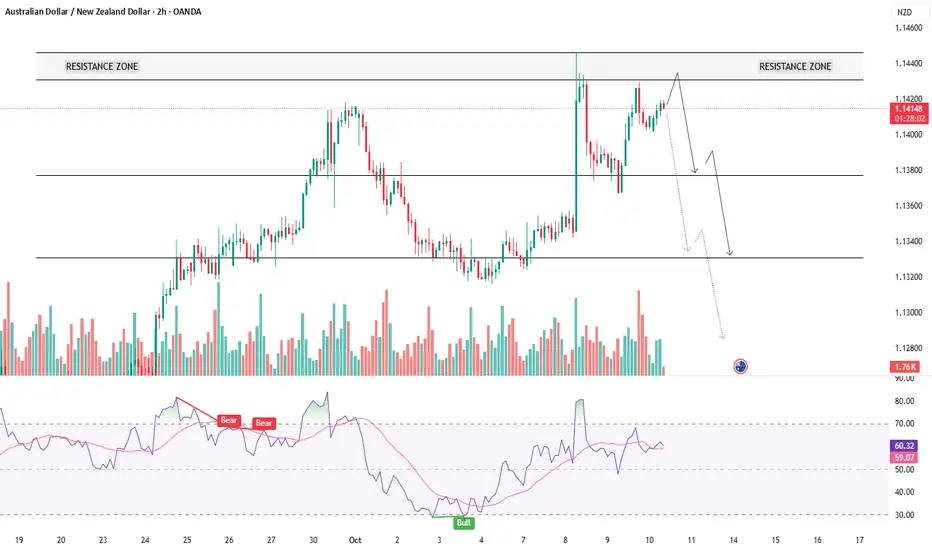
AUDNZD 2H Chart Analysis – Trendline Break + Supply Zone Rejecti🧾 Market Context:
Pair: AUDNZD
Timeframe: 2H (2-Hour)
Overall Bias: Bearish
Setup Type: Trendline Break → Lower High Formation → Supply Zone Retest → Bearish Continuation
📊 Technical Breakdown:
🔸 1. Trendline Break:
A steep ascending trendline has been broken decisively, marking a clear end of bullish structure.
This shift indicates that buyers have lost control and bears are stepping in.
🔸 2. Retest of Supply Zone (Breaker Block):
After breaking the trendline, price retraced into a supply zone (highlighted in grey).
This zone also acts as a breaker block – price broke support, and now it’s acting as resistance.
Rejection from this area confirms institutional selling pressure.
🔸 3. Lower High Formation:
The price failed to break back above the supply zone, forming a lower high, which is a classic bearish market structure signal.
Trendline retest + supply zone rejection together give confluence.
🔸 4. Bearish Projection Path:
Your chart outlines a clear path of expected price movement:
Minor bounce from intermediate demand (1.0780–1.0790)
Continuation downward toward final target zone at 1.0650–1.0660
🔽 Entry & Trade Plan:
Parameter Details
Entry Area 1.0820 – 1.0840 (confirmed rejection)
Stop Loss Above 1.0855 (above the supply zone high)
Target 1 1.0770 – 1.0780 (intermediate demand zone)
Target 2 1.0650 – 1.0660 (major demand zone)
RR Ratio Around 1:3 to 1:4 depending on entry
✅ Bearish Confluences:
✅ Trendline break + retest
✅ Supply zone rejection
✅ Lower high formation
✅ Bearish engulfing candle post-retest
✅ Clear break of structure (BOS)
✅ Liquidity sweep above previous high before dumping
⚠️ Invalidation Criteria:
If price closes above 1.0855 on a 2H/4H candle, it invalidates the bearish setup.
In that case, reanalyze for potential continuation or false breakout.
📈 Visualization Path:
🔹 Current price is consolidating slightly below the retest zone.
🔹 You anticipate a drop to intermediate support, possible small bounce, then continuation to major target.
🧠 Professional Summary:
This is a textbook bearish trend reversal setup:
Break of bullish trendline
Supply zone retest and rejection
Structure shift to lower lows/lower highs
Bearish order flow developing
If momentum follows through, your TP at 1.0650 is very realistic.

Watch This Wedge! AUDNZD Primed for Upside PushThe AUDNZD pair forms a falling wedge pattern, a bullish reversal formation that typically occurs after a downtrend. The price action is being squeezed between a descending resistance line and a descending support line, creating a narrowing range. The market is now attempting to break out of the wedge, with the current price testing the resistance line. A breakout and close above this trendline would signal bullish strength and could lead to a reversal of the recent downtrend.
Targets:
TP1: 1.07605
TP2: 1.07922
Stop Loss: Below the recent low at 1.06542

Risk for AUD/NZD: What's Priced in? Standard Chartered economists see upside risk for AUD/NZD at current levels, especially if the RBA delivers a hawkish hold at its February meeting.
They note that the RBA-RBNZ rate differential, currently at 50bps, could widen further, supporting AUD/NZD above 1.11. A decision to keep rates unchanged could surprise markets, pushing AUD/USD even higher.
If the RBA signals fewer or smaller cuts ahead—a "hawkish cut"—AUD/NZD could move beyond 1.122. Meanwhile, RSI suggests buyers are gaining momentum, with room to climb before reaching overbought levels.

AUD/NZD 15-Minute Chart AnalysisKey Observations:
1. Trendline Break:
- The price broke below the ascending trendline, signaling a potential bearish shift in momentum.
2. Resistance Zone:
- The price is trading below the highlighted resistance zone (1.10560–1.10600) and retested it, confirming it as a potential supply area.
3. Bearish Setup:
- A short trade setup is active, with the stop-loss placed above 1.10755 and take-profit targets at key support levels near 1.10446,1.10314 and 1.10025.
---
Trading Scenarios:
1. Bearish Continuation:
- If the price breaks below the first target level (1.10446), it could head toward the next support zone at 1.10314.
- A sustained bearish momentum could even target 1.10025.
2. Invalidation of Bearish Setup:
- If the price closes strongly above 1.10755, the bearish setup will likely be invalidated, and the trend could turn bullish.
---
Trading Plan:
- Entry (Sell): Below 1.10560
- Targets: 1.10445, 1.10315 and 1.10025.
- Stop-Loss: Above 1.10755
---
Patience and disciplined risk management are essential for this trade. Ensure to monitor momentum closely.
Disclaimer:
This analysis is for informational purposes only and does not constitute financial advice. Trading involves substantial risk, and past performance is not indicative of future results. Always conduct your own research and consult a financial advisor before making investment decisions. Trade responsibly.

AUD NZD Analysis Hello Traders and welcome again.
Here In AUD NZD Pair 1D candle sweep buy side liquidity and market change their structure also price created lots of liquidity and there is also smart money trap I think Market will tap extreme order flow and then it will start falling 📉
Let's see what happens next
Make sure to follow us.

AUD NZD Analysis 22/11/2024
Hello Traders and welcome again
In this AUD/NZD Pair Market Swept daily buy side liquidity it indicates that AUD/NZD Pair needs a deeper pullback. I am waiting for change of Character to identify the direction.
Let's see what happens next

AUDNZD ready to change into bullish AUDNZD has taken support from its hourly TF buyers order block(1.09955-1.10000)and has broken its structure at 1.10048 i have entered a long position at the level of 1.0050 with stop loss below the order block at the level of 1.09950 and as it has changed its character at 1.10108 it can move upside toward the levels of 1.10266, 1.10419, 1.10576


AUD/NZD Clear Bearish ChannelAUD/NZD is clearly in a bearish channel that has created lower highs and lower lows. You can even take sells now and target a good 1:3.6 RR.

AUDNZD BUY @1.08148 short term AUDNZD
BUY @ 1,08148
Sl: 1.07873
TP : 1.08793
IT has reache the FIB level 0.78 level and an Engulfing candle in 1h .

AUDNZD at importance multiple confluence levelAUD NZD forming rising Heal and solder in 4H chart
It is also near rising daily support line. It had just breached down weekly low
and about to break MONTHLY S1.It is near FOUR CONFLUANCE LEVEL(Weekly low, Monthly S1, low of right head and solder and monthly trend line.
if it takes support near 4 confluence level; than may rise up but if it breaks down all 4 confluence level than fall sharply.
ONLY FOR EDUCATIONA PURPOSE

AUDNZD - SHORT TRADESymbol - AUDNZD
AUDNZD is currently trading at 1.10970
I'm seeing a trading opportunity on sell side.
Shorting AUDNZD pair at CMP 1.10970
I will be adding more if 1.11200 comes & will hold with SL of 1.11700
Targets I'm expecting are 1.09500 - 1.08890
Disclaimer - Do not consider this as a buy/sell recommendation. I'm sharing my analysis & my trading position. You can track it for educational purposes. Thanks!
