NZDCAD trade ideas


NZDCAD in the side ways movement NZDCAD is in the side ways movement , this is perfect way to trade positionally , and earn the points in this segment. many days this is going in sideways , with full support and resistance. trade hopefully. thanks.

Don't miss the great sell opportunity in NZDCADTrading suggestion:
. There is still a possibility of temporary retracement to suggested resistance line (0.876). if so, traders can set orders based on Price Action and expect to reach short-term targets.
Technical analysis:
. NZDCAD is in a range bound and the beginning of downtrend is expected.
.The price is above the 21-Day WEMA which acts as a dynamic support.
. The RSI is at 40.
Take Profits:
TP1= @ 0.8715
TP2= @ 0.8685
TP3= @ 0.8620
TP4= @ 0.8570
TP5= @ 0.8530
SL: Break Above R2
❤️ If you find this helpful and want more FREE forecasts in TradingView
. . . . . Please show your support back,
. . . . . . . . Hit the 👍 LIKE button,
. . . . . . . . . . . Drop some feedback below in the comment!
❤️ Your Support is very much 🙏 appreciated! ❤️
💎 Want us to help you become a better Forex trader?
Now, It's your turn!
Be sure to leave a comment let us know how do you see this opportunity and forecast.
Trade well, ❤️
ForecastCity English Support Team ❤️

NZDCAD - Rising WedgePrice has correctibely reached the key level area and formed a rising wedge pattern.
Its has also formed a pattern- within- pattern of rising wedge formation even on a 15m TF to get a better entry with a higher risk to reward.
Forecasting it to go short to the minimum of TP -1 and the maximum of TP -2
Giving us a R:R of 4.11% in just 1 trade.
As the trade continues in our direction will be looking to scaling in to add in more profit %


NZDCAD GARTLEY pattern on 1 hr chart. Hello Trader, Here is the full analysis on NZDCAD
1) On 1hr chart we can see it as formed gartley pattern and possible reversal expected.
2) Price is moving toward strong resistance zone and can test this zone for up move and if it fails then on basis of gartley and strong resistance one can look for short.
How can you support me:
1) Like my idea.
2) Follow me for more analysis
3) I will Opening Telegram and instagram channels soon.
Feedback:
Please share your feedback in comments and this will help me to improve my drawing and analysis .


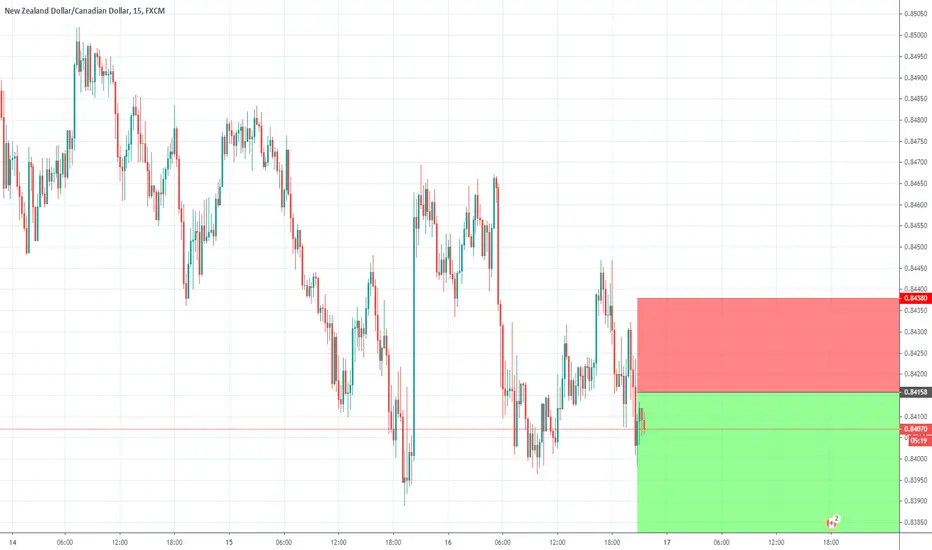
Bearish?I've taken a trade here. let's see how it goes. the marked grey boxes are my targets.
I'll update this idea in a while.
Also, what do you want me to analyse, let me know in the comments!!

NZD/CAD Long NZD/CAD 4 Hours.
Price looks like it's ready for a breakout I am looking for a position to go long after we see a small break out and a retest to the resistance level after that it is good idea to buy.
Not ready yet!!!
The news this week.
Wed May 13 4:00
NZD Official Cash Rate
NZD RBNZ Monetary Policy Statement
NZD RBNZ Rate Statement
5:00 NZD
RBNZ Press Conference
22:10 NZD
RBNZ Gov Orr Speaks
Thu May 14
4:00 NZD
Annual Budget Release
16:00 CAD
BOC Financial System Review
17:15 CAD
BOC Gov Poloz Speaks
Trade safe.
Greetings Anita

NZDCAD - 05/11/2020Will look to go short if price breaks below 0.85277 and long if price breaks above 0.85659.
At the current moment, price is in range.

Don't miss the great buy opportunity in NZDCADTrading suggestion:
. There is a possibility of temporary retracement to suggested support line (0.8443). if so, traders can set orders based on Price Action and expect to reach short-term targets.
Technical analysis:
. NZDCAD is in a range bound and the beginning of uptrend is expected.
. The price is below the 21-Day WEMA which acts as a dynamic resistance.
. The RSI is at 58.
Take Profits:
TP1= @ 0.8555
TP2= @ 0.8684
TP3= @ 0.8798
SL= Break below S2


Don't miss the great sell opportunity in NZDCADTrading suggestion:
. There is still a possibility of temporary retracement to suggested resistance line (0.8495). if so, traders can set orders based on Price Action and expect to reach short-term targets.
Technical analysis:
. NZDCAD is in a range bound and the beginning of downtrend is expected.
. The price is below the 21-Day WEMA which acts as a dynamic resistance.
. The RSI is at 32.
Take Profits:
TP1= @ 0.8425
TP2= @ 0.8345
TP3= @ 0.8245
SL: Break Above R2

NZD/CAD intraday BUYOur pivot point is at 0.8507.
Our preference:
rebound towards 0.8562.
Alternative scenario:
the downside breakout of 0.8507 would call for 0.8489 and 0.8479.
Comment:
the RSI is below 50. The MACD is negative and above its signal line. The configuration is mixed. Moreover, the pair stands below its 20 and 50 MAs (respectively at 0.8532 and 0.8542).
