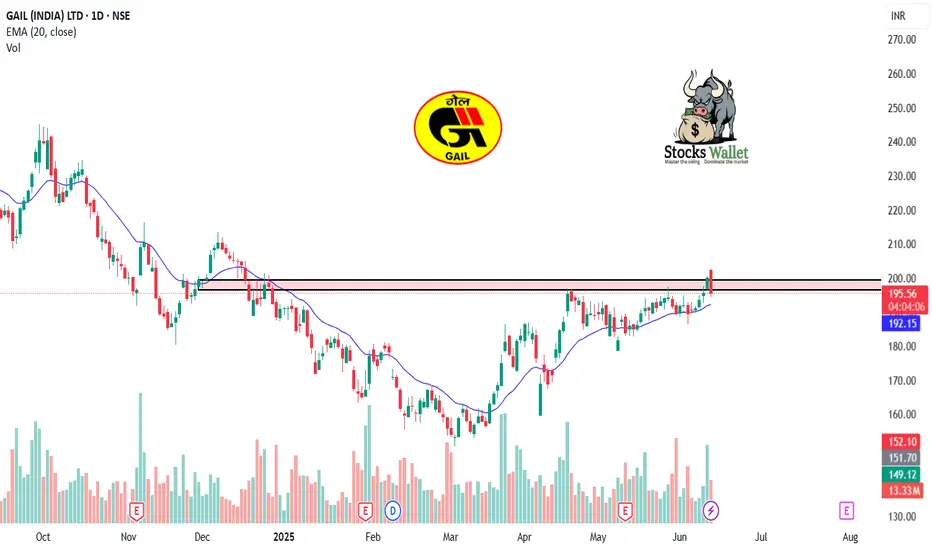
LONG GAIL.NSThe chart of this stock is forming a beautiful pattern & there's a clear buying opportunity as we can see the price has taken a clear bounce back from major support level {1.) On the base of the pattern 2.) On the daily timeframe of the chart } along with huge volumes.
NOT A BUY/S
Gail India Ltd.
No trades
Next report date
—
Report period
—
EPS estimate
—
Revenue estimate
—
1.16 USD
1.47 B USD
16.79 B USD
About GAIL (India) Limited
Sector
Industry
CEO
Sandeep Kumar Gupta
Website
Headquarters
New Delhi
Founded
1984
ISIN
US36268T2069
FIGI
BBG000B9ZBY7
GAIL (India) Ltd. engages in the exploration, production, processing, transmission, distribution, and marketing of natural gas. It operates through the following business segments: Transmission services, Natural Gas Trading or Marketing, Petrochemicals, LPG and Other Liquid Hydrocarbons, and Other. The Transmission services segment includes natural gas and LPG. The Natural Gas Trading or Marketing segment supplies of natural gas include fuel to power plants, feedstock for gas-based fertilizer plants, LPG extraction, and city gas distribution. The Petrochemicals segment manufactures and markets polymers polypropylene, linear low-density polyethylene, and high-density polyethylene from natural gas. The LPG and Other Liquid Hydrocarbons segment sells gas processing unit products such as LPG, propane, pentane, naphtha, and by-products of polymer plant. The Other segment is involved in GAIL TEL, exploration and production, city gas, and power generation. The company was founded in August 1984 and is headquartered in New Delhi, India.
Related stocks

GAIL (Weekly Chart) – Pattern & Levels Breakdown🔻 Descending Triangle Breakdown
Price has been respecting a descending triangle:- Flat support near ₹174.
Lower highs forming a down-sloping resistance.
Recent weekly candle has closed below the demand trendline → signalling weakness.
Breakdown Level: ₹174
📌 Fibonacci-Based Downside Targets
Based

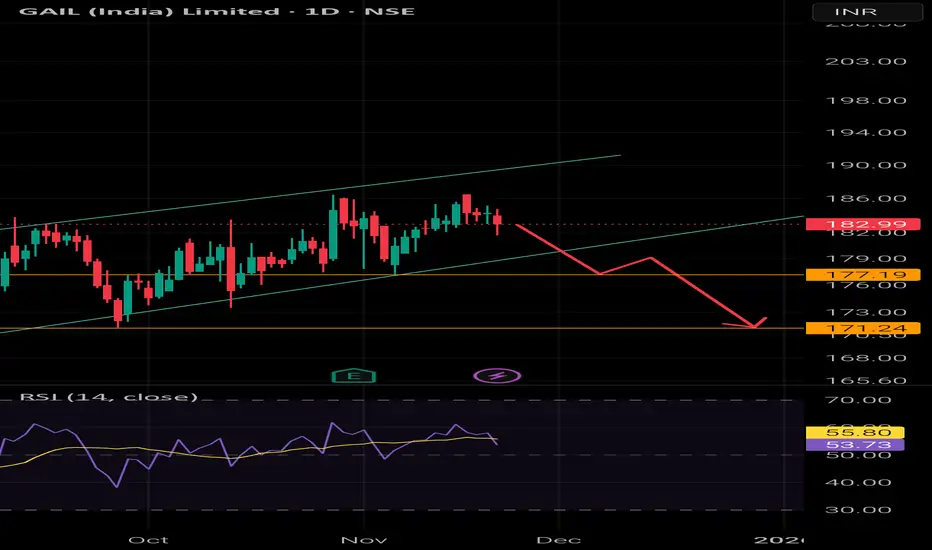
Rising Wedge PatternGAIL is forming a classic Rising Wedge pattern. The immediate targets can be nearest Support. A bearish Strategy can work well in this case
GAIL 1 Hour Time Frame✅ Key Levels
Resistance zone: ~ ₹186-₹190 — the stock recently tried to challenge this region (see intraday high ~₹191 in some sessions).
Support zone: ~ ₹174-₹176 — the lower bound of recent trading range (Moneycontrol shows recent low ~₹174.64).
Intermediate pivot: ~ ₹180-₹182 — currently acting
GAIL (India) Ltd 1 Day Time Frame 📊 Key Technical Indicators
Relative Strength Index (RSI): Approximately 58.89, indicating a neutral to bullish momentum.
Moving Average Convergence Divergence (MACD): Around 0.58, suggesting a bullish trend.
Simple Moving Averages (SMA):
5-Day: ₹179.11
50-Day: ₹177.17
200-Day: ₹177.3
These values i
GAIL India Ltd: Assessing Investment Potential Technical Analysis: Butterfly Pattern and Support Levels
GAIL India Ltd has formed a butterfly pattern in its stock chart, currently trading with a 30% decline from its recent highs. The stock is finding support around the ₹170 level, which may present a strategic entry point for long-term investors

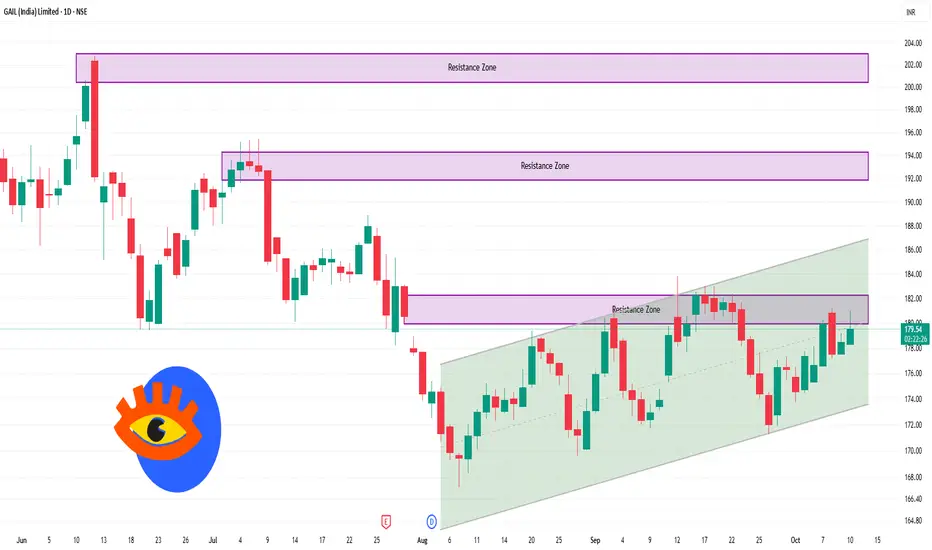
GAIL Bullish way ahead?!!!Chart patterns suggest me the above titled opinion
1. Its is travelling in a Ascending channel pattern making Higher highs and higher lows .
2. Now it is at the bottom support loading for the explosive move ahead.
3. Let's wait for the Breakout and enter.
Target levels mentioned in chart...SL u

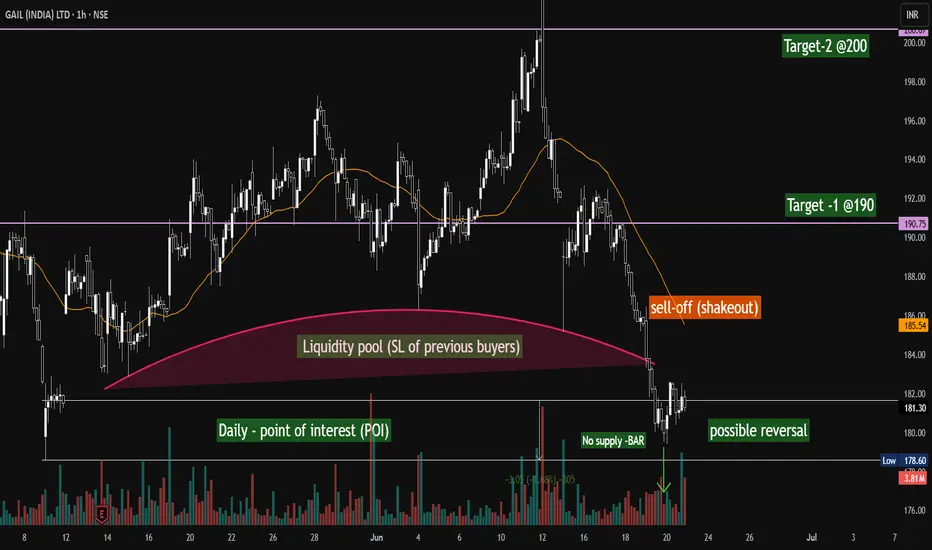
GAIL (INDIA) - Possible Reversal on the corner...GAIL (India) Ltd – 1H Chart Analysis (NSE) | June 21, 2025
Spotted a potential setup with key institutional footprints on the 1H chart:
🟥 Liquidity Pool Grab: Price dipped into the liquidity zone (SL sweep of previous buyers), potentially clearing weak hands.
📉 Shakeout Sell-Off: A sharp decline
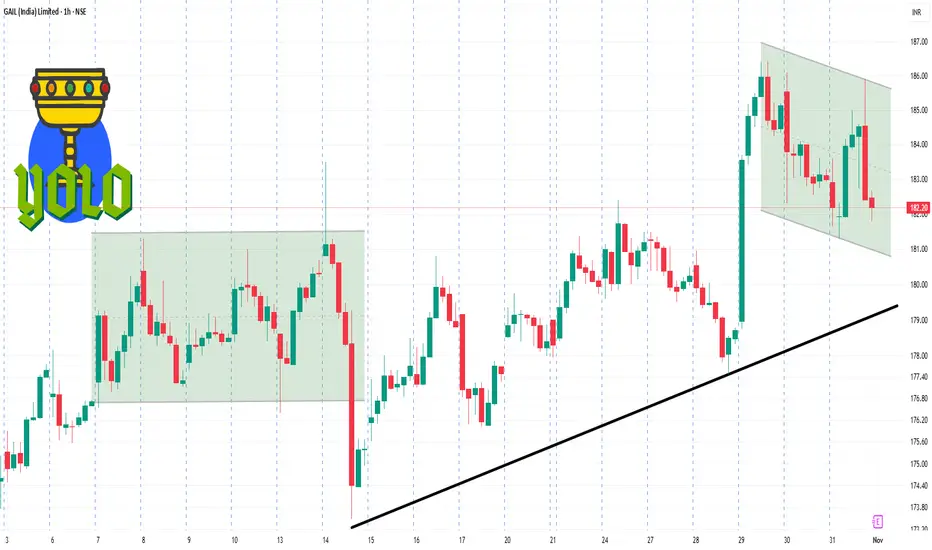
Short GAIL till 175 SL 192 Buy at 175 again and hold for upside🔍 Technical Breakdown (as per chart)
1. Rising Support Trendline
The white upward sloping trendline is currently acting as a long-term support.
Price is now approaching this trendline, which sits near ₹180–182 zone — a strong demand area.
2. Gann Time Cycle / Vertical Lines
Blue and yellow vertica

GAIL – Daily Timeframe , about to boomFollow us for more such content.
GAIL is showing strong signs of a bullish breakout, with price holding steadily above key moving averages and positive trend indicators. Institutional accumulation appears to be behind this move, and a close above resistance could see significant upside.
There is a h
See all ideas
Summarizing what the indicators are suggesting.
Neutral
SellBuy
Strong sellStrong buy
Strong sellSellNeutralBuyStrong buy
Neutral
SellBuy
Strong sellStrong buy
Strong sellSellNeutralBuyStrong buy
Neutral
SellBuy
Strong sellStrong buy
Strong sellSellNeutralBuyStrong buy
An aggregate view of professional's ratings.
Neutral
SellBuy
Strong sellStrong buy
Strong sellSellNeutralBuyStrong buy
Neutral
SellBuy
Strong sellStrong buy
Strong sellSellNeutralBuyStrong buy
Neutral
SellBuy
Strong sellStrong buy
Strong sellSellNeutralBuyStrong buy
Displays a symbol's price movements over previous years to identify recurring trends.