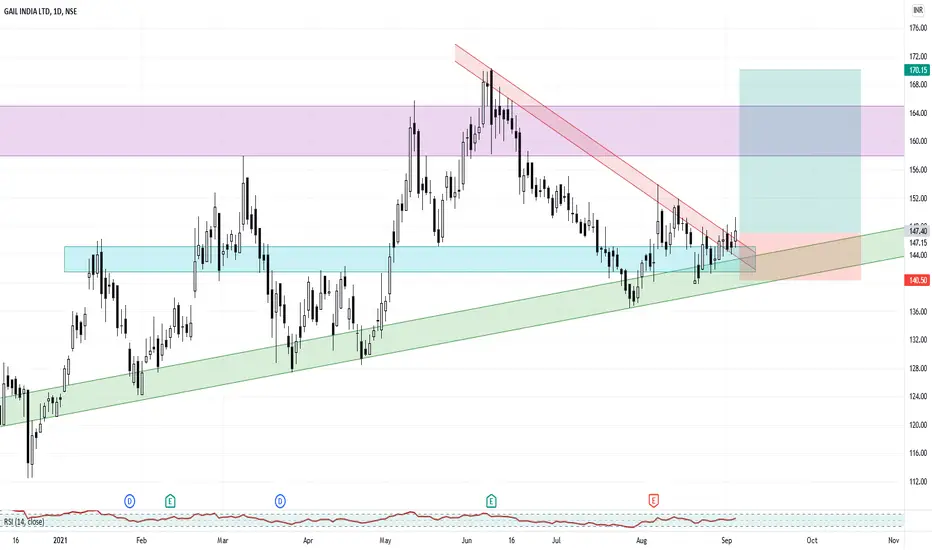
gail near support zoneone can buy gail with 2% stop loss and target of 15% hence the risk reward ratio is 1:7
Gail India Ltd.
No trades
Trade ideas

GAIL... Megaphone patternThe support and resistance lines are followed by the script. Looks like a good buy at the current price. Target 180 to 190. Stop-loss 138 with a risk-reward of 1:5.
That is about a 27% upward move over 4 to 8 weeks.
Triangle patterns are my strength, but this script is trading near its support zone. Should work out well...

GAIL - Can give good returnsBroke out of trendline and currently bouncing from support. Can be a good swing.

GAIL (Trend)-Can touch 150 in the short term
/*
Please do NOT consider these as trade recommendations.
I' am an amateur and posting these charts helps me understand the market better.
I' am open for suggestions/advice.
*/

Gail ind 1D*For educational purpose only it's not a call do your own analysis.
It is for positional trade, but risky.
Thanks.


SHORT TERM VIEWLOGIC,LEVEL AND TARGET WELL MENTIONED IN THE CHART
NOTE -The above interpretation from the chart is my personal view and doesn't guarantee any success.
(Do talk to your financial advisor before making any investment decisions)
please like, share and comment if you have any suggestion regarding this analysis

GAIL - High Probability Long Swing TradeChart is self explanatory. Entry, Targets and Stop Loss are mentioned on the chart.
Disclaimer: This is for demonstration and educational purpose only. This is not buying or selling recommendations. I am not SEBI registered. Please consult your financial advisor before taking any trade.
NSE:GAIL


GailGail has completed impulse wave of some degree as 1 to 5 and now is in correction phase likely to be a b & c, as per our view,
there could be a good probabilities of price to go down towards 125 to 130 zones, if situation goes as presumed then we can get any one trading opportunity from two options mentioned below.
First trading strategy option is
sell on rise with stoploss of 163
Second trading strategy option is
if price does'nt rises then sell only below this black line
with breakdown candle's high as stoploss
two trading strategies are possible to trade
volume comparision
bearish divergence in macd and price
bearish divergence seen in rsi & price
macd in weekly bearish
macd in daily is bearish and also below zero line
Disclaimer
I am not sebi registered analyst
My studies are for educational purpose only
Consult your financial advisor before trading or investing

GAIL ON BIG BREAKOUT,LONG FROM CMPGAIL CMP 145.45,Gave W-Neckline break out at 141.45, Expectingb ascending triangle breakout at 150.10, target 157/165/200+

GAIL INDIA LTD - LIVERMORE CYLINDER PATTERN BREAKOUTGail India Ltd Stock about to breakout from Livermore Cylinder Pattern which can be a bullish pattern . So, we can expect the stock may go long.
Please check the chart for details. Mentioned clearly about the support and resistance points (if applicable).
Avoid selling unless you see protentional breakout at the short side.
I am learning as well. so please analyse the chart by yourselves before taking any decisions.
Criticism always welcome

GAIL SWING TRADE The stock reclaimed its 50 EMA yesterday with above average volume along with downward sloping trendline breakout. The momentum indicator RSI also suggests positive bias along with positive MACD crossover in this counter.EMA CROSS OVER ON daily chart also formed recently
target 170
SL 142

GAIL EQUITY levels ...16/08/2021 (D candle)GAIL EQUITY complete the harmonic pattern and its break previous resistance ...so its chances to reach 160+ in short term

Buy Opportunity ~ Gail ~ Positional 🔥Buy Gail
Entry Price @CMP 144-145
Target Price 149-150
SL below 141

Energy sector showing signs of bullishness - Bought GAILEnergy sector showing signs of bullishness.
Nifty Energy was up when nifty was flat today.
Can see good opportunity in GAIL because of following reasons :
Weekly chart shows uptrend in stock
Stock taking support from 20 & 50 EMA on daily timeframe
Can look for entering 50% of your position size.

GAILNear support zone now.An uptrend will see momentum upto 168-170 and in opposite direction will be between 140-143.Let's see.

GAIL, 15The Gail India has breakout in the last market hour forming the falling wedge pattern and consolidating for pullback.
The candlestick has already crossed the 20 SMA in Bollinger band showing the downtrend. If the Gail India doesn't reverse the trend when the pullback is formed we can short sell it.
If it reverse the trend, it can again form the sideway trend for 1-2 hours.

GAILUpside Movement Expected till next marked resistance, Here smart money is continuously trapping retailers so don't keep your stop-loss too tight give some space to your SL else will regret it later.

BUY GAIL...GO AND BUY GAIL ABOVE 155 RS
once it closes above 155rs on daily chart this script can show you 167 to 180rs
sl will be 135rs
stock is being accumelated by big players and has good volumes.
targets in 2 to 3 months will be 180rs
only go long on gail above 155rs
its my personal view based on technical analysis.
Disclaimer: I AM NOT A SEBI REGISTERED ANALYST AND PLEASE CONSULT YOUR FINANCIAL ADVISOR BEFORE TAKING ANY POSITION.
STOCK MARKET AND RELATED INVESTMENTS ARE SUBJECT TO MARKET RISK
IF YOU HAVE ANY DOUBTS PLEASE CONTACT YOUR BROTHER WOULD LOVE TO HELP.
AAPKA BHAI,
ARIHANT JAIN


Simple Trade Setup | GAIL | 09-08-2021NSE:GAIL
On Daily Time frame it has broken 21DMA with Gap up and with good volume on 06-08-2021.
Also on 05-08-2021, we saw sudden sell off in 2nd half. But RSI made minor lower high while price action made huge lower low. This was a bear trap and panic sell off before the results. Results announced by the evening and it was good results.
Simple Trade Setup for 09-08-2021.
1) If it stays and trade above 149 level and it will be a good entry point for buy trade.
2) If it open flat and go down and get support from 147 level then it will be also a good entry point for buy trade.
3) But if it breaks down the 147 level then it will be again short trade till 144 target.
4) Since 21DMA is placed at 143.70/143.75 level then in this down fall it might test 21DMA and make reversal. And if it gets support from 143.75/144 level then it will be a good entry for Buy trade. But if it fails to get support and breakdown 21DMA level then we will see profit booking and it will give down move.
5) Safe Entry Trade Level
For Buy Trade it will be above good breakout of 150 level.
For Sell Trade it will be below good breakdown of 143 level.
Hope chart and levels are easy to understand.
Do comment your doubt or suggestion.
