Investment GAILWatchout for Multi year Break out > 10yrs . Investment candidate , 103 will be good support now . Maybe news to follow
Gail India Ltd.
No trades
Trade ideas


Buy GAIL INDIA LTD
BUY : GAIL INDIA LTD
MEDIUM TRAM
AFTER 2.5 YEAR CONSOLIDATED ZONE BREAKOUT
BUY PRICE : 116
STOP LOSS :
TARGATE : 135 - 140
MOMENTUM : 20%
FREE TELIGRAM CHANNEL & YOUTUBE
Tradingwithdp📈📊
NOTE : LONG TERM BE GOOS STOCK
TECHNICAL ANALYSIS
PURE PRICE ACTION ANALYSIS
Disclaimer:- I Am not a sebi registered Analyst. This channel is for only educational purpose. Any profit/loss, iam not responsible. Before taking any trade on our call.

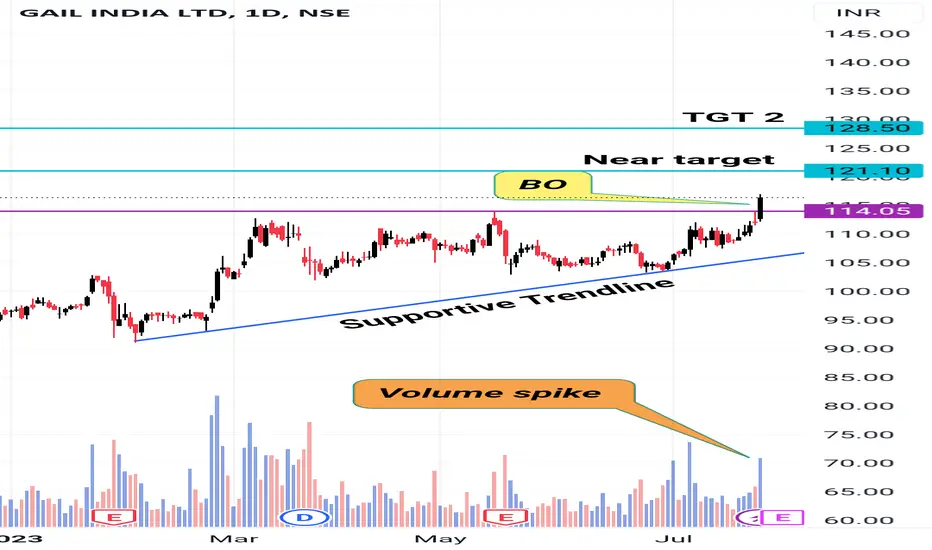
Gail Breakout and retest Level around 113 has been an important resistance zone, (purple shaded area)
On 25th july there was a breakout through this level accompanied with higher volume
After that there was a pullback,
and retest of the level around 113, which has now turned into support
After the retest, vol also increased indicating bullish strength
Oscillators are also in favour of bulls
Level of 129.8 (white horizontal line) is the next resistance after 122.8 (previous high)
All the white lines marked are further resistance levels
Keep SL of 113, Keep RR Ratio of 1:1 or above
For a Short Term Trade keep tgt 124
Tgts can be increased to further resistance levels depending on risk profile

Gail - buy on dipsBuy near 114.45 if any dip for last opportunity
easy tg - 117
tg2 - 122
Disclaimer : This is my personal analysis for study purpose not intended for trading.

GailA clear breakout from a consolidating level. The retracement is also completed.
Gail is looking good for an upward journey

LONG GAILGAIL Looking Good In Falling Market.
Cmp - 110
Buy At Cmp & On Dips To 100-103
SL - 91 ( Weekly Closing Basis )
Target - 140/150

GAIL at discount price and Break out pointHello Friends,
Here is another one stock that i am looking to build position with discount price.
There is good opportunity in this stock as it has recently given break out but due to US rats down its available with discount price so good to make position which can give up to 10 to 15 points returns in short term and long term depends on you.
It has MACD positive and RS index also positive so good to go.
Take entry around 110 - 115
Target can be 130
This is my point of view on this stock but rest you review by yourself and make decision.
Like | Share | Comment
Thank you.

Gail - buyBuy from cmp to 114.2
easy tg - 116
tg2 - 116.9
sl close below 114
Disclaimer : This is my personal analysis for study purpose not intended for trading.

BREAKOUT, GAIL INDIA, 43% RETURNS!!!BUY - GAIL INDIA LTD
CMP - Rs. 115
Target - 1: Rs. 145
Target - 2: Rs. 165
.
Timeframe - 6-9 months
.
Technicals - Trendline Breakout
.
This is just a view by an expert analyst, please invest at your own risk.
.
Follow me for more!

Gail long setup in weekly timeframeGail long setup in weekly timeframe.
channel pattern breakout. wait for one green candle and invest full for a good returns in medium term.

GAIL set to blast up !!GAIL has created a flag and pole set up on the daily and weekly charts. Trading at 103 it is at its bottom end of the flag and even has trend line support to give momentum to the stock. Buy at current levels , SL to be placed on a closing below 102 on a weekly basis for Tgt of 108, 112 . Can hold upto levels of 130 if bought in cash but then adjust SL to be below 96 on weekly closing basis.


RESISTANCE BECOME SUPPORTGAIL getting resistance at 100-102 level 14 years resistance now acting as support, may get new high level look at chart as detail pointed level. same condition on monthly charts also following. world moving towards gas so India also taking same action for meeting carbon free environment. this may portfolio stock
don't consider as recommendation for buy or sel
pleas follow as and give suggestions

Gail - Possible Super Bullish move Gail - Looks Like bullish move start we can see good upside
Time Frame - 8 Days
Objective :- Big Support by Demand Zone.
1. Very good Trendline Support.
2. Make Base near Level 100.
3. Good Resistance at 130-133
4. looks like we can see 20-50% upside in Gail.
Ideas :- Go Long CMP add more near 100-104 CB stops 98 Target 130 145 184+++
Disclaimer - Ideas just for Education Purposes.

Gail BreaoutGail was trading in zone 90 - 113. If it sustain for a week or two near 116-20 levels, certainly we can observe 10-20% upside n short to medium term.
Secondly, RSI has become Positive after long time on weekly charts which is a healthy sign.
Can buy on this levels if risk taker or wait for the next weeks candle on daily and weekly charts.
Disclaimer ; the idea is just for knowledge not a buying recommendation.

GAIL 1D 1WTRADING COMMUNITY
JOIN US ONLY IF YOU WANT PEACE AND PROFIT IN YOUR TRADING LIFE.
I am not a call provider, not SEBI approved person. All the charts and PnL here are for educational purposes. Consult a professional financial advisor before you invest.

Gail India Bullish BreakoutGail India breaks a downtrend line on weekly chart and gives a breakout close on above with good volume spike in it so we can see a bullish momentum will continue in this stock in coming days for the target of 115 zones.

Gail India Analysis Stock has given BO on daily chart with good volume, follow chart for proper entry and exit levels.


GAIL INDIA LTDGail chart looks really promising at CMP 111.50
Patterns are drawn on Monthly Chart Basis and projected on Weekly Time Frame for Clear View.
Targets are as follows:
Tgt 1: 113.50 (Daily Chart)
Tgt 2: 116.50 (Weekly)
Tgt 3: 122.50 (Weekly)
SL: 108 (Closing Basis)
Market is all about OPPORTUNITY / ENTRY / TIMING !!!!!
Basis some minute observations, chart analysis is made, target and SL is given to understand the core of the subject for learning purpose only.

