Shorted SBIN on Swing BasisI have shorted SBIN on a swing basis.
Here are my reasons:
1. The stock has had a good rally over Sep & Oct months.
2. In November, the momentum has started to fizzle out slightly.
3. There has been lower high formations since 6 Nov.
4. I can see a double top formation on the lower time frame.
A Target of 930 price level which is near to 20 DEMA is what I'm looking for.
P.S. Not a recommendation. Please do your own due diligence.
Trade ideas

Candle Pattern Explained There are two primary types of options: Call Options and Put Options. A Call Option gives the buyer the right to purchase an underlying asset at a specific price (called the strike price) before or on a certain date (known as the expiry date). Traders buy calls when they expect the price of the asset to rise. Conversely, a Put Option gives the buyer the right to sell the asset at the strike price within a specific period. Traders buy puts when they anticipate the asset’s price will fall.

SBIN 1 Month Time Frame Level🔍 Key Levels for 1‑Month Timeframe
Support Zones
Around ₹ 946‑953: Daily pivot/resistance turned support zone.
Next support near ₹ 935‑943: If the price drops below the first zone, this becomes the next demand area.
Broader support around ₹ 900‑910: From longer‑term moving averages and structural support. (MA200 ~₹ 896 per indicator).
Resistance / Upside Zones
Immediate resistance around ₹ 969‑972: Close to the 52‑week high and recent highs.
If momentum carries, potential extension to ₹ 1000+ zone. Some fib‑/pivot‑based projections suggest ~₹ 1003.
Premium Chart Patterns Chart patterns are one of the most powerful tools in technical analysis. They visually represent how price behaves over time and help traders understand market psychology, identify trend direction, and predict future price movements. Whether a trader is dealing with equities, commodities, currencies, or indices like NIFTY or BANKNIFTY, chart patterns offer high-probability setups for both intraday and positional trading.
At their core, chart patterns indicate market sentiment—fear, greed, indecision, accumulation, distribution, breakouts, or reversals. When repeated price behaviour forms recognizable shapes on a chart, traders can use them to anticipate the next move. These shapes emerge from support, resistance, trendlines, and consolidation zones.
Broadly, chart patterns are classified into three categories:
Reversal Patterns – Signal a trend reversal
Continuation Patterns – Indicate the trend will resume
Bilateral Patterns – Suggest breakout in either direction

SUPPORT & RESISTANCE AND DEMAND ZONE Reliance Industries (RELIANCE)
RSI: technical pages show mixed momentum (not deeply overbought); typically RSI around neutral (40–60) on daily timeframe
Volume / Institutional: heavyweight stock; recent sessions saw institutional participation on positive earnings days (Reliance was a market driver).
2-week Support / Resistance: Support: ₹1,380–1,400. Resistance: ₹1,480–1,520 (immediate), next resistance ~₹1,550 (recent highs). (Levels drawn from recent intraday highs/lows and
Bollinger / MACD: Mixed — price inside upper half of BB during bounce; MACD positive on some technical pages but momentum not extremely strong.
Tactical note (2-wk): large cap that can stabilise portfolio — buy on dips toward ₹1,380 with stop ~₹1,340; target for 2 weeks: ₹1,520–1,560 (if market remains constructive).

Part 10 Trade Like InstitutionsWhy Traders Use Options
Options are used for various purposes:
Hedging – To protect portfolios against adverse price movements. For instance, a fund manager holding stocks may buy Put options to limit downside risk.
Speculation – Traders use options to bet on market direction with limited capital.
Income Generation – Writing (selling) options can earn premium income. Covered Call and Cash-Secured Put strategies are popular examples.
Leverage – Options offer exposure to large positions with a small upfront cost.

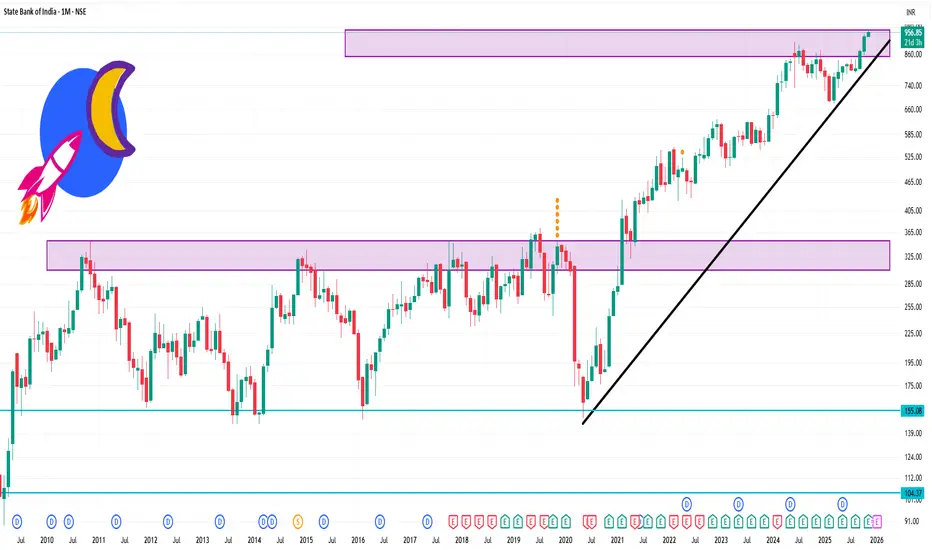
SBI- Breakout📊 Chart Setup
Pattern: Consolidation range breakout after a sharp recovery leg.
Volume: Breakout accompanied by decent volume – though a stronger surge would have confirmed conviction.
Trend: Trading above all key moving averages (bullish alignment).
Relative Strength: Positive vs. Nifty, showing leadership within PSU banking space.
Sector View: PSU banks are gaining traction, supporting the breakout.
🔎 Technical View
Stock has broken out of a sideways consolidation box (~798–840 zone) after a sharp up leg.
A higher-low structure is intact on the weekly chart, supporting the uptrend resumption.
Relative Strength line vs. Nifty is trending upward, confirming outperformance.
Momentum is aligned with broader PSU sector strength.
🎯 Trading Plan
Entry Zone: Current levels (860–870) or on dips towards 835–840 (retest).
Stop Loss (SL): Below ₹798 (weekly closing basis).
Targets:
Short-term: ₹915–930 (previous supply zone).
Medium-term: ₹980+ (measured move of consolidation breakout).
⚖️ Risk Management
Risk/Reward: ~1:2 (SL 7–8%, Upside 15–20%).
PSU sector leadership makes this a swing candidate rather than just a short-term trade.
Watch for volume expansion in coming sessions for confirmation.

The Volatility Contraction Pattern In (SBIN)The Volatility Contraction Pattern (VCP), developed by Mark Minervini, is a technical analysis pattern used in stock trading to identify potential breakouts. It occurs when a stock’s price consolidates with decreasing volatility, forming a series of tighter price ranges or contractions, often after a significant uptrend. This pattern signals that the stock is building energy for a potential breakout as selling pressure diminishes and buyers step in at higher lows.
Key Characteristics of VCP:
Price Contractions: The stock forms multiple pullbacks or consolidations, with each successive pullback having a smaller price range (lower highs and higher lows), indicating reduced volatility.
Volume Dry-Up: Trading volume typically decreases during the consolidation phase, reflecting a lack of selling pressure.
Uptrend Context: VCP usually appears after a stock has already shown a strong uptrend, suggesting accumulation by strong hands (institutional investors).
Breakout: The pattern resolves with a breakout above resistance on increased volume, often leading to a significant price move.
Volume Analysis: Check for declining volume during the contractions, with a spike in volume on the breakout.
Timeframe: VCPs can form over weeks to months, depending on the stock and market conditions.
Pivot Point: The breakout typically occurs at a “pivot point” where the stock breaks above the resistance level of the final contraction.
arget: Project price targets based on the depth of the prior uptrend or use trailing stops to capture gains in a strong move.
Risk Management: Since VCPs can fail, ensure proper position sizing and adhere to stop-loss levels.

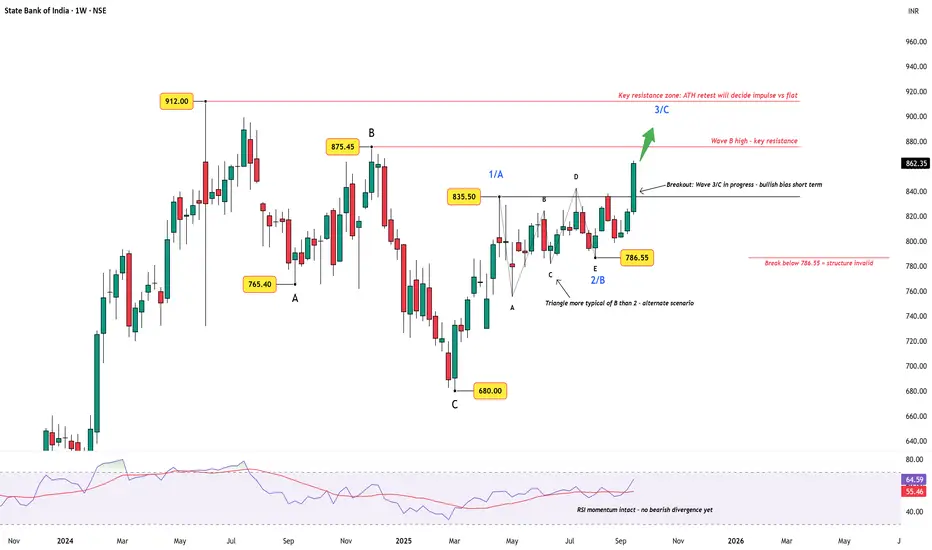
State Bank of India – Breakout, but With CheckpointsWeekly Chart View
State Bank of India has staged a strong breakout above the consolidation zone near ₹835, with weekly RSI showing healthy momentum and no bearish divergence yet. This breakout suggests that Wave 3/C is in progress , keeping the short-term outlook bullish.
Key Observations:
Wave 2/B: The recent sideways move looks like a triangle. While triangles are unusual for Wave 2, they are common in Wave B — raising the possibility that this could be part of a larger corrective flat.
Resistance Levels: Immediate resistance sits at the Wave B high (₹875.45) , followed by the all-time high (₹912). The ATH retest will be critical in determining whether the structure continues impulsively or morphs into a flat.
Support & Invalidation: The breakout remains valid as long as price stays above ₹786.55 (Wave 2/B low). A decisive break below this level would invalidate the current bullish structure and force reevaluation.
Momentum: RSI is supportive, showing strength and no sign of divergence yet.
Summary:
The bias remains bullish in the short term , but this rally will be tested at the higher resistance levels. If the stock pushes through the ATH, we may confirm an impulsive sequence. If not, a 3-3-5 flat could be in play. Either way, this is a key checkpoint zone for SBI.
Disclaimer: This analysis is for educational purposes only and does not constitute investment advice. Please do your own research (DYOR) before making any trading decisions.
Entry to Exit: Step-by-Step Trading Management1. Pre-Trade Preparation
Before you even think about entering a trade, preparation is critical. This stage sets the foundation for disciplined execution.
a. Market Analysis
Technical Analysis: Use charts, indicators, and patterns to identify potential entry points.
Identify support and resistance levels.
Observe candlestick patterns for price action clues.
Use trend indicators like moving averages, MACD, or RSI to assess momentum.
Fundamental Analysis: Understand the underlying factors affecting the asset.
Economic data, earnings reports, central bank decisions.
News and geopolitical events.
Sentiment Analysis: Gauge market psychology.
Look at volatility indices, open interest, or social sentiment.
b. Define Your Trading Plan
Set Clear Objectives: Determine your risk appetite and target returns.
Time Frame Selection: Choose your trading horizon (intraday, swing, or positional).
Risk Management Rules: Decide maximum risk per trade (commonly 1–3% of capital).
2. Entry Strategy
The entry is where strategy meets execution. A well-timed entry increases the probability of success.
a. Entry Types
Breakout Entry: Enter when price breaks key support/resistance levels.
Ensure confirmation (volume spike, retest of breakout level).
Pullback/Trend-Following Entry: Enter on a retracement in a trending market.
Use Fibonacci levels or moving averages for precision.
Reversal Entry: Enter when a trend is showing signs of exhaustion.
Look for reversal candlestick patterns (hammer, engulfing).
b. Entry Confirmation
Avoid jumping in impulsively; confirm with:
Price action analysis.
Technical indicators (MACD crossover, RSI divergence).
Volume spikes (high volume validates the move).
c. Position Sizing
Determine trade size based on:
Risk per trade (% of capital you are willing to lose).
Stop-loss distance.
Formula:
Position Size = (Risk Amount / Stop Loss Distance) × Trade Multiplier
3. Stop-Loss and Risk Management
Effective risk management ensures you survive losing streaks and protect your capital.
a. Setting Stop-Loss
Technical Stop-Loss: Place beyond support/resistance or key swing levels.
Volatility Stop-Loss: Based on Average True Range (ATR) to allow normal market noise.
Time-Based Stop-Loss: Exit after a specific period if the trade is not moving in your favor.
b. Risk-to-Reward Ratio
Maintain at least 1:2 or 1:3 R:R to make your strategy profitable in the long run.
Example: Risk $100 to make $200–$300.
c. Trailing Stop-Loss
Adjust stop-loss as the trade moves in your favor to lock in profits while giving the trade room to grow.
4. Trade Monitoring and Management
Once in a trade, the work doesn’t stop. Active monitoring is crucial to manage outcomes effectively.
a. Observe Market Conditions
Stay aware of news, sudden market swings, and volatility spikes.
Avoid making emotional decisions based on temporary market noise.
b. Partial Profit Booking
Take profits on a portion of the trade at key levels to reduce risk.
Example: Book 50% profit at first resistance/support and let the rest run.
c. Scaling In/Out
Scaling In: Add to a winning position at predetermined levels.
Scaling Out: Reduce exposure gradually to protect gains.
d. Avoid Overtrading
Do not enter new positions impulsively based on a winning trade.
Stick to your plan and wait for the next valid setup.
5. Exit Strategy
Exit planning is as critical as entry. Exiting with discipline protects profits and limits losses.
a. Profit Target Exit
Predefine target levels based on:
Historical highs/lows.
Fibonacci extensions.
Trendlines or pivot points.
b. Stop-Loss Exit
Let stop-losses do their job if the market moves against you.
Avoid moving stop-loss further away unless part of a pre-defined trailing strategy.
c. Time-Based Exit
Some trades need closure after a set period to avoid overnight risk or weekly/monthly expirations.
Particularly useful in options, futures, or intraday trading.
d. Reversal Signals
Exit if price action shows a clear reversal pattern.
Confirm with momentum indicators like MACD divergence or RSI overbought/oversold conditions.
6. Post-Trade Analysis
After the trade is closed, analyzing your performance is critical for long-term improvement.
a. Review Trade Decisions
Why did you enter? Did the market behave as expected?
Was your stop-loss placement appropriate?
Did you follow your plan or act on emotion?
b. Record-Keeping
Maintain a trading journal:
Entry and exit points.
Stop-loss and target.
Outcome and lessons learned.
c. Performance Metrics
Calculate win/loss ratio.
Evaluate risk-adjusted returns.
Identify patterns of mistakes to correct in future trades.
7. Psychological and Emotional Management
Trading is as much about mental discipline as it is about strategy.
a. Discipline
Stick to your plan regardless of short-term outcomes.
Avoid revenge trading or impulsive exits.
b. Emotional Control
Fear and greed are traders’ worst enemies.
Use checklists to reduce emotional decision-making.
c. Confidence Building
Start with smaller position sizes.
Gradually increase risk as your strategy proves profitable.
8. Advanced Trade Management Techniques
For experienced traders, there are ways to optimize entries and exits:
a. Multiple Time Frame Analysis
Confirm trade setups on higher and lower time frames.
Avoid taking trades that conflict with long-term trends.
b. Hedging
Use options or other derivatives to protect profitable positions.
Particularly useful in volatile markets.
c. Automated or Algorithmic Stops
Pre-set stop-loss and target levels in trading platforms.
Reduces the risk of emotional interference.
Conclusion
Trading management from entry to exit is a structured process that blends strategy, discipline, and psychology. By following these steps, a trader can:
Identify high-probability setups.
Enter trades with precise execution.
Protect capital with robust risk management.
Monitor trades actively without emotional interference.
Exit at predefined levels or with adaptive strategies.
Learn and improve continuously through post-trade analysis.
Success in trading is not about winning every trade but about managing trades systematically so that over time, profits outweigh losses. The key lies in preparation, discipline, and consistent execution.

SBI bearishSBIN 794 has broke down support 805 and we expect will drop to 769 to complete the pattern formation. Volume confirms the breakdown

Advanced Hedging Techniques in Financial MarketsIntroduction to Hedging
Hedging refers to taking an investment position that offsets potential losses in another position. In financial terms, it is akin to insurance: it reduces exposure to various risks including market risk, currency risk, interest rate risk, credit risk, and commodity price risk. The primary goal of hedging is not to generate profit, but rather to stabilize financial outcomes and protect portfolios from volatility.
While traditional hedging methods are straightforward—such as purchasing a put option to protect a stock holding—advanced techniques are more nuanced and multi-layered, often involving combinations of instruments and dynamic adjustments based on market conditions.
Key Principles of Advanced Hedging
Advanced hedging is grounded in several principles:
Risk Identification and Quantification: Before implementing a hedge, it is crucial to identify the type and magnitude of risks. This involves calculating Value-at-Risk (VaR), sensitivity to market factors (Delta, Gamma, Vega), and scenario analysis.
Hedge Effectiveness Measurement: Advanced hedges are monitored to ensure they effectively reduce risk without excessive cost. Metrics like hedge ratio, basis risk, and correlation analysis are used.
Dynamic Adjustments: Unlike static hedges, advanced techniques often require constant rebalancing as market conditions and exposures change.
Cost-Efficiency: Hedging involves costs—premium payments, margin requirements, or opportunity costs. Advanced techniques seek to optimize protection while minimizing these costs.
Integration with Corporate Strategy: Hedging is not an isolated financial exercise but part of the organization’s overall financial and operational strategy.
Advanced Hedging Techniques
1. Option-Based Hedging Strategies
Options are versatile derivatives that provide the right—but not the obligation—to buy or sell an asset at a predetermined price. Advanced option strategies allow for precise hedging of complex portfolios.
a. Protective Puts
A protective put involves buying a put option on an asset already owned. It provides downside protection while allowing upside potential.
Advanced variants may involve deep out-of-the-money puts for low-cost hedges or laddered puts at different strike prices to create a cost-effective risk floor.
b. Collars
A collar strategy combines buying a protective put and selling a covered call on the same asset. This limits both downside risk and upside potential.
It is widely used by corporations to hedge stock holdings or anticipated cash flows.
c. Option Spreads
Spreads involve multiple option positions on the same or related assets.
Examples:
Vertical Spread: Buying a call at one strike price and selling a call at a higher strike price.
Calendar Spread: Buying a long-term option while selling a short-term option to hedge time decay.
These spreads can reduce hedging costs and fine-tune risk exposure.
2. Delta, Gamma, and Vega Hedging
Sophisticated hedging involves managing the Greeks, which are measures of sensitivity of options and derivatives to various market factors.
Delta Hedging: Adjusts a portfolio to be neutral to small price movements of the underlying asset. Typically involves buying or selling the underlying asset to offset option exposure.
Gamma Hedging: Protects against large movements in the underlying by adjusting delta dynamically.
Vega Hedging: Reduces risk from volatility changes. Vega hedging is essential for portfolios heavily reliant on options, particularly in turbulent markets.
These techniques are particularly valuable for institutional traders and hedge funds, where complex derivative portfolios need constant monitoring and adjustment.
3. Cross-Hedging
Cross-hedging occurs when a direct hedge is unavailable, and an asset is hedged using a correlated instrument. For instance:
An airline might hedge fuel costs using crude oil futures rather than jet fuel contracts.
Cross-hedging requires advanced statistical techniques to measure correlation and potential basis risk, which is the risk that the hedge does not perfectly offset the exposure.
This method is often employed in commodities, currencies, and emerging market assets.
4. Dynamic Hedging
Unlike static hedges, dynamic hedging involves continuous adjustment of positions based on market movements and changing exposures.
Common in options trading where delta changes as the underlying asset price fluctuates.
Requires real-time market monitoring and algorithmic execution.
Often combined with quantitative models to calculate optimal hedge ratios at any point in time.
Dynamic hedging is highly effective but computationally intensive and costly if not automated.
5. Structured Products for Hedging
Structured products are customized financial instruments designed to achieve specific risk-return objectives. They combine derivatives, debt, and equity to provide:
Capital protection: Ensuring principal is preserved while participating partially in market upside.
Customized exposure: Targeting specific market conditions or asset classes.
Yield enhancement: Generating income through embedded options or derivatives.
For example, a company exposed to currency risk might invest in a structured note that pays interest based on a currency basket while protecting against adverse moves in a single currency.
6. Volatility Hedging
Volatility hedging protects against unexpected market swings rather than directional price changes. Techniques include:
VIX Futures: Hedging equity portfolios against market volatility spikes.
Straddles and Strangles: Options strategies that profit from large price moves in either direction, effectively hedging against high volatility events.
This approach is critical for portfolios with high sensitivity to uncertainty and shocks.
7. Hedging with Interest Rate Swaps and Credit Derivatives
Advanced fixed-income hedging involves derivatives such as:
Interest Rate Swaps (IRS): Companies use swaps to convert floating-rate debt into fixed-rate debt, stabilizing interest costs.
Credit Default Swaps (CDS): Provide protection against counterparty or sovereign default risk.
These techniques allow organizations to hedge balance sheet risks and maintain financial stability even in adverse economic environments.
8. Hedging Using Quantitative Models
Sophisticated investors use quantitative and algorithmic models to identify hedging opportunities:
Value-at-Risk (VaR) Models: Measure the potential loss in a portfolio over a given time frame under normal market conditions.
Stress Testing and Scenario Analysis: Simulate extreme market events and optimize hedges accordingly.
Optimization Algorithms: Determine the most cost-effective hedge by balancing risk reduction and capital efficiency.
9. Global and Multi-Asset Hedging
For multinational corporations and global investors, risks are not confined to a single market:
Currency Risk: Hedging via forwards, futures, or options in multiple currencies.
Interest Rate Risk: Using swaps or futures to manage exposure across multiple countries.
Commodity and Equity Risks: Coordinating hedges across correlated markets to ensure comprehensive protection.
Multi-asset hedging requires integrated risk management systems and sophisticated monitoring tools.
Challenges and Considerations in Advanced Hedging
Cost of Hedging: Advanced hedges can be expensive due to premiums, transaction costs, and margin requirements.
Complexity and Expertise: Implementing these strategies requires high-level knowledge of derivatives, financial modeling, and regulatory frameworks.
Model Risk: Quantitative approaches rely on assumptions; incorrect models can lead to under-hedging or over-hedging.
Liquidity Risk: Some derivatives used in advanced hedges may be illiquid, making it difficult to enter or exit positions.
Regulatory Constraints: Hedging strategies must comply with financial regulations, accounting standards, and reporting requirements.
Real-World Examples
Airline Fuel Hedging: Airlines like Southwest use a combination of futures, options, and collars to hedge fuel costs while minimizing expenses.
Global Corporations and Currency Risk: Companies like Apple and Microsoft hedge international currency exposure using forwards and options, ensuring stable revenues despite exchange rate fluctuations.
Hedge Funds: Quantitative hedge funds implement delta-gamma-vega hedging across complex option portfolios to neutralize risk while exploiting small inefficiencies in the market.
Conclusion
Advanced hedging techniques extend far beyond simple forward contracts and protective options. They involve a combination of derivative instruments, quantitative modeling, dynamic adjustments, and strategic integration into an organization’s financial framework. By employing these techniques, corporations, institutional investors, and hedge funds can mitigate risks associated with market volatility, interest rate changes, currency fluctuations, and other financial uncertainties.
While the complexity, cost, and technical expertise required are high, the benefits include enhanced risk management, improved financial stability, and optimized capital usage. In today’s volatile global markets, mastering advanced hedging is not just an option—it is a necessity for any sophisticated investor or financial manager seeking to protect value while strategically navigating uncertainty.

SBI 1 Day Time Frame 📊 Daily Technical Levels for SBI
Pivot Point (Central Pivot): ₹904.07
Immediate Support Levels: ₹871.88 (S4), ₹881.47 (S3), ₹894.48 (S2), ₹904.07 (S1)
Immediate Resistance Levels: ₹917.08 (R1), ₹926.67 (R2), ₹939.68 (R3), ₹904.07 (R4)
Fibonacci Retracement Levels: ₹895.43 (23.6%), ₹904.07 (50%), ₹912.70 (61.8%)
Camarilla Pivot Levels: ₹905.43 (C1), ₹904.07 (C2), ₹903.36 (C3), ₹901.28 (C4)
These levels are calculated based on the previous day's price action and are widely used by traders to identify potential support and resistance zones.

Interesting Setup in India's Biggest BankSBI has been in my radar for sometime and I am quite bullish on BFSI segment and sector as a whole. My favourite is SBI simply because analyst have 100 reason why not to buy it. The chart speaks something else.
A very typical C&H in making, with Prior uptrend and a cup is made. Now either it is straight forward breakout and target can be depth of the cup from the trendline drawn or there is a pullback to form handle or take support.
I am either way Long on this setup and not worried until the stock dips below 846.
I am in this position till start of Jan, lets see

Algorithmic Momentum Trading1. Understanding Momentum in Financial Markets
Momentum trading is grounded in a simple behavioral finance principle: “trends tend to persist.” In other words, securities that have performed well in the past are likely to continue performing well in the near future, and vice versa for underperforming assets. Momentum can be measured in various ways, such as:
Price-based momentum: Observing past price performance over specific periods (e.g., 1 month, 3 months, 6 months).
Volume-based momentum: Using trading volume spikes as a signal of growing market interest.
Volatility-based momentum: Identifying assets experiencing strong directional moves with low resistance, indicating strong trend potential.
Momentum traders aim to capitalize on these trends by buying assets showing upward momentum and selling or shorting those with downward momentum. The key challenge, however, lies in accurately identifying trends early and managing the risks associated with reversals.
2. Role of Algorithms in Momentum Trading
The traditional momentum trading approach relied heavily on manual observation of charts, price patterns, and technical indicators. However, the advent of algorithmic trading has revolutionized this process. Algorithmic momentum trading uses computer programs to detect trends and execute trades automatically. Key advantages include:
Speed: Algorithms can process market data and execute trades in milliseconds, far faster than humans.
Consistency: Algorithms eliminate emotional bias, ensuring a disciplined application of the momentum strategy.
Data handling: They can monitor multiple assets, markets, and time frames simultaneously, which would be impossible manually.
Scalability: High-frequency trading (HFT) and large portfolios can be managed efficiently with algorithmic systems.
In essence, algorithmic momentum trading combines the predictive power of momentum strategies with the speed and precision of automated systems.
3. Core Momentum Trading Strategies
Algorithmic momentum trading is not a single strategy but a collection of approaches that exploit market trends. Some widely used strategies include:
3.1 Price Momentum Strategy
This strategy identifies assets that have been appreciating over a recent period. The algorithm monitors price changes over fixed intervals (e.g., daily, weekly, monthly) and generates buy signals when prices exceed certain thresholds. Typical indicators include:
Moving Averages (MA): Assets trading above their short-term moving average (e.g., 50-day MA) are considered bullish.
Relative Strength Index (RSI): RSI values above 70 suggest strong upward momentum.
Rate of Change (ROC): Measures percentage change in price over a defined period.
3.2 Volume Momentum Strategy
Volume is a leading indicator of momentum. A sudden spike in trading volume can signal that an asset is gaining interest and may continue its trend. Algorithms can scan for:
Abnormally high volume relative to historical averages.
Increasing volume during price uptrends (confirming bullish momentum).
Divergence between price and volume to anticipate reversals.
3.3 Trend-Following Strategy
Trend-following algorithms are designed to ride long-term trends rather than short-term fluctuations. Tools used include:
Moving Average Convergence Divergence (MACD): Helps identify trend direction and strength.
Bollinger Bands: Detects volatility and breakout opportunities.
Directional Movement Index (DMI): Measures the strength of a trend.
3.4 Mean-Reversion Momentum Strategy
Although seemingly contradictory, some algorithms combine momentum with mean-reversion logic. These systems detect when a rapid price move deviates significantly from historical averages, allowing traders to profit from temporary momentum before the price reverts.
4. Steps in Building an Algorithmic Momentum Trading System
Creating an effective algorithmic momentum trading system involves multiple stages:
4.1 Data Collection
Algorithms require vast historical and real-time data, including:
Historical prices and volumes.
Market news, economic indicators, and sentiment data.
Order book and level-2 data for high-frequency strategies.
4.2 Signal Generation
The algorithm identifies trade opportunities by processing the collected data through mathematical models. Common techniques include:
Technical Indicators: MA, RSI, MACD, Bollinger Bands, ROC, etc.
Statistical Models: Regression analysis, time-series forecasting, and volatility models.
Machine Learning Models: Predictive analytics using supervised or unsupervised learning.
4.3 Trade Execution
Once the algorithm identifies a signal, it executes trades automatically, ensuring:
Minimal latency to exploit price moves.
Optimal order sizing based on risk and capital allocation.
Smart order routing to reduce market impact and slippage.
4.4 Risk Management
Momentum trading algorithms incorporate strict risk controls to protect capital, such as:
Stop-loss and take-profit levels.
Position sizing rules based on volatility.
Portfolio diversification and hedging strategies.
Real-time monitoring for anomalies or system failures.
4.5 Performance Evaluation
Regular backtesting and live testing are essential to validate the algorithm’s performance. Metrics typically analyzed include:
Sharpe ratio (risk-adjusted returns).
Maximum drawdown (largest portfolio loss).
Win/loss ratio and average profit per trade.
Trade execution speed and slippage.
5. Tools and Platforms for Algorithmic Momentum Trading
To implement algorithmic momentum strategies effectively, traders rely on advanced tools and platforms:
Programming Languages: Python, R, C++, and Java are popular for coding algorithms.
Backtesting Platforms: QuantConnect, Backtrader, and MetaTrader allow simulation using historical data.
Trading APIs: Interactive Brokers, Zerodha Kite API, and Alpaca provide connectivity to exchanges.
Data Sources: Bloomberg, Reuters, Quandl, and Yahoo Finance offer reliable market data.
Machine Learning Libraries: TensorFlow, Scikit-learn, and PyTorch for predictive modeling.
6. Advantages of Algorithmic Momentum Trading
Speed and Precision: Algorithms can respond to market movements faster than human traders.
Reduced Emotional Bias: Automated systems follow rules strictly, reducing impulsive decisions.
Backtesting Capability: Strategies can be tested against historical data to optimize performance.
24/7 Market Monitoring: Especially useful in markets like cryptocurrencies that operate round the clock.
Scalability: Allows monitoring and trading across multiple instruments simultaneously.
7. Risks and Challenges
Despite its advantages, algorithmic momentum trading carries inherent risks:
7.1 Market Reversals
Momentum strategies rely on trends persisting. Sudden reversals can result in significant losses if the algorithm fails to adapt quickly.
7.2 Overfitting
Over-optimized algorithms may perform exceptionally on historical data but fail in live trading.
7.3 Latency and Slippage
Execution delays or order slippage can erode profits, particularly in high-frequency strategies.
7.4 Market Impact
Large algorithmic orders can move the market, especially in less liquid assets.
7.5 Technical Failures
Software bugs, server downtime, or data feed issues can disrupt trading operations.
8. Real-World Applications
Algorithmic momentum trading is widely used in various financial markets:
Equity Markets: Trend-following algorithms in stocks and ETFs.
Forex Markets: Momentum-based currency trading using technical indicators.
Futures and Commodities: Exploiting price trends in oil, gold, and agricultural products.
Cryptocurrencies: High-volatility assets are particularly suitable for momentum strategies.
Hedge Funds and Institutional Traders: Employ sophisticated algorithms that combine momentum with other quantitative models.
Notable firms such as Renaissance Technologies, Two Sigma, and DE Shaw are known for employing advanced momentum-based algorithms alongside other quantitative strategies.
9. Future of Algorithmic Momentum Trading
The future of momentum trading is increasingly tied to AI, machine learning, and big data analytics. Traders now leverage:
Predictive analytics: To anticipate market trends before they fully develop.
Sentiment analysis: Processing news and social media for early trend signals.
Adaptive algorithms: Systems that self-adjust based on changing market conditions.
Additionally, the rise of decentralized finance (DeFi) and cryptocurrency markets provides new avenues for momentum-based algorithms.
10. Conclusion
Algorithmic momentum trading represents a powerful fusion of human trading psychology and technological innovation. By automating trend detection, execution, and risk management, traders can exploit short-term price movements with precision and efficiency. While the strategy offers significant advantages in speed, accuracy, and scalability, it also carries risks such as market reversals, technical failures, and overfitting. Success in algorithmic momentum trading requires a careful balance of robust strategy design, sophisticated technology, rigorous backtesting, and disciplined risk management.
As markets evolve and technology advances, algorithmic momentum trading is poised to remain a cornerstone of quantitative trading strategies, blending data science, finance, and automation in an ever-more competitive financial landscape.
Risk-Free and Low-Risk Trading Strategies1. Understanding Risk in Trading
1.1 What is Trading Risk?
Trading risk refers to the potential for loss due to market fluctuations, liquidity issues, or unforeseen economic and geopolitical events. Different asset classes carry different levels of risk:
Equities: Subject to company performance, market sentiment, and macroeconomic factors.
Forex: Volatile due to leverage, geopolitical events, and central bank policies.
Derivatives: High-risk instruments due to leverage and expiration dates.
Commodities: Influenced by supply-demand imbalances, weather, and global events.
Understanding risk is crucial for creating strategies that aim to minimize exposure while ensuring growth.
1.2 Types of Risk
Traders encounter several forms of risk:
Market Risk: Fluctuations in asset prices due to macroeconomic or sector-specific factors.
Credit Risk: The possibility that a counterparty defaults on financial obligations.
Liquidity Risk: Difficulty in buying or selling an asset without affecting its price.
Operational Risk: Failures in internal systems, processes, or human error.
Systemic Risk: Large-scale financial events affecting entire markets.
Low-risk strategies are designed to reduce market and systemic risk while providing predictable returns.
2. Risk-Free vs. Low-Risk Trading
2.1 Risk-Free Trading
In reality, no investment is entirely risk-free, but some instruments are considered nearly risk-free:
Government Bonds: Especially from stable economies like U.S. Treasuries.
Bank Fixed Deposits: Insured and low volatility.
Cash Equivalents: Money market funds, Treasury bills, and other short-term instruments.
These instruments provide predictable returns with minimal exposure to market fluctuations.
2.2 Low-Risk Trading
Low-risk trading involves strategies designed to protect capital while generating small, steady profits. These strategies accept minor risks in exchange for higher liquidity, flexibility, and compounding benefits.
3. Key Principles of Low-Risk Trading
Capital Preservation: The main goal is to avoid large drawdowns.
Diversification: Spreading capital across assets reduces single-asset exposure.
Risk-Reward Management: Targeting small, consistent profits while keeping losses limited.
Position Sizing: Allocating only a small percentage of capital per trade.
Leverage Caution: Avoiding excessive leverage, which amplifies both gains and losses.
Stop-Loss Orders: Automatic exit points to prevent catastrophic losses.
Consistent Evaluation: Continuous review of performance and market conditions.
4. Popular Low-Risk Trading Strategies
4.1 Hedging Strategies
Hedging involves opening positions to offset potential losses in existing investments. Common methods include:
a) Options Hedging
Protective Put: Buying a put option on a stock you own to guard against downside.
Covered Call: Selling a call option while holding the underlying stock to earn premiums.
Example:
If you own 100 shares of a stock priced at $50 and buy a put with a $48 strike, you limit your loss to $2 per share if the stock falls.
b) Futures Hedging
Locking in prices of commodities or currencies through futures contracts.
Common among farmers, exporters, and importers to stabilize cash flows.
c) Currency Hedging
Used by traders exposed to foreign currencies.
Involves forward contracts or options to mitigate exchange rate risk.
Advantages: Reduces exposure to price fluctuations.
Disadvantages: Hedging costs (premiums) may reduce profits.
4.2 Arbitrage Strategies
Arbitrage exploits price discrepancies between markets to earn nearly risk-free profits. Types include:
a) Spatial Arbitrage
Buying an asset in one market at a lower price and selling it in another at a higher price.
Example: Gold priced differently on NY and London exchanges.
b) Triangular Forex Arbitrage
Exploiting discrepancies in currency pairs.
Example: USD/EUR, EUR/GBP, and GBP/USD cross-rates not aligned.
c) Statistical Arbitrage
Using algorithms to detect short-term mispricing in stocks or derivatives.
Relies on historical price correlations.
Advantages: Minimal market risk when executed quickly.
Disadvantages: Requires sophisticated tools, low margins, and high transaction costs.
4.3 Pair Trading
Pair trading involves going long on one asset and short on a correlated asset. The goal is to profit from relative price movements rather than absolute market direction.
Example:
Long Stock A and Short Stock B in the same industry.
If Stock A outperforms Stock B, the trade earns profit regardless of overall market movement.
Advantages: Market-neutral and reduces exposure to systematic risk.
Disadvantages: Correlation breakdowns can cause losses.
4.4 Dividend Capture Strategy
This strategy focuses on buying stocks just before the ex-dividend date and selling shortly after to collect dividends. Key points:
Works best with stable, high-dividend-paying stocks.
Requires attention to ex-dividend dates and tax implications.
Market volatility may reduce gains if stock prices drop significantly post-dividend.
Advantages: Steady income with low capital risk.
Disadvantages: Transaction costs and short-term price fluctuations can erode profits.
4.5 Low-Volatility Trading
Investing in low-volatility assets reduces exposure to sudden market swings. Techniques include:
Selecting stocks with low beta (less sensitive to market movements).
Using ETFs that track defensive sectors like utilities, healthcare, or consumer staples.
Focusing on short-term risk metrics, such as ATR (Average True Range) or standard deviation.
Advantages: Smooth returns, capital preservation.
Disadvantages: Lower upside potential compared to high-volatility trading.
4.6 Fixed-Income Laddering
Laddering involves buying bonds or deposits with staggered maturities to reduce interest rate risk. Example:
Invest $10,000 across 1-year, 2-year, and 3-year bonds.
As each bond matures, reinvest at current rates.
Advantages: Reduces interest rate risk, ensures liquidity.
Disadvantages: Returns are generally lower than equities or leveraged trades.
4.7 Trend-Following with Tight Risk Controls
Trend-following can be adapted for low-risk trading by using:
Small position sizes.
Trailing stop-loss orders to lock in profits.
Limiting trades to well-established trends in low-volatility markets.
Advantages: Potential for higher returns without excessive exposure.
Disadvantages: False breakouts can trigger small losses.
4.8 Market-Neutral Strategies
Market-neutral strategies aim for profits regardless of market direction:
Long/Short Equity: Simultaneously long undervalued stocks and short overvalued ones.
Delta-Neutral Options: Balancing options and underlying stock to eliminate directional risk.
Convertible Arbitrage: Buying convertible bonds and hedging with stock positions.
Advantages: Protects capital from systemic market movements.
Disadvantages: Complex, requires active monitoring.
5. Risk Management Tools
5.1 Stop-Loss and Take-Profit Orders
Automatic exit orders limit losses and secure profits. Types:
Fixed Stop-Loss: Predetermined price level.
Trailing Stop: Adjusts dynamically as the trade moves in favor.
5.2 Position Sizing and Capital Allocation
Risk per trade should be a small percentage of total capital (commonly 1–3%). This prevents single losses from wiping out the portfolio.
5.3 Portfolio Diversification
Spread investments across:
Asset classes: equities, bonds, commodities.
Sectors: healthcare, technology, finance.
Geographies: domestic and international markets.
5.4 Volatility-Based Risk Assessment
Use ATR, standard deviation, and beta to measure potential risk.
Adjust position sizes based on market volatility.
5.5 Hedging with Derivatives
Options and futures can protect the portfolio from adverse movements, creating synthetic risk-free exposures.
6. Implementing Low-Risk Trading in Practice
Define Your Risk Tolerance: Determine how much loss you can withstand per trade and per portfolio.
Select Suitable Assets: Focus on low-volatility, high-liquidity instruments.
Choose a Strategy: Hedging, pair trading, dividend capture, or fixed-income laddering.
Set Entry and Exit Rules: Use technical indicators or calendar events.
Monitor and Adjust: Review trades regularly and adjust stop-loss or hedge positions.
Use Technology: Automated platforms, robo-advisors, and algorithmic trading can improve execution speed and reduce human error.
Review Performance: Keep a trading journal for continuous improvement.
7. Advantages of Low-Risk Trading
Capital Preservation: Minimizes the probability of catastrophic losses.
Predictable Returns: Provides steady, compounding growth.
Lower Stress Levels: Less emotional volatility than high-risk trading.
Diversification Opportunities: Can coexist with high-risk trades for balanced portfolios.
Sustainable Strategies: Works well for long-term wealth accumulation.
8. Limitations and Considerations
Lower Returns: Conservatism comes at the cost of reduced upside potential.
Time-Consuming: Hedging and monitoring multiple positions require discipline.
Hidden Costs: Transaction fees, option premiums, and slippage can reduce profits.
Market Anomalies: Even low-risk strategies are not immune to systemic crises.
Skill Requirement: Some low-risk methods, like arbitrage, require technical expertise.
9. Case Studies
9.1 Covered Call Example
Stock XYZ trades at $100.
Sell a call option with $105 strike for $2 premium.
Stock rises to $106 → exercise the call; stock sold at $105 plus $2 premium → profit locked at $7.
Stock drops to $98 → $2 premium cushions the loss.
9.2 Pair Trading Example
Long Stock A at $50, short Stock B at $60.
After a month, Stock A rises to $55, Stock B rises to $61.
Relative gain: Stock A +$5, Stock B short -$1 → net profit $4 per share.
9.3 Bond Laddering Example
$10,000 split: $3,000 in 1-year, $3,500 in 2-year, $3,500 in 3-year bonds.
Staggered maturities reduce exposure to interest rate fluctuations and maintain liquidity.
10. Conclusion
Risk-free and low-risk trading strategies focus on capital preservation, predictable returns, and market risk mitigation. While no trading method is truly risk-free, strategies like hedging, arbitrage, pair trading, dividend capture, and fixed-income laddering significantly reduce exposure. The key lies in combining:
Disciplined risk management
Diversification across assets
Strategic use of derivatives and technical tools
By carefully implementing these methods, traders can achieve consistent returns, reduce stress, and build wealth sustainably over the long term. Low-risk trading is particularly suitable for conservative investors, retirees, and professionals seeking steady growth while protecting capital from unpredictable market events.
SBIN 1 Month Time Frame📊 1-Month Technical Summary
Overall Rating: Strong Buy
Technical Indicators:
Relative Strength Index (RSI): 71.165 – Suggests the stock is in overbought territory but still indicates buying momentum.
Moving Averages:
5-Day: ₹883.14
50-Day: ₹868.70
200-Day: ₹845.81
MACD: 5.170 – Indicates a bullish trend.
🔄 Pivot Levels (Classic Method)
Resistance Levels:
R1: ₹883.35
R2: ₹884.85
R3: ₹887.20
Support Levels:
S1: ₹879.50
S2: ₹877.15
S3: ₹875.65
Pivot Point: ₹881.00

SBINSBIN
bullish trend is Showing on the chart.
1- Buy signals in technical indicators
2- Cup with handle chart pattern.
3- Tight Range Breakout
4- Volume Consolidation
5- Trading above all key moving averages
6- Uptrend Is Still Intact
Watch for a breakout above 875/880 to sustain the bullish trend. If the resistance holds, there could be a retest towards 825/830 and an uptrend from here.

SBI 1 Day View📊 Daily Technical Indicators
RSI (14-day): 73.97 — This indicates a bullish momentum, though approaching overbought territory.
Investing.com India
MACD: 1.87 — Suggests a bullish trend continuation.
Moving Averages:
5-day: ₹871.15
50-day: ₹867.06
200-day: ₹842.74
All are above current price levels, reinforcing the bullish outlook.
📈 Intraday Levels (October 10, 2025)
Current Price: ₹879.65
Expected Range: ₹861–₹865 (Resistance) | ₹855–₹850 (Support)
A breakout above ₹865 could signal further upside momentum.
A dip below ₹850 may indicate a short-term pullback.
🔍 Summary
The daily technical indicators suggest a strong buy signal for SBI. While the RSI indicates bullish momentum, it's approaching overbought levels, which traders should monitor for potential reversals. The stock is trading above key moving averages, supporting the bullish trend. Intraday levels suggest that a breakout above ₹865 could lead to further gains, whereas a decline below ₹850 might signal a short-term correction.

SBIN 1HRSWING TRADE
- EARN WITH ME DAILY 10K-20K –
SBIN Looking good for upside..
When it break level 877.40 and sustain.. it will go upside...
BUY@ 877.40
Target
1st 886.35
2nd 894.10
FNO
SBIN OCT FUT – LOT 7 (Qty-5250)
SBIN OCT 855 CE – LOT 7 (Qty-5250)
Enjoy trading traders.. Keep add this STOCK in your watch list..
Big Investor are welcome to join the ride ..
Like this Post??? Hit like button..!!!
Follow me for FREE Educational Post and Alert..

Part 12 Trading Master Class Profit and Loss
Buyer’s profit can be unlimited (especially for call options) but the loss is limited to the premium paid.
Seller’s profit is limited to the premium received but losses can be unlimited.
Option Strategies
Traders combine calls and puts to form strategies like covered calls, straddles, strangles, spreads, etc., depending on whether they expect the market to rise, fall, or remain stable.
Uses of Options
Options are used for:
Hedging (reducing risk on existing positions)
Speculation (betting on price movements)
Income generation (through option writing)

SBI Spotted a clean symmetrical triangle breakout with 5 rejections on daily chart. Took an entry at 860 post-confirmation with strong volume support with SL near 850.

SBIN 1D Time frameCurrent Price (approx): ₹864
52-Week Low: ₹680
52-Week High: ₹880.50
Daily Chart Explanation
On the 1-day timeframe, SBIN is moving near its upper range, close to the recent high. This means the stock is strong but also facing heavy resistance.
Trend: Uptrend overall (higher highs and higher lows).
Momentum: Price is consolidating near resistance, showing hesitation.
Candles: Recent candles show wicks near the top, which means sellers are active near ₹880.
