Dark Cloud Cover - Bullish Pattern🔎 Intro / Overview
The Dark Cloud Cover is a bearish reversal candlestick pattern that appears after an uptrend .
It forms when a strong bullish candle is followed by a bearish candle that opens above the previous high but closes deep into the prior candle’s body, usually below its midpoint.
This signals that buyers are losing control and sellers are stepping in at the swing high, hinting at a possible reversal.
___________________________________________________________
📌 How to Use
- Step 1: Identify a strong bullish candle.
- Step 2: The next candle must open above the prior high but close below the midpoint → confirmation of bearish pressure.
- Step 3: Must appear at/near a swing high.
- Validation → Candle closes below the validation line.
- Devalidation → Candle closes above the devalidation line before validation.
___________________________________________________________
🎯 Trading Plan
- After pattern confirmation.
- Validation Line → Pattern Low.
- Devalidation Line → Swing High.
- Rule:
• If price closes below the validation line → Price enters Reversal Confirmation Zone .
• If price closes above the devalidation line (before validation) → Price enters Failure Zone .
This protects against false signals and ensures structured risk management.
___________________________________________________________
📊 Chart Explanation
Symbol: NSE:SBIN | Timeframe: 15 min
📌 On 26 Sep · 14:45 , the Dark Cloud Cover pattern was confirmed.
- Validation Level: 854.30 → If price closes below, pattern is validated.
- Devalidation Level: 858.10 → If price closes above (before validation), pattern is invalidated.
___________________________________________________________
👀 Observation
- Most effective after strong uptrends.
- Works best when formed at clear swing highs.
- Validation/Devalidation rules filter false signals.
___________________________________________________________
❗ Why It Matters?
- Provides a clear bearish reversal signal at swing highs.
- Rule-based entry helps traders avoid emotional decisions.
- Enhances discipline by defining zones for confirmation and failure.
___________________________________________________________
🎯 Conclusion
The Dark Cloud Cover Pattern is a reliable bearish reversal tool when combined with validation and devalidation rules.
It helps traders confirm trend reversal at the right spots while protecting against false signals.
🔥 Patterns don’t predict. Rules protect. 🚀
___________________________________________________________
⚠️ Disclaimer
📘 For educational purposes only.
🙅 Not SEBI registered.
❌ Not a buy/sell recommendation.
🧠 Purely a learning resource.
📊 Not Financial Advice.
Trade ideas

SBI long tradethis trade is planned on 4hr
as the market structure is positive we are expecting demand on the marked support areas

SBIN 1D Time frame📊 Daily Snapshot
Closing Price: ₹861.15
Day’s Range: ₹859.95 – ₹870.15
Previous Close: ₹866.20
Change: Down –0.59%
52-Week Range: ₹680.00 – ₹880.50
Market Cap: ₹794,895 crore
P/E Ratio: 10.01
Dividend Yield: 1.85%
EPS (TTM): ₹86.06
Beta: 1.00 (indicating average market volatility)
🔑 Key Technical Levels
Support Zones: ₹860.00 – ₹854.00 – ₹844.00
Resistance Zones: ₹876.00 – ₹886.00 – ₹892.00
All-Time High: ₹912.00
Fibonacci Pivot Point: ₹865.68
📈 Strategy (1D Timeframe)
1. Bullish Scenario
Entry: Above ₹876.00
Stop-Loss: ₹859.00
Target: ₹886.00 → ₹892.00
2. Bearish Scenario
Entry: Below ₹859.00
Stop-Loss: ₹866.00
Target: ₹854.00 → ₹844.00

Part 6 Learn Institutional Trading1. Advantages of Options Trading
Leverage: Control larger positions with smaller capital.
Flexibility: Numerous strategies to profit in rising, falling, or stagnant markets.
Hedging: Reduce risk of adverse price movements.
Income Generation: Selling options can generate additional income.
Defined Risk for Buyers: Buyers can only lose the premium paid.
2. Risks and Challenges in Options Trading
Complexity: Options require deep understanding; mistakes can be costly.
Time Decay (Theta): Options lose value as expiration approaches.
Market Volatility: Sudden moves can amplify losses for sellers.
Liquidity Risk: Some options have low trading volumes, making entry and exit difficult.
Leverage Risk: While leverage amplifies profits, it also magnifies losses.
3. Practical Steps to Start Options Trading
Open a Trading Account: With a SEBI-registered broker.
Understand Margin Requirements: Options may require initial margins for writing strategies.
Learn Option Greeks: Delta, Gamma, Theta, Vega, and Rho affect pricing and risk.
Practice with Simulations: Use paper trading before committing real capital.
Develop a Trading Plan: Define goals, strategies, risk tolerance, and exit rules.
Continuous Learning: Markets evolve, so staying updated is crucial.
4. The Greeks: Understanding Option Sensitivities
Option Greeks measure how the option price responds to changes in various factors:
Delta: Sensitivity to the underlying asset’s price change.
Gamma: Rate of change of delta.
Theta: Time decay impact on the option’s price.
Vega: Sensitivity to volatility changes.
Rho: Sensitivity to interest rate changes.
Greeks help traders manage risk and optimize strategies.
5. Real-World Examples of Options Trading
Example 1: Hedging with Puts
Investor holds 100 shares of a stock at ₹2,000 each.
Buys 1 put option at strike price ₹1,950 for ₹50.
If stock falls to ₹1,800, the put option gains ₹150, limiting overall loss.
Example 2: Speculation with Calls
Trader expects stock to rise from ₹1,000.
Buys a call at strike price ₹1,050 for ₹20.
Stock rises to ₹1,100, call’s intrinsic value becomes ₹50.
Profit = ₹30 per share minus premium paid.

SBIN 1D Time frame📍 Today’s Expected Range (Intraday Approximation)
Expected High: ₹861–₹865
Expected Low: ₹855–₹850
These are approximate intraday levels. Actual prices may fluctuate slightly due to volatility.
🔍 Key Points
Current price: ₹860–₹861, close to resistance.
If price breaks above ₹861–₹865 with strong volume → bullish momentum likely.
If price drops below ₹855–₹850 → short-term correction or pullback possible.
📊 Suggested Trading Strategy
Bullish Scenario
If SBIN breaks ₹861–₹865, you can buy, targeting ₹870–₹875.
Stop-loss: ₹855
Bearish Scenario
If SBIN drops below ₹855, you can sell/short, targeting ₹850–₹845.
Stop-loss: ₹860
Range-Bound / Sideways
If SBIN trades between ₹855–₹861, it’s better to wait and avoid trading until a clear breakout occurs.
💡 Summary
Resistance Zone: ₹861–₹865
Support Zone: ₹855–₹850
Strategy: Trade in the direction of the breakout, and always use stop-loss to manage risk.

SBI: Strong Q1 Performance Breaks Key ResistanceTechnical Analysis
State Bank of India has demonstrated impressive technical progression with a super bullish rally that culminated in creating an All-Time High of ₹912 in June 2024. This historic peak marked the zenith of a remarkable multi-year uptrend that established SBI as one of the top-performing banking stocks.
However, from the ATH levels, the stock entered a corrective phase, continuously falling while creating lower highs - a classic bearish pattern that concerned many investors. The recent lower high was formed at ₹840, which acted as formidable resistance multiple times, creating a critical supply zone that tested the stock's recovery momentum.
The game-changing catalyst arrived with the announcement of strong Q1 FY26 results, showcasing record profitability and robust operational metrics. These stellar quarterly numbers provided the momentum needed to finally break above the stubborn ₹840 resistance level on September 17th, 2025, with strong volume confirmation.
Currently trading at ₹862, the stock has successfully conquered the ₹840 resistance zone that had been acting as a ceiling for months. If this breakout sustains and the previous resistance transforms into robust support, the technical setup appears highly favorable for the next leg of rally toward the ATH levels.
Entry Strategy: Enter on any dips toward ₹840-850 range, ensuring the old resistance holds as new support with volume confirmation.
Targets:
Target 1: ₹880
Target 2: ₹900
Target 3: ₹920
Stop Losses:
Critical Stop: ₹840 (previous resistance, now key support)
If market doesn't sustain above ₹840 levels, no more expectations on this stock.
Q1 FY26 Financial Highlights (vs Q4 FY25 & Q1 FY25)
Total Income: ₹1,25,729 Cr (↓ -1.0% QoQ from ₹1,26,997 Cr; ↑ +6.3% YoY from ₹1,18,242 Cr)
Total Interest: ₹78,266 Cr (↑ +0.05% QoQ from ₹78,227 Cr; ↑ +9.2% YoY from ₹71,701 Cr)
Total Expenses: ₹59,496 Cr (↓ -20.1% QoQ from ₹74,438 Cr; ↑ +10.2% YoY from ₹53,996 Cr)
Operating Profit: ₹-12,034 Cr (Better QoQ from ₹-25,668 Cr; Improved YoY from ₹-7,455 Cr)
Profit Before Tax: ₹29,229 Cr (↑ +8.7% QoQ from ₹26,897 Cr; ↑ +10.6% YoY from ₹26,428 Cr)
Profit After Tax: ₹22,121 Cr (↑ +8.5% QoQ from ₹20,379 Cr; ↑ +10.1% YoY from ₹20,094 Cr)
Diluted EPS: ₹23.76 (↑ +8.2% QoQ from ₹21.96; ↑ +9.7% YoY from ₹21.65)
Fundamental Highlights
State Bank of India delivered exceptional Q1 FY26 performance with PAT surging 10.1% YoY to ₹22,121 crore, demonstrating remarkable resilience and operational excellence. SBI remained the top performer among PSBs, contributing 43% of total Q1 earnings with net profit of ₹19,160 crore, marking a 15% YoY increase, solidifying its position as India's most profitable bank.
Public sector banks collectively posted record profit of ₹44,218 crore in Q1 FY26, with SBI leading this historic performance, reflecting the banking sector's robust health and SBI's dominant market position. Market cap stands at ₹7,95,909 crore (up 9.17% in 1 year) with stable fundamentals supporting long-term growth.
SBI's loan portfolio grew 11.61% YoY to ₹42.5 lakh crore, with retail and SME segments outperforming, demonstrating strong credit demand across sectors. The bank's diversified loan book provides stability while capturing high-growth opportunities in priority sector lending.
SBI reported net profit of ₹212.01 billion for Q1 FY26, up 9.7% YoY, maintaining its position as India's largest lender. This consistent profitability growth validates the bank's strategic focus on operational efficiency and risk management excellence.
With resilient economic activity, credit demand remained strong with advances growing 15.24% to ₹37.68 lakh crore in FY2024, positioning SBI to capitalize on India's economic expansion and infrastructure development boom.
Public sector banks show stable credit growth of 12.2% in FY25, with SBI leading the charge in capturing market share through competitive pricing and superior customer service. Operating expenses were well-managed through improved operating leverage and digital transformation initiatives.
The banking sector benefits from strong economic growth, rising disposable incomes, increasing consumerism and digital adoption driving transformation in 2025. SBI's report anticipates loan to GDP ratio increasing from 1.2 in FY23 to 1.7 in FY24, guaranteeing prolonged GDP expansion.
Cost management excellence reflected in controlled expense growth while revenue maintained steady levels, showcasing operational leverage benefits. Strong asset quality metrics and improved NIMs position SBI for sustained profitability growth in the evolving banking landscape.
Conclusion
State Bank of India's outstanding 10.1% YoY PAT growth and successful breakout above ₹840 resistance creates compelling technical and fundamental convergence. The bank's market leadership position, record Q1 profitability contributing 43% of total PSB earnings, and strong sectoral tailwinds from India's economic growth provide robust backing for sustained rally. Critical support at ₹840 breakout level must sustain for continued bullish momentum toward the ₹920 target zone. As India's largest and most profitable bank, SBI remains well-positioned to capitalize on the credit growth cycle and digital banking revolution.
Disclaimer: tinyurl.com

SBI (Weekly) - Breakout of sideways trendState Bank of India (SBI) has shown a significant bullish development this week, decisively breaking out of a key angular resistance trendline that has been in place since July 2024. This breakout, which follows a prolonged consolidation phase after its All-Time High in June 2024, was confirmed by a strong +4.71% price increase on the back of massive trading volume.
Confirmation from Multiple Indicators 👍
The positive outlook is strongly supported by several technical signals, suggesting a high degree of conviction in the recent move:
- Volume Surge: The breakout was accompanied by exceptionally high volume , indicating significant buying interest. The general trend of rising volume further validates the move.
- Momentum Indicators: Both the short-term Exponential Moving Averages (EMAs) and the Relative Strength Index (RSI) have entered a state of positive crossover, providing dual confirmation of building bullish momentum.
Outlook
Given the strength of the breakout and the confluence of bullish indicators, the path of least resistance appears to be upward. However, monitoring the price action in the upcoming week will be crucial to confirm that this breakout is sustained and not a false move.

SBI: Strong Q1 Performance Breaks Key Resistance🔍 Technical Analysis
State Bank of India has demonstrated impressive technical progression with a super bullish rally that culminated in creating an All-Time High of ₹912 in June 2024. This historic peak marked the zenith of a remarkable multi-year uptrend that established SBI as one of the top-performing banking stocks.
However, from the ATH levels, the stock entered a corrective phase, continuously falling while creating lower highs - a classic bearish pattern that concerned many investors. The recent lower high was formed at ₹840, which acted as formidable resistance multiple times, creating a critical supply zone that tested the stock's recovery momentum.
The game-changing catalyst arrived with the announcement of strong Q1 FY26 results, showcasing record profitability and robust operational metrics. These stellar quarterly numbers provided the momentum needed to finally break above the stubborn ₹840 resistance level on September 17th, 2025, with strong volume confirmation.
Currently trading at ₹862, the stock has successfully conquered the ₹840 resistance zone that had been acting as a ceiling for months. If this breakout sustains and the previous resistance transforms into robust support, the technical setup appears highly favorable for the next leg of rally toward the ATH levels.
Entry Strategy: Enter on any dips toward ₹840-850 range, ensuring the old resistance holds as new support with volume confirmation.
🎯 Targets:
Target 1: ₹880
Target 2: ₹900
Target 3: ₹920
🚫 Stop Losses:
Critical Stop: ₹840 (previous resistance, now key support)
If market doesn't sustain above ₹840 levels, no more expectations on this stock.
💰 Q1 FY26 Financial Highlights (vs Q4 FY25 & Q1 FY25)
Total Income: ₹1,25,729 Cr (↓ -1.0% QoQ from ₹1,26,997 Cr; ↑ +6.3% YoY from ₹1,18,242 Cr)
Total Interest: ₹78,266 Cr (↑ +0.05% QoQ from ₹78,227 Cr; ↑ +9.2% YoY from ₹71,701 Cr)
Total Expenses: ₹59,496 Cr (↓ -20.1% QoQ from ₹74,438 Cr; ↑ +10.2% YoY from ₹53,996 Cr)
Operating Profit: ₹-12,034 Cr (Better QoQ from ₹-25,668 Cr; Improved YoY from ₹-7,455 Cr)
Profit Before Tax: ₹29,229 Cr (↑ +8.7% QoQ from ₹26,897 Cr; ↑ +10.6% YoY from ₹26,428 Cr)
Profit After Tax: ₹22,121 Cr (↑ +8.5% QoQ from ₹20,379 Cr; ↑ +10.1% YoY from ₹20,094 Cr)
Diluted EPS: ₹23.76 (↑ +8.2% QoQ from ₹21.96; ↑ +9.7% YoY from ₹21.65)
🧠 Fundamental Highlights
State Bank of India delivered exceptional Q1 FY26 performance with PAT surging 10.1% YoY to ₹22,121 crore, demonstrating remarkable resilience and operational excellence. SBI remained the top performer among PSBs, contributing 43% of total Q1 earnings with net profit of ₹19,160 crore, marking a 15% YoY increase, solidifying its position as India's most profitable bank.
Public sector banks collectively posted record profit of ₹44,218 crore in Q1 FY26, with SBI leading this historic performance, reflecting the banking sector's robust health and SBI's dominant market position. Market cap stands at ₹7,95,909 crore (up 9.17% in 1 year) with stable fundamentals supporting long-term growth.
SBI's loan portfolio grew 11.61% YoY to ₹42.5 lakh crore, with retail and SME segments outperforming, demonstrating strong credit demand across sectors. The bank's diversified loan book provides stability while capturing high-growth opportunities in priority sector lending.
SBI reported net profit of ₹212.01 billion for Q1 FY26, up 9.7% YoY, maintaining its position as India's largest lender. This consistent profitability growth validates the bank's strategic focus on operational efficiency and risk management excellence.
With resilient economic activity, credit demand remained strong with advances growing 15.24% to ₹37.68 lakh crore in FY2024, positioning SBI to capitalize on India's economic expansion and infrastructure development boom.
Public sector banks show stable credit growth of 12.2% in FY25, with SBI leading the charge in capturing market share through competitive pricing and superior customer service. Operating expenses were well-managed through improved operating leverage and digital transformation initiatives.
The banking sector benefits from strong economic growth, rising disposable incomes, increasing consumerism and digital adoption driving transformation in 2025. SBI's report anticipates loan to GDP ratio increasing from 1.2 in FY23 to 1.7 in FY24, guaranteeing prolonged GDP expansion.
Cost management excellence reflected in controlled expense growth while revenue maintained steady levels, showcasing operational leverage benefits. Strong asset quality metrics and improved NIMs position SBI for sustained profitability growth in the evolving banking landscape.
✅ Conclusion
State Bank of India's outstanding 10.1% YoY PAT growth and successful breakout above ₹840 resistance creates compelling technical and fundamental convergence. The bank's market leadership position, record Q1 profitability contributing 43% of total PSB earnings, and strong sectoral tailwinds from India's economic growth provide robust backing for sustained rally. Critical support at ₹840 breakout level must sustain for continued bullish momentum toward the ₹920 target zone. As India's largest and most profitable bank, SBI remains well-positioned to capitalize on the credit growth cycle and digital banking revolution.

SBIN 1D Time frameCurrent Facts
Price is trading around ₹854–₹861.
In the past 52 weeks, it has moved between ₹680 (low) and about ₹875–₹880 (high).
Recently, the stock has shown a positive trend, moving up slowly but facing resistance near the higher levels.
🔍 Support & Resistance Zones
Immediate Support: ₹840–₹846 (if it stays above this, trend remains safe).
Stronger Support: ₹820–₹830 (this is the fallback level if the first support breaks).
Immediate Resistance: ₹860–₹869 (the stock is struggling to cross this zone).
Higher Resistance: ₹880–₹900 (if it breaks out strongly, these are the next targets).
⚙️ Technical View
Trend is positive to neutral — buyers are active but sellers are pushing back at resistance.
Momentum is moderate — not too weak, not too overheated.
A decisive breakout above ₹869 with volume can give a rally toward ₹880–₹900.
⚠️ Risks
If the price falls below ₹840, there is a chance of decline toward ₹820–₹830.
Weak breakout attempts without strong buying may cause sideways movement.
🔮 Possible Scenarios
Bullish: Strong move above ₹869 → targets ₹880–₹900.
Range: Stock stays between ₹840–₹860.
Bearish: Break below ₹840 → fall toward ₹820–₹830.

SBIN 1D Time frameCurrent Stock Price
Current Price: ₹842.25
Day’s Range: ₹831.00 – ₹845.80
52-Week Range: ₹680.00 – ₹875.45
Market Cap: ₹7.68 lakh crore
P/E Ratio: 9.77
EPS (TTM): ₹86.06
Dividend Yield: 1.91%
Book Value: ₹527.66
📈 Trend & Outlook
Short-Term Trend: Bullish; trading above key support levels and showing positive momentum.
Resistance Levels: ₹845.80 (day’s high), ₹875.45 (52-week high)
Support Levels: ₹831.00 (day’s low), ₹818.32 (weekly pivot)
Investor Sentiment: Positive, with institutional interest and favorable outlook.
🧭 Key Notes
Immediate support around ₹831–₹818; if it holds, price may rise toward resistance.
If it drops below ₹818, downside may extend toward ₹800 or lower.
Overall, bulls are slightly stronger, but watch resistance near ₹845–₹875.
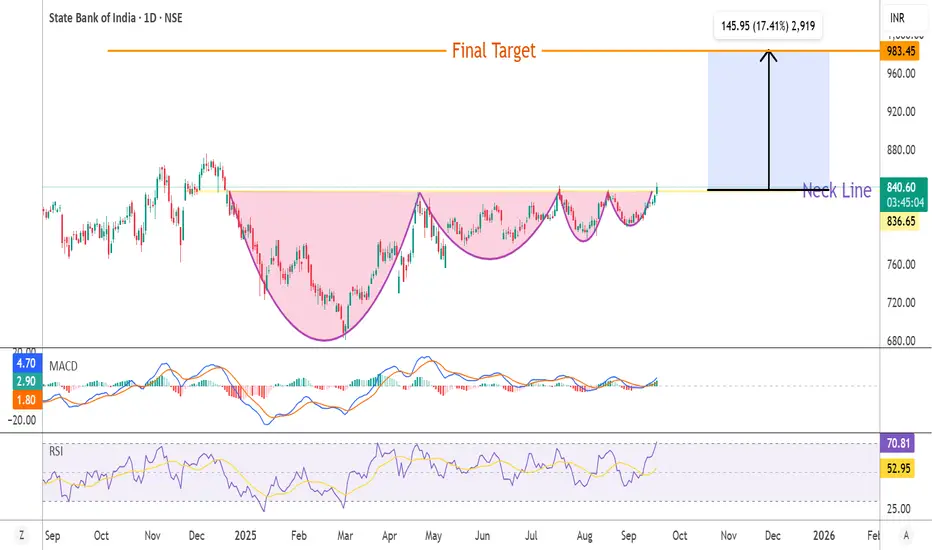
Complex Cup & Handle Pattern Breakout in SBISBI given Complex CUP & HANDLE Pattern Breakout on Daily & Weekly Chart from Neckline arround 840 .Stock also trading above all important moving averages (20,50,100,200).RSI & MACD also showing positive momentum .Target of this breakout will be arround 980 with a stoploss of 800 Rs.
it's not buy or sell call ...for education only
SBIN 1D Time frameCurrent Price Action (Daily Chart)
Price Range: Stock is moving between ₹815 – ₹830 right now.
Trend: Consolidation with mild bullish bias.
Key Levels
Immediate Resistance: ₹830
Next Resistance: ₹840 – ₹850
Major Resistance: Around ₹875 (previous high)
Immediate Support: ₹815 – ₹820
Strong Support: ₹800 – ₹805
Critical Support: ₹785

SBIN 1D Time frame📉 Current Market Snapshot
Closing Price: ₹823.55
Day's Range: ₹819.80 – ₹825.80
52-Week High: ₹875.45
52-Week Low: ₹680.00
Market Cap: ₹7,60,188 crore
P/E Ratio (TTM): 9.57
P/B Ratio: 1.47
Dividend Yield: 1.93%
EPS (TTM): ₹86.06
Book Value: ₹527.66
Face Value: ₹1.00
Volume: 5,078,018 shares
VWAP: ₹822.84

SBIN 1D Time frame📍 Current Price
₹823.30 (down 0.06% from previous close)
Short-Term Outlook
Bullish Scenario: A sustained move above ₹836 could lead to a test of the 52-week high around ₹875.50.
Bearish Scenario: A drop below ₹785.10 may signal a potential pullback toward ₹794.00.

SBIN 1D Time frame🔢 Current Level
Trading around ₹823.65
🔑 Key Resistance & Support Levels
Resistance Zones:
₹825.00 – ₹830.00 (recent highs; breakout above this may lead to further upside)
₹835.00 – ₹840.00 (stronger resistance above)
Support Zones:
₹815.00 – ₹820.00 (immediate support; failure to hold above this may lead to a decline)
₹810.00 – ₹815.00 (short-term support; a break below this could indicate weakness)
₹800.00 – ₹805.00 (deeper support zone if price dips further)
📉 Outlook
Bullish Scenario: If SBIN holds above ₹820.00, upward momentum may continue. Break above ₹830.00 can open the way toward ₹840.00+.
Bearish Scenario: If it falls below ₹800.00, risk increases toward ₹790.00 – ₹795.00.
Neutral / Range: Between ₹820.00 – ₹830.00, SBIN may consolidate before a directional move.

SBIN 1D Time frame🔢 Current Level
Trading around ₹823.65 - ₹825.00
🔑 Key Resistance & Support Levels
Resistance Zones:
₹824 – ₹826 (recent highs; breakout above this may lead to further upside)
₹830 (psychological resistance)
₹840 – ₹850 (stronger resistance above)
Support Zones:
₹820 – ₹822 (immediate support; failure to hold above this may lead to a decline)
₹810 (short-term support; a break below this could indicate weakness)
₹800 – ₹805 (deeper support zone if price dips further)
📉 Outlook
Bullish Scenario: If SBIN holds above ₹822, upward momentum may continue. Break above ₹826 can open the way toward ₹830+.
Bearish Scenario: If it falls below ₹810, risk increases toward ₹800 – ₹805.
Neutral / Range: Between ₹822 – ₹826, SBIN may consolidate before a directional move.

SBIN 1H Time framePrice Snapshot
Current price around : ~ ₹818
52-week high/low: ~ ₹875 / ₹680
Recent price action: modest upside from support, but resistance overhead
📈 Indicators & Momentum (Hourly Approx)
Moving Averages (short-period) are just below current price → giving support
Medium/longer hourly MAs (20-50 hr) are above → resistance zones
RSI (1-hour): neutral to slightly bullish, not overbought yet
Momentum indicators show mild strength but not a breakout — watching for volume to confirm
🧭 Short-Term Outlook
Bullish scenario: If SBI holds above ~₹820 and breaks past ~₹825-830, upward target could be ~₹840+
Bearish scenario: If it loses support around ~₹805-810, risk of pullback toward ~₹800 or below
Bias: Slightly bullish in the short term, provided support holds and resistance tests are successful

SBIN 30Minutes Time frame📍 SBIN – 30M Important Levels (Current)
🔹 Support Zones
820 – 825 → Immediate intraday support
805 – 810 → Strong support zone; buyers likely to defend
790 – 795 → Major support; breakdown here may trigger deeper downside
🔹 Resistance Zones
840 – 845 → Immediate intraday resistance
855 – 860 → Strong resistance; breakout may extend upside momentum
875 – 880 → Major resistance; if crossed, can fuel a bigger rally
⚖️ 30M Trend Outlook
SBIN is currently in a range-bound to bullish phase on the 30M chart.
Holding above 825 keeps the short-term bias positive.
Breakout above 845 may target 860 – 880.
Breakdown below 825 may pull it back toward 810 – 795.

SBI Stock Analysis: Support Levels and Potential ReboundSBI's stock has returned to a support level of ₹732, with a potential entry point at the long-term 3-year trendline around ₹670, following a recent 15% drop. State Bank of India's Q3FY25 net profit grew 84.32% YoY to ₹16,891 crore7. The bank's loan book also experienced substantial growth, with a YoY increase of 15.8%

SBIN Next 2 Yrs Expected Move
Business Model of the State Bank of India (SBI)
**1. Core Business Segments & Customer Segments**
SBI caters to a diverse clientele including retail consumers, small and medium enterprises (SMEs), large corporates, and government bodies. Customized financial products and services are tailored to the needs of each segment—from personal banking and loans for individuals, to structured lending and advisory services for corporates and institutions
**2. Wide Network & Digital Platforms**
A cornerstone of SBI’s value proposition is its expansive physical and digital reach—boasting over 22,000 branches and 58,000 ATMs. Digital innovations, notably the **YONO** platform (“You Only Need One”), offer integrated services including banking, e-commerce, travel bookings, and bill payments. YONO has emerged as a significant digital lending channel, providing seamless end-to-end services.
**3. Hybrid Strategy: Traditional + Digital**
SBI’s business model has evolved from a predominantly branch-centric system to a hybrid framework combining legacy infrastructure with advanced digital technologies. Leveraging machine learning and deep learning algorithms, the bank has optimized credit risk assessment, fraud detection, and personalized customer offerings.
**4. Relationship-Based Corporate Banking**
The Corporate Accounts Group (CAG) exemplifies SBI’s high-touch approach—relationship managers lead cross-functional teams to deliver integrated financial solutions to top corporates, including structured products, cash management, and project finance. SBI also supports financial institutions through IPO handling, transaction accounts, and custody services.
**5. Revenue Streams & Economies of Scale**
SBI generates income from interest spreads on deposits, advances, and investments. The bank benefits from economies of scale due to its vast network and customer base, allowing it to offer competitive rates and drive down costs. Notable financial performance includes record-breaking profits—such as USD 9.2 billion in FY25, largely fueled by digital revenues.
**6. Focus on Financial Inclusion & Social Credit**
A leader in financial inclusion, SBI has played a pivotal role in initiatives like the Pradhan Mantri Jan Dhan Yojana, helping open hundreds of millions of basic banking accounts and providing access to financial services in underbanked areas.
It also promotes rural development through programs like *SBI Youth for India*, fostering social entrepreneurship via grassroots fellowships.
**7. Digital Transformation & Strategic Partnerships**
SBI partnered with IBM to enhance its YONO platform using advanced analytics and cloud technology. This collaboration contributed to a valuation of USD 40–50 billion for the YONO ecosystem within three years.
**8. Sustainability & ESG Lending**
To support green initiatives, SBI entered a €100 million green finance agreement with AFD at its GIFT City branch. This aligns with SBI’s goal of boosting its green lending portfolio to 7.5–10% of its domestic advances by 2030.
**9. Customer Experience & Workforce Strategy**
Recognizing the importance of branch-level engagement despite digital expansion, SBI recruited over 13,400 Junior Associates (plus 3,000 officers) to enhance customer service, reduce waiting times, and streamline operations.
---
**Summary:**
SBI’s business model blends a vast physical presence, strong relationship-driven corporate services, accelerated digital innovations (via platforms like YONO), and a commitment to inclusion and sustainability. It has leveraged technology partnerships, institutional scale, and strategic human resources planning to maintain India’s largest banking platform while delivering modern, diversified financial solutions.
---

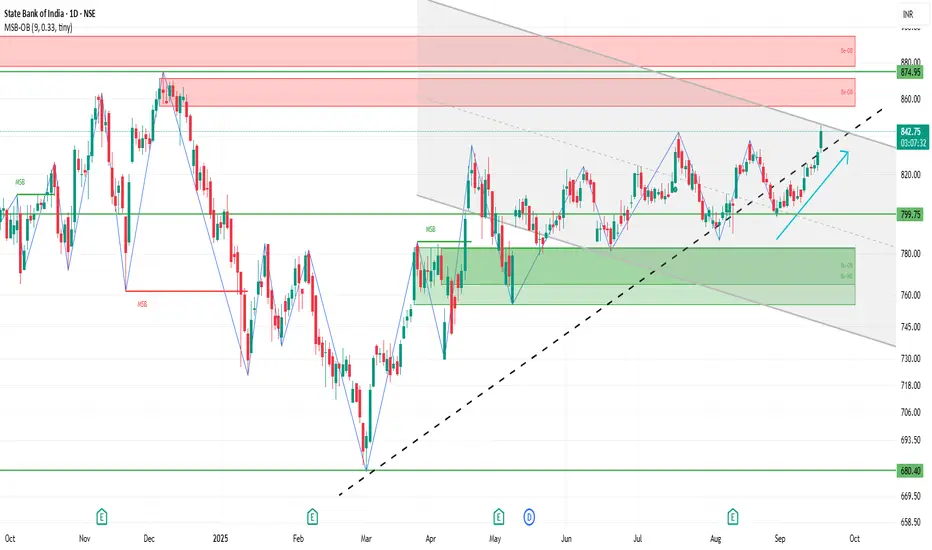
SBI Price Action & Option Opportunity State Bank of India (SBI) is once again respecting its well-defined range on the daily chart, with price consolidating between the ₹780 and ₹840 support-resistance zone. Today, SBI closed at ₹807.85, down -1.05%, continuing its oscillation within this horizontal channel.
The chart shows potential for a bounce from the lower boundary near ₹800, with a dotted path illustrating a possible move back toward resistance. Traders may look for confirmation of reversal before initiating new long trades as the range continues to hold.
On the options side, the 30 SEP 2025 PUT 810 contract surged 41.67% today, closing at ₹13.60. This strike has given a move of ₹2.75 (over 20%) recently. This sudden spike suggests rising bearish sentiment or hedging activity, but also hints at possible premium profit-taking if SBI holds above support.
Trading Plan
Monitor SBI near ₹800 for signs of reversal or breakdown.
Long positions can target ₹840 if support holds, with stops below ₹780.
PUT options holders should watch for profit booking if a bounce appears.

SBINSBIN is looking good.
It gave a clean breakout above an old resistance zone. After the breakout, it pulled back to retest the level, and during this retest it respected the previous swing low at ₹781.70. Not breaching this level shows strong demand holding.
It is moving above all key EMAs, more importantly it is moving above 200ema for the last 3 months - which confirms the strength of the broader uptrend.
Volume is good and this reduces the there is probability of a false breakout.
In between it may halt around 858, 880 and 894, previous resistance levels.
✅ If you like my analysis, please follow me as a token of appreciation :)
in.tradingview.com/u/SatpalS/
📌 For learning and educational purposes only, not a recommendation. Please consult your financial advisor before investing.

Trading Master Class With ExpertsRisk and Reward in Options
Options provide defined risk for buyers and potential risk for sellers:
Buyers: Maximum loss = premium paid, profit = theoretically unlimited for calls, limited for puts.
Sellers (writers): Maximum profit = premium received, risk = potentially unlimited for uncovered calls, high for puts.
Example:
Selling a call without owning the stock (naked call) can lead to unlimited losses if the stock skyrockets.
Buying a put limits risk but can still profit from sharp downward moves.
Hedging with Options
Options are a powerful tool for hedging investments:
Protective Put: Buying a put on a stock you own protects against a decline.
Collar Strategy: Buy a put and sell a call to limit both upside and downside risk.
Portfolio Insurance: Large investors use index options to protect portfolios during market volatility.
