SBIN Blueprint
---
### **State Bank of India (SBI) – Overview**
* **Type:** Public Sector Bank (PSB)
* **Founded:** 1806 (as Bank of Calcutta), renamed SBI in 1955
* **Headquarters:** Mumbai, India
* **Presence:** 20,000+ branches and 60,000+ ATMs across India
---
### **Business Model**
SBI operates on a **classic banking business model**:
1. **Deposit & Lending**
* Collects money from customers via **savings accounts** and **fixed deposits**.
* Lends these funds as **loans** to individuals and businesses.
* Main profit comes from the **difference between loan interest and deposit interest**.
2. **Retail Banking**
* Services for individual customers:
* Current & Savings Accounts
* Home, Personal, and Car Loans
* Debit/Credit Cards, Net & Mobile Banking
3. **Corporate Banking**
* Services for businesses:
* Working Capital Loans
* Trade Finance (Import/Export)
* Cash Management Services
4. **Investment & Treasury**
* Sells Government Bonds, Mutual Funds, and Insurance products.
* Treasury operations (Forex trading, govt securities) generate additional income.
5. **Other Services**
* Insurance: Life & General (SBI Life, SBI General)
* Mutual Fund Distribution
* Demat & Wealth Management
---
### **Key Points**
* Main revenue sources: **interest income** and **fees & commissions**.
* Focuses on **financial inclusion**, reaching rural and semi-urban areas.
* Government of India owns approximately **57% stake**.
---
Trade ideas

SBIN will be Bullish or BearishSBIN if sustain above the green line will move upward or will come down to 814.
**Not a buy / sell recommendation. Do your own research

SBI, Reverse Head & Shoulder Pattren breakout & Retesting ...SBI given Reverse Head & Shoulder Pattren breakout from 784 & after giving breakout retesting
breakout zone & taken support on 200 EMA level ..one can keep strict stoploss of 784 for target of 835 & 875

SBIN looking bullish on the weekly charts. (18/08/2025)State Bank of India is trading around the resistance zone after convincingly breaking the trendline and taking support from the weekly moving averages.
The stock has closed at 826.55 this week gaining 2.77% week on week.
If the stock starts trading above 833, there are chance of it travelling till 860 levels in the coming month.
SBIN has posted good result as well.
Major resistance :- 833, 865
Entry :- Above 833
SL :- Below 818
The stock looks bullish on the daily and the weekly charts.
Wait for the stock to close above the resistance levels on the daily chart frame.

SBIN BullishSBIN 826 is in bullish 3rd leg and Volume suggests a breakout of 819. We expect target 873 in coming days. Analysts suggests it could test 970 which coincide with Cypher pattern formation target .

SBIN Future MoveState Bank of India (SBI) operates as India’s largest public sector bank, offering retail, corporate, digital, and international banking services. Its business model focuses on deposits mobilization, lending, treasury operations, and fee-based services, supported by a vast branch network, digital platforms, and subsidiaries in insurance, asset management, and investment banking.

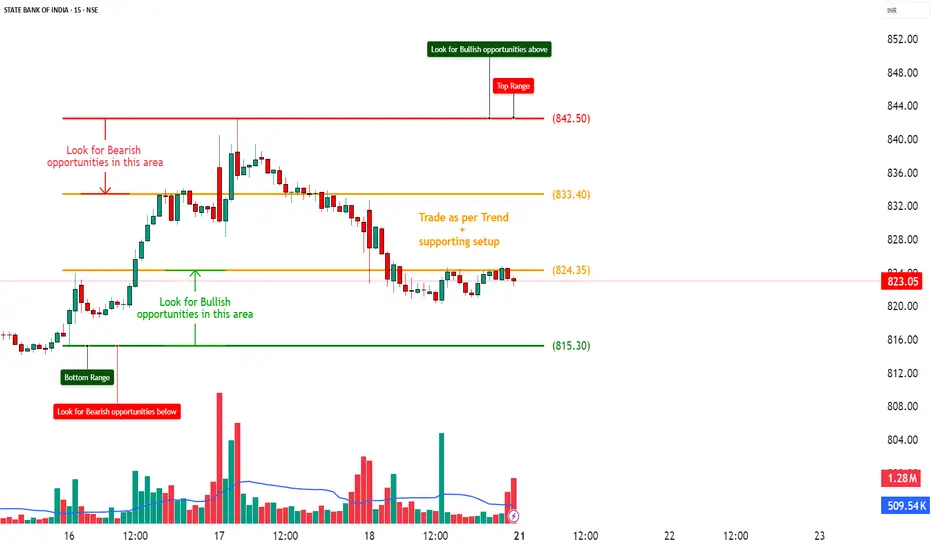
SBIN – Bearish Bias with Heavy CE Shorts and Weak Call Structure________________________________________________________________________________📈 SBIN – Bearish Bias with Heavy CE Shorts and Weak Call Structure
📅 Setup Date: 17.07.2025 | ⏱ Timeframe: Daily
📍 Strategy: Short-Term Bearish Momentum Setup with Defined Risk
________________________________________________________________________________
🔍 Overall View
Spot Price: ₹823.35
Trend: Mildly Bearish – Spot facing resistance at 830–840 with weak CE premiums
Volatility: IV ~18%–22% (stable to slightly elevated)
Ideal Strategy Mix: Bearish directional trades or credit spreads near resistance
________________________________________________________________________________
1️⃣ Bullish Trade (Contrarian Setup)
Best CE: Buy 820 CE @ ₹12.65
Why:
• ATM strike with highest delta (0.56) among CEs
• Smallest short build-up in CE chain (OI ↑0.73%, vs ~+4%–12% on other CEs)
• If spot reclaims 830+, this option will respond fastest
• IV is lowest (17.73%) = cheapest in premium vs other strikes
Contrarian Setup – Not ideal unless spot crosses 830 with strong volume
________________________________________________________________________________
2️⃣ Bearish Trade
Best PE: Buy 820 PE @ ₹8.65
Why:
• Strong Long Build-Up (+29.5% OI), volume-led spike (+46.6%)
• Solid delta (-0.44) with decent Vega → responds well to downside
• IV is relatively low (19.6%), allowing room for expansion
• Ideal strike as spot sits slightly above – quick delta pickup expected
________________________________________________________________________________
3️⃣ Strategy Trade (As per trend + OI data)
Strategy: Bear Put Spread → Buy 820 PE / Sell 800 PE
→ ₹8.65 / ₹3.00
Net Debit: ₹5.65
Max Profit: ₹20 – ₹5.65 = ₹14.35
Max Loss: ₹5.65
Risk:Reward: ≈ 1 : 2.54 ✅
Lot Size: 750
Total Risk: ₹4,237.50
Max Profit: ₹10,762.50
📊 Breakeven Point: ₹814.35
📉 Exit If: Spot closes above ₹832 (invalidates PE strength and bearish structure)
________________________________________________________________________________
Why:
• Heavy CE short build-up across 820–850 strikes (Bearish Call Ladder)
• 820 PE has strong long buildup + clean delta = momentum PE
• 800 PE still holding OI, good strike to sell for defined risk
• IVs are still in mid-range = spread cost low, R:R > 1:2.5
________________________________________________________________________________
📘 My Trading Setup Rules
Avoid Gap Plays
→ Check pre-open price action to avoid trades influenced by gap-ups/gap-downs.
Breakout Entry Only
→ Enter trades only if price breaks previous day’s High (for bullish trades) or Low (for bearish trades).
Watch Volume for Confirmation
→ Monitor volume closely. No volume = No trade.
Enter on Strong Candle + Volume
→ Execute the trade only if a strong candle appears with increasing volume in the direction of the trade.
Defined Risk:Reward Only
→ Take trades only if R:R is favourable (ideally ≥ 1:2).
Premium Disclaimer
→ Option premiums shown are based on EOD prices — real-time premiums may vary during execution.
Time Frame Preference
→ Trade with your preferred time frame — this strategy works across intraday or positional setups.
________________________________________________________________________________
⚠ Disclaimer (Please Read):
• These Trades are shared for educational purposes only and is not investment advice.
• I am not a SEBI-registered advisor.
• The information provided here is based on personal market observation.
• No buy/sell recommendations are being made.
• Please do your own research or consult a registered financial advisor before making any trading decisions.
• Trading involves risk. Always use proper risk management.
I am not responsible for trading decisions based on this post.
________________________________________________________________________________
SBIN - Correction to start ?Bearish Divergences in Technical indicators.
Elliot Impulse wave complete (1-2-3-4-5)
Elliot A & B are complete, C wave to start.
Trendline breakdown and re-testing almost complete.

State Bank Of India ---- Deep Analysis________________________________________
Technical Research Report on SBI (NSE: SBIN)----------
Segment: Equity – Large Cap
Sector: Banking – PSU
Analyst: Hitesh Tailor
Date: July 29, 2025
Time Frames Analyzed: Daily Time Frame
________________________________________
1. Performance Summary--------------
State Bank of India (SBIN) is currently at a key technical levels. The stock recently showed a bearish divergence on the RSI while approaching an extreme orderblock near ₹840.60. A rejection from this level with divergence confirmation indicates potential downside towards the imbalance zone and deeper OB + FVG zones. Currently trading around ₹798.30, the bias is cautious bearish for swing traders.
________________________________________
2. Stock Profile--------------
Parameter Details
Company Name State Bank of India (SBI)
Ticker Symbol SBIN (NSE)
Sector PSU Banks
Market Cap ₹6.5+ Lakh Crores (approx.)
52 Week High/Low ₹899.65 / ₹666.30
CMP (as of July 29, 2025) ₹799.20
________________________________________
3. Chart Setup & Timeframe Analysis----------
A. Daily Timeframe
• Trend: Recent lower high and lower low structure (LL)
• Pattern: Bearish RSI divergence + rejection from Order Block (OB) zone
• Support Zone: ₹770 – ₹760 (Gap imbalance support zone)
• Resistance Zone: ₹840.60 – ₸899.65 (OB and extreme resistance)
• Price Action View: Price rejected from OB with clear bearish divergence and a breakdown below short-term structure. Weakness expected until FVG zone.
B. Weekly Timeframe
• Trend Continuity: Mixed. Long-term trend intact, but facing supply pressure near 52-week highs
• Price Relative to EMA: Trading near 200 EMA; watching for hold or breakdown
C. Intraday 1H Timeframe
• Outlook: Price showing LH-LL structure. Short-term liquidity grab may occur before downside continuation.
________________________________________
4. Technical Indicators-----------------
Indicator Observation
Moving Averages Price below 20 EMA but above 200 EMA – Neutral to Bearish
RSI (14) ~42 with bearish divergence (daily)
MACD -- Not analyzed
Volume -- Not Analyzed
Bollinger Bands -- Not Analyzed
________________________________________
5. Key Technical Levels------------
Type Price (₹)
Immediate Support 770.00
Major Support 700.00 (OB + FVG)
Resistance 1 840.60
Resistance 2 899.65
CMP 798.30
________________________________________
6. Trade Idea / Recommendation-------------
Swing Sell Setup (1–2 Weeks)
• Sell Zone: ₹800 – ₹820
• Target 1: ₹770.00
• Target 2: ₹700.00
• Stop Loss: ₹845.00
• Risk-Reward Ratio: Approx. 1:2.5
Bias: Bearish below ₹820. Reversal confirmation only above ₹840.60.
________________________________________
7. Risk Factors------------
• Positive PSU bank sector news or surprise earnings could invalidate downside
• Global risk-on events may cause aggressive short-covering
• RBI interventions or policy rate changes
________________________________________
8. Conclusion------------
SBI appears technically weak after facing rejection from a strong supply zone marked by an extreme orderblock and bearish RSI divergence. Price is below short-term EMAs and breaking structure levels, pointing towards downside potential. Traders can consider short trades with a strict stop loss and monitor price behavior near imbalance and FVG zones.
________________________________________
Disclaimer: This Technical Research Report is made for Educational Purpose Only. Do not consider it as any Investment idea. I'm not SEBI Registered Research Analyst. Consult your Registered Financial Advisor Before Investment.
-------------------------------------------------------------------------------------------------------------------
Your Views or Comments are Most Welcome.
Hit like if you find these insights helpful.
-------------------------------------------------------------------------------------------------------------------
Regards,
Hit_Analyst

SBIN BREAKOUT - LONGMy Dear Investor Friends,
One of the largest banks of India, SBIN (State Bank of India) has given a breakout of its long-term resistance trend line.
It had formed inverted head and shoulders earlier, soon it gave a break out of the pattern.
After breakout, we saw a very good 50% fibonacci retracement back to the support of HNS.
After the retest, the stock continued its rally and finally gave a breakout of its resistance line with continuous fibonacci retracement.
As far as I believe with, this continues retracement and the bullish market currently going on, I believe that the stock will continue its upward rally giving target as per the resistance marked .
Let me know your views in the comment section .

SBI Short analysisLooking forward to entering short positions on SBIN, post confirmation. Once we do see a good enough push with volume, would be most likely an ideal confirmation to enter.

SBIN - At the Battlefield for BreakoutThe trendlines and levels marked here in this chart are self explanatory.
In a nutshell, We need a breakout confirmation above 825 first and then again at 835-840 levels.
While there is good demand at the lows, overhead supply is too strong as we approach the resistance zone.
We are struggling to get past the GAP zones created in the past.
Buyers are trying their best to absorb the supply at 820-840 levels.
Other Observations:
Price is at the early stages of Golden crossover (50 EMA over 200 EMA), hence, one can stay patiently for a strong move on the upside with stops below 805
Price is trading above the cloud, conversion line is now taking out Baseline, signalling strength for the prevailing uptrend.
Weekly ST is at 822; close above this on weekly TF is the key for further move on the upside.
P&F Chart suggests DTB above 825 and it can attempt 850 and 890 levels
Disclaimer: I am not a SEBI registered Analyst and this is not a trading advise. Views are personal and for educational purpose only. Please consult your Financial Advisor for any investment decisions. Please consider my views only to get a different perspective (FOR or AGAINST your views). Please don't trade FNO based on my views. If you like my analysis and learnt something from it, please give a BOOST. Feel free to express your thoughts and questions in the comments section.

SBIN in uptrend.SBIN 795 - Volume suggests weak bears and a good accumulation around 784 . We expect SBIN will test 819 and give a breakout to 940.

SBIN – VCP Breakout📊 NSE:SBIN – VCP Breakout 🚀
Classic Volatility Contraction Pattern (VCP) in play:
1st contraction: -17.41%
2nd: -8.54%
3rd: -5.12%
Breakout above ₹822 with volume surge 🔥
Reduced volatility ➡️ Strong demand ➡️ Bullish breakout!
#SBIN #VCP #PriceAction #TechnicalAnalysis #StockMarketIndia

SBIN ASCENDING TRIANGLE BREAKOUTSBI breaking ascending triangle pattern
with huge volume bullish rsi
breaking 835 will give more upside
#target 870-912
NO BUY/SELL RECOMENDATION

SBI: Bullish Breakout SBI’s Board Meeting Today
• The SBI board is meeting on July 16 to discuss capital-raising plans, including issuing Basel III-compliant bonds. This is key to reinforcing the bank's capital adequacy for FY26
• The agenda has attracted market attention, and SBI shares are in focus amid these announcements
Planned QIP for Equity Capital
• SBI intends to raise up to ₹250 billion (~$2.9 billion) via a Qualified Institutional Placement, making it potentially India’s largest QIP ever
• This initiative is part of a broader ₹450 billion capital-raising plan across public-sector banks in FY26
Market Performance Snapshot (as of July 15 close):
Share Price: Around ₹816–₹817 on July 15
Valuation Metrics:
P/E ratio: ~9.4×
P/B ratio: ~1.6×
Dividend yield: ~1.95–1.97%
Technical Overview (Daily Chart – July 16, 2025)
All timeframes (up to daily) show a Strong Buy consensus, with 12 moving averages and 9–10 technical indicators flashing bullish signals on the daily chart.
Key Indicators (daily):
✅ RSI(14): ~62 (Buy)
✅ MACD: +1.85 to +2.26 (Buy)
✅ ADX(14): ~31–36 (Trending Up)
✅ Stochastics: ~64–70 (Buy)
✅ Williams %R: ≈ −27 (Buy)
CCI: +99–116 (Buy region)
Buy near current pivot zone (~816) or on a minor dip (~810–812) which aligns with support at the 50‑200 day MAs.
Targets:
Primary: R1 (~818) → R2 (~821)
Extended: 825–830+ on breakout and 860
Stop‑Loss:
Place just below key MA support: ~805–810 (below 100 and 200‑day moving averages).
Disclaimer: lnkd.in

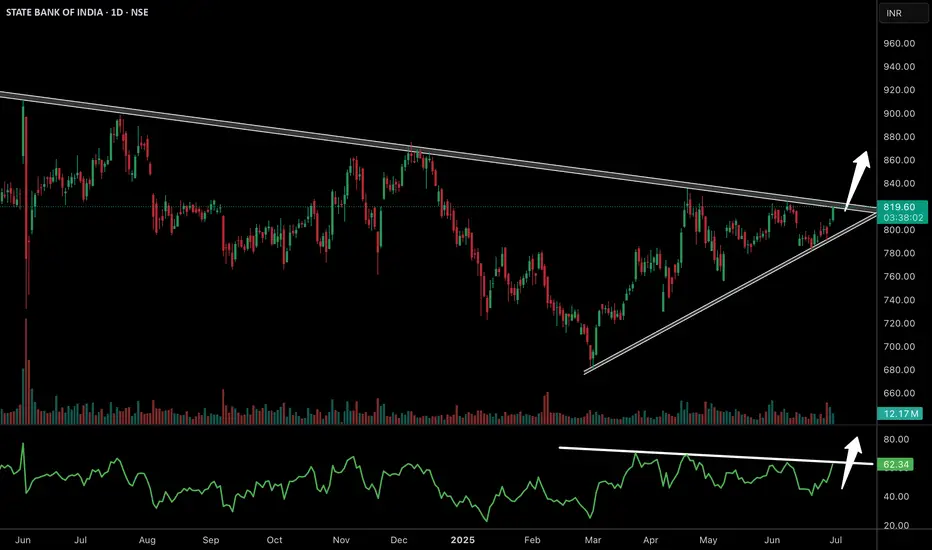
State Bank of India – Trendline Breakout Alert📊 State Bank of India – Trendline Breakout Alert
SBI breaks above descending trendline, indicating potential shift in short-term trend. Bullish volume and structure support further upside.
🟢 Watch for sustained move or pullback to breakout zone.


Gearing up for 1000 levelsSBI on the Weekly Timeframe is consolidating near the top of the downward sloping channel, hinting at potential breakout in the coming weeks and heading towards 1000 levels.

Bullish on SBIN 808
Price Action: SBIN is currently trading around ₹808 after a healthy pullback. The price is near a major support zone and showing early signs of rever
Structure: It has respected its previous swing lows, indicating possible base formation.
Trend: Still within a long-term uptrend, now offering a favorable risk-reward near support.
🔍 Key Levels to Watch
Immediate Support: ₹795–₹800 zone (important structure support)
Resistance Zone: ₹830–₹835 (initial target)
Breakout Level: ₹835+ for fresh momentum toward ₹850+
📈 Indicators Confirmation
RSI: Near 45–50, stabilizing after being weak—setting up for a reversal.
Stochastic (14,3,3): In oversold territory on both 15m and 1D timeframes—potential early bottoming signal.
Moving Averages: Price is around the 50 EMA and still above the 200 DMA on daily charts, maintaining medium-term bullish bias.↳

SBI Bank Projection
---
## 🏦 **State Bank of India (SBI) – Business Model Overview**
**Established:** 1955
**Headquarters:** Mumbai, India
**Ownership:** Majority-owned by Government of India
**Ticker:** SBIN (NSE & BSE)
---
### 🔧 **1. Core Business Segments**
1. **Retail Banking:**
* Deposits (Savings, Current, Term)
* Personal Loans (Home, Car, Education, Gold)
* Credit Cards (SBI Card)
* Digital banking via YONO platform
2. **Corporate & Institutional Banking:**
* Working capital, term loans, trade finance
* Project finance for infrastructure, energy, etc.
* Services for PSUs, large corporates, MSMEs
3. **Treasury Operations:**
* Investment in government securities
* Forex & derivatives
* Money market instruments
4. **Insurance & Asset Management (through subsidiaries):**
* SBI Life Insurance (insurance products)
* SBI General Insurance (non-life insurance)
* SBI Mutual Fund (investment products)
5. **International Banking:**
* Operations in 20+ countries
* NRI banking
* Trade finance and correspondent banking
6. **Agricultural & Rural Banking:**
* Priority sector lending
* Kisan Credit Cards
* Rural financial inclusion programs
---
### 💸 **2. Revenue Model**
| Source of Income | Description |
| ----------------------- | ---------------------------------------------------- |
| **Interest Income** | From loans, advances, and investments |
| **Non-Interest Income** | Fees, commissions (e.g., cards, mutual funds, forex) |
| **Treasury Gains** | Profit from bond/forex trading |
| **Subsidiary Profits** | Dividends from SBI Life, SBI Cards, etc. |
---
### 📱 **3. Digital Transformation**
* **YONO App:** Unified platform for banking, shopping, investments, and loans
* **AI and Data Analytics:** Used for credit scoring, fraud detection, and personalized offers
* **Online Customer Service:** Chatbots, digital onboarding, e-KYC, etc.
---
### 🧩 **4. SBI Subsidiaries**
| Subsidiary | Focus Area |
| ---------------------------- | ----------------------------- |
| SBI Life Insurance | Life insurance |
| SBI Cards & Payment Services | Credit cards |
| SBI Mutual Fund | Asset management |
| SBI General Insurance | Non-life insurance |
| SBI Capital Markets | Investment banking & advisory |
| SBI DFHI | Money market dealer |
---
### 🌍 **5. Competitive Advantage**
* Strong government backing
* Largest customer base & branch network in India
* Digital ecosystem (YONO)
* Diversified product offering
* Access to low-cost deposits
---
### 📊 **6. Key Metrics (FY24 Approx)**
* **Total Assets:** ₹60+ lakh crore
* **Net Profit:** ₹61,077 crore
* **NIM (Net Interest Margin):** \~3.5%
* **Gross NPA:** \~2.8%
* **Market Share in Loans/Deposits:** \~23-25%
---
### 🧭 **7. Future Strategy**
* Aggressive digital expansion through YONO 2.0
* Expanding in rural and semi-urban India
* Cross-selling via subsidiaries (mutual funds, insurance, cards)
* Cost optimization through tech
* Global expansion in NRI-heavy regions
---

SBIN on Verge of Breakout from Symmetrical Triangle ✅ The stock has formed a large symmetrical triangle pattern on the daily chart, with price compressing and now approaching the apex, suggesting a strong move is imminent.
✅ The recent candles show higher lows, confirming buyers are stepping in on every dip. RSI was in a falling wedge and has now broken to the upside above 62, indicating strengthening momentum.
✅ A clear breakout above the upper trendline near 825–830 with volume can lead to a sustained rally towards 880–920 levels in the coming weeks.
✅ PSU banks remain in focus with strong credit growth and stable asset quality. SBI being the largest lender, will benefit from robust business momentum.
SBI Ready for 10% Upside in Short termOn Monthly TF
Taken Support At Lower Parallel Channel 20MEMA
On Weekly TF
Inverted HNS Breakout and Retest Completed at 100 WEMA And trading above 20 and 50 WEMA
Above 810 Shorts may start Covering
Trade Activates above 810
SL below 775
Targeting 890
R:R = 2.5
Downside To Trade Idea: Trendline Breakout Pending
