SBIN Ltd. – Gearing Up for a Breakout📈 Technical Analysis
SBI, a long-term bullish stock, peaked at ₹912 and then consolidated with a series of lower highs, recently trading around ₹797.
If the recent lower high is taken out and the same level starts acting as support, with confirmation from bullish candlestick patterns, then only we can expect the stock to move towards all time high. Otherwise, there are no expectations on this stock. Until a clear breakout of the recent lower high occurs, no further move can be anticipated.
Wait for confirmation via bullish candlestick patterns on the breakout.
Ensure this new support holds.
Targets on confirmation:
🎯 Target 1: ₹850
🎯 Target 2: ₹875
🎯 Target 3: ₹900
Key Support Zone:
🔻 A stronger support lies around the ₹680–₹720 range; if breached, bullish momentum could fade.
💰 FY24 Key Financial Highlights (vs FY23 & FY22)
Total Income: ₹490,938 Cr (vs ₹439,189 Cr; ₹350,845 Cr)
Total Interest: ₹300,943 Cr (vs ₹259,736 Cr; ₹189,981 Cr)
Total Expenses: ₹252,043 Cr (vs ₹239,750 Cr; ₹204,303 Cr)
Financing Profit (NII): -₹62,048 Cr (vs -₹60,297 Cr; -₹43,439 Cr)
Profit Before Tax: ₹108,365 Cr (vs ₹91,240 Cr; ₹75,399 Cr)
Profit After Tax: ₹80,523 Cr (vs ₹69,543 Cr; ₹57,750 Cr)
Diluted EPS: ₹86.91 (vs ₹75.17; ₹62.35)
SBI has delivered consistent YoY growth across all major metrics, with a robust Net Profit gain of nearly ₹11,000 Cr over the previous year, underscoring strong earnings momentum.
🔍 Fundamental Insights
Strong Profit & ROE: FY24 profit stood at ₹80,523 Cr with ~17.2% ROE, reflecting efficient capital deployment
Loan & Deposit Growth: Advances grew ~15–16% YoY; Deposits up ~11%; CASA ratio stable around 40%
Margin & Asset Quality: FY24 NII rose ~10%, while Q4 FY25 NII rose 2.7%; GNPA declined to ~1.82%; PCR at ~92%
Capital & Loans: Healthy CET-1 ratio (~10.36%); credit costs remained contained .
Dividend Declared: ₹15.90/share for FY25 (~2% yield), a 16% rise over previous payout
QIP Raise: Board approved raising up to ₹25,000 Cr in FY26 for future growth
🧭 Conclusion
SBI stands at a critical inflection point, with a potential breakout above a former resistance zone confirming bullish momentum. Technically, a confirmed support around ₹797–₹800 would pave the way toward upside targets of ₹850 → ₹875 → ₹900.
Fundamentally, SBI remains strong — exhibiting robust profit growth, improving asset quality, stable margins, and shareholder-friendly dividends.
⚠️ Disclaimer
This stock report is for informational purposes only and does not constitute investment advice. Please conduct your own research or consult a financial advisor before making investing decisions.
Trade ideas


Larger trend in dangerSBI CMP 796
Investors - Exit
Elliott- this rally is corrective and is over. Now a three wave downfall should begin from here.
RSI - the oscillator is below the MA cross and also in the bear zone on the monthly charts.
Composite- negative divergence on the oscillator on the weekly charts is reversal.
Conclusion- Completion of the Elliott wave and the oscillators at crucial zones on higher time frame charts is telling me the larger trend is now in danger.

Institution Option Trading Part-7Regulatory & Risk Considerations
SEBI (India) & SEC (US) regulations limit speculative exposure.
Institutions must report Open Interest, Position Limits, Margin Usage.
Must adhere to VaR (Value at Risk) frameworks and internal risk policies.
Institutional Trading during Events
Earnings Seasons: Institutions use straddles/strangles for earnings plays.
Budget or RBI Policy: Protective collars/volatility trades.
Global Crisis (e.g. COVID): Use of massive protective puts (SPX, NIFTY).
VIX & Institutional Behavior
India VIX plays a vital role in determining institutional option strategies.
High VIX = buying protection, long gamma strategies.
Low VIX = selling premium, income strategies.

Advance Institutions Option Trading - Lecture 5When it comes to low risk options strategies, selling a call spread and selling a put spread are techniques that traders often utilize. These strategies are characterized by a high probability of profit due to the low probability of loss, and they limit risk in case the trade doesn't go as planned.
While day traders look at minute-to-minute price changes, swing traders look at trends that play out over several days. This is considered one of the most profitable trading types that allows more flexibility, as you don't need to be glued to your computer screen all day.

SBIN | 15 min Idea – 10 Jun 2025 / SWING📌 SBIN | 15 min Idea – 10 Jun 2025
Bias: Bullish while holding above demand
CMP: 812.00
Market Structure
• Pullback into 1HR trendline support with bullish structure intact
• Price compressing near key support zone 804–808
Levels
│ R1 822.75 │ R2 833.25
│ S1 804.00 │ S2 800.00
Trade Plan
🟢 Breakout Long → Entry on 15‑min candle close > 822.75
Targets 828 / 833 | SL 815
🟢 Pullback Long → Bid 804–808 zone on bullish 5‑min candle
Targets 820 / 822.75 | SL 800
🔴 Breakdown Short → Entry on 15‑min close < 800
Targets 794 / 786 | SL 808
Notes
• 1HR trendline + horizontal support add conviction to bounce setup
• Break above 822.75 may trigger momentum toward recent highs
Set alerts at 822.75 and 800; risk ≤ 1 % of capital.
#PriceAction #SBIN #15min #GLOBALTRADESECURITIES

upward directioni think sbi maarket trend is going to upward. but its pure consolidation so wait for breakout

Overview of Financial Markets Financial markets are platforms where buyers and sellers trade financial assets like stocks, bonds, currencies, and derivatives. They facilitate the movement of capital between savers and borrowers, enabling investment, risk management, and capital formation. These markets play a crucial role in the global economy by providing a mechanism for allocating funds and determining prices.

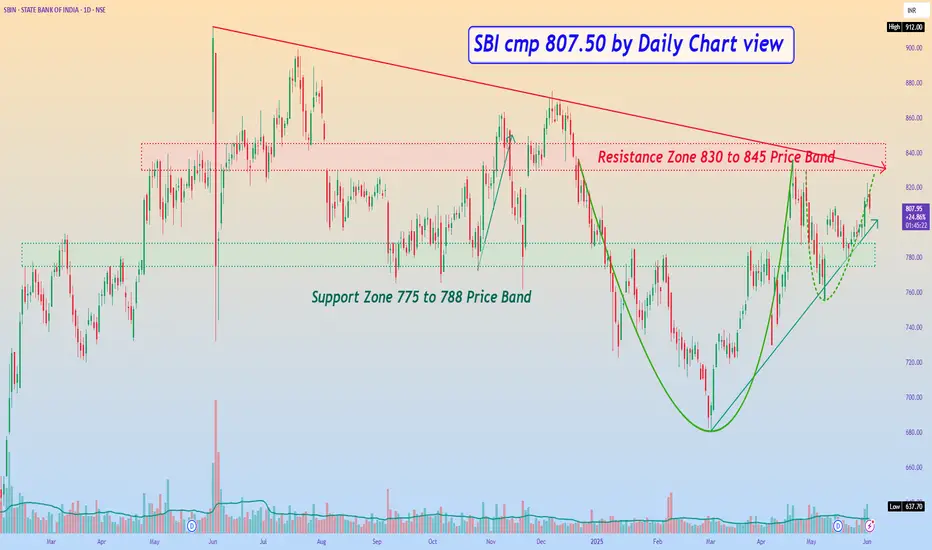
SBI cmp 807.50 by Daily Chart viewSBI cmp 807.50 by Daily Chart view
- Support Zone 775 to 788 Price Band
- Resistance Zone 830 to 845 Price Band
- Support Zone tested retested for probable upside move
- Back to Back Bullish Rounding Bottoms by Resistance Zone neckline
- *IF ..... Price takes breakout by Volumes increase support and sustain closure above Resistance Zone, fresh upside is anticipated*
Option and Database Trading In financial terms, options trading involves buying and selling contracts that give the holder the right, but not the obligation, to buy or sell an underlying asset at a specified price within a set timeframe. This contrasts with database trading, which refers to the manipulation and utilization of data within databases for various purposes, such as querying, updating, and analyzing information.

SBIN : Swing Trade#SBIN #swingtrade #threewhitesoldier #trendingsetup #breakoutstock #momentumstock
SBIN : Swing Trade
>> TWS Visible
>> Trending setup
>> Cup and Handle formation
>> Breakout Candidate
>> Good Strength & Volume
>> Good Risk Reward Trade
Swing Traders can lock profit at 10% and keep trailing
Disc : Charts shared are for Learning purpose not a Trade recommendation.
Consult a SEBI Registered Advisor before taking position in it.

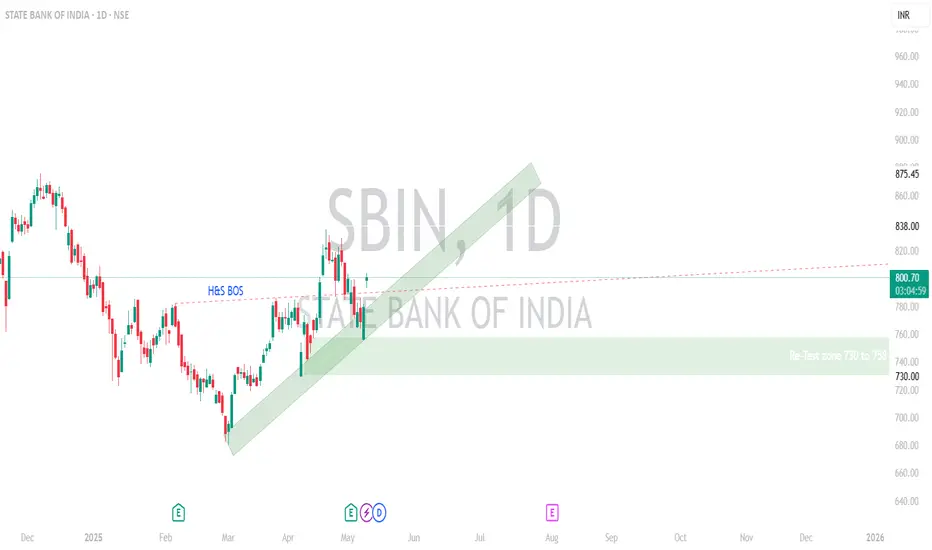
SBIN - Weekly AnalysisIn the Weekly Chart of SBIN ,
we can see that; it has given Trendline breakout.
Let it retest and then enter with SL and Targets.
Possible momentums are shown in chart.

BREAKOUT BOOM Price: ₹788.00
🚀 Resistance Breach Confirmed: ₹785.80 blown apart—now sailing into uncharted waters.
🔥 Volume: 2.04M — That’s not just a breakout, it’s a full-blown institutional charge.
⚓ EMAs:
EMA 20: ₹769.5
EMA 50: ₹765.3
Both EMAs far below the current price = solid thrust
target 1 790 target tatget 800
Keep a trailing stop loss above 800

SBIN WatchlistSBIN Watchlist 👀💰
🔥 Break above ₹800 = game on for intraday/swing
🎯 Targets: ₹806 → ₹816 → ₹830
🛡️ Support holding at ₹790 — below that? Stay cautious ⚠️
Keep it on radar 📈👟

Overview of Financial Markets Financial markets, from the name itself, are a type of marketplace that provides an avenue for the sale and purchase of assets such as bonds, stocks, foreign exchange, and derivatives. Often, they are called by different names, including “Wall Street” and “capital market,” but all of them still mean one and the same thing. Simply put, businesses and investors can go to financial markets to raise money to grow their business and to make more money, respectively.

Advanced RSI "Advanced RSI" typically refers to strategies or techniques that go beyond the basic interpretation of the Relative Strength Index (RSI) indicator in trading. It involves using the RSI in more sophisticated ways, such as combining it with other indicators, exploring different RSI settings, and identifying advanced trading patterns.

MACD ( Moving Average Convergence Divergence)When To Use And How To Read The MACD Indicator - short for Moving Average Convergence Divergence, is a popular momentum indicator in technical analysis used to identify trends and potential reversals in stock prices. It's a tool that helps traders understand the strength, direction, and duration of a trend by analyzing the relationship between two moving averages.

Technical Conpet"Technical Concept" refers to a specialized knowledge or understanding of technical aspects, often within a particular field like engineering, computer science, or a specific industry. It's not a standardized term with a single, fixed meaning, but rather a concept that can be interpreted in various ways depending on the context.

Technical Concept A "technical concept" refers to a term or idea that has a specific, often specialized, meaning within a particular field or discipline, especially in technology or engineering. These concepts are often used to describe complex systems, processes, or principles. They can be fundamental to understanding a field or be more specific, like a particular algorithm or software library.

Bullish Projection for SBI – Cause & Effect Analysis1. Cause: Capital Adequacy Boost via ₹25,000 Cr Fundraising (May 2025)
Effect: Strengthened lending capacity + institutional confidence
Price Action: Institutional investors view this as a sign of growth readiness.
Stock may break past ₹900–₹920 resistance, heading to ₹980+ once fundraising is completed or oversubscribed.
📅 Expected Impact Window: June–August 2025
2. Cause: Consistently Improving Asset Quality (Net NPA down to 0.47% as of Q4 FY25)
Effect: Lower provisioning + stronger quarterly earnings
Price Action: Sustained drop in GNPA/NNPA drives EPS upgrades from brokerages.
Strong Q1 FY26 results (August 2025) could be a catalyst for a move to ₹1,020+ if provisioning is sharply reduced.
📅 Expected Impact Window: August–October 2025
3. Cause: Dividend Payout of ₹15.90 + Operating Profit Growth (Q4 up 8.8% YoY)
Effect: Retail investor interest + income-seeking demand
Price Action: Dividend income + healthy operating metrics may pull in conservative investors.
A post-dividend rally toward ₹1,100 is possible as confidence builds.
📅 Expected Impact Window: May–July 2025 (around record and payment date: May 30, 2025)
Projections and price targets mentioned are speculative and based on publicly available financial data and assumptions as of May 2025. Market conditions, macroeconomic developments, and unforeseen events may significantly affect actual outcomes.
Disclaimer: lnkd.in
Institutional Trading part 4Institutional trading consists of the purchase and sale of financial assets by institutions through their traders. This definition of institutional trading applies to institutional equity trading, institutional stock trading, institutional options trading - any subcategory.

Divergence SecretsIn trading, divergence occurs when the price action of an asset moves in the opposite direction to what a technical indicator, such as a momentum oscillator, indicates. This discrepancy can signal a potential change in trend momentum or a possible reversal of the existing trend.

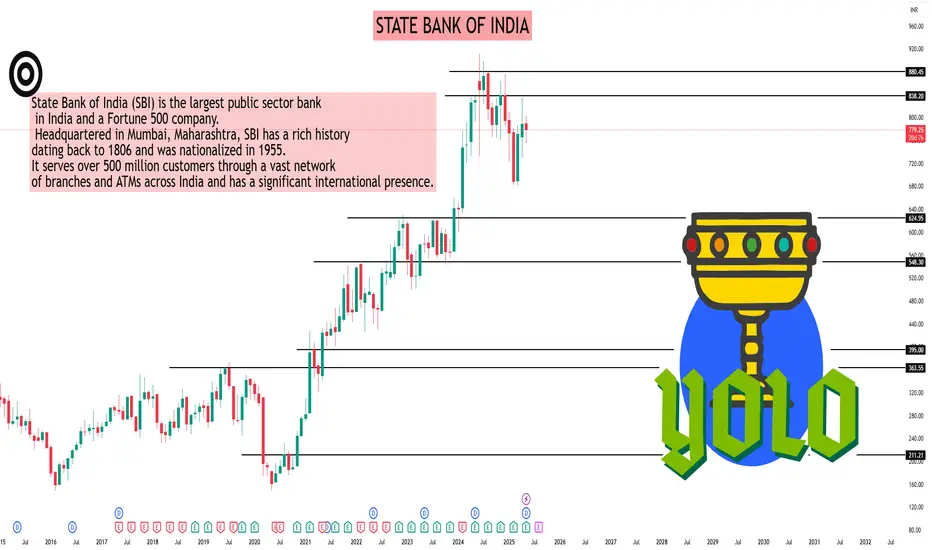
STATE BANK OF INDIAAs of May 9, 2025, State Bank of India (NSE: SBIN) closed at ₹779.25. Based on various technical analyses, here are the key monthly support and resistance levels for SBIN:
📊 Monthly Support & Resistance Levels (May 2025)
Standard Pivot Points
Pivot Point: ₹839.43
Support Levels:
S1: ₹784.72
S2: ₹733.93
S3: ₹679.22
Resistance Levels:
R1: ₹890.22
R2: ₹944.93
Fibonacci Levels
Pivot Point: ₹784.72
Support Levels:
S1: ₹744.42
S2: ₹719.52
S3: ₹679.22
Resistance Levels:
R1: ₹825.02
R2: ₹849.92
R3: ₹890.22
Camarilla Levels
Pivot Point: ₹784.72
Support Levels:
S1: ₹778.98
S2: ₹769.31
S3: ₹759.64
Resistance Levels:
R1: ₹798.32
R2: ₹807.99
R3: ₹817.66
Woodie's Levels
Pivot Point: ₹785.70
Support Levels:
S1: ₹735.90
S2: ₹680.20
Resistance Levels:
R1: ₹841.40
R2: ₹891.2
Demark Levels
Support Level:
S1: ₹759.33
Resistance Level:
R1: ₹864.83
🔍 Observations
The stock is currently trading near the Camarilla S1 level of ₹778.98, indicating potential support.
The Fibonacci Pivot Point at ₹784.72 may act as a resistance if the stock attempts to move upward.
Key support levels to monitor include ₹733.93 (Standard S2) and ₹719.52 (Fibonacci S2).
Resistance levels to watch are ₹825.02 (Fibonacci R1) and ₹841.40 (Woodie's R1).