SBI bank - What does the result saySBI bank declared quarterly results which are a mix bag. What is the share price headed now? Th video tells
Trade ideas

Private or Public the fate will be the sameSBI CMP 800
Elliott- the rally is corrective and is over in my view.
*Fibs- The waves are related to each other by Fibs.. Here the c wave has halted at 1 of a.
Trendline- the rally also halted at the trendline.
Oscillators- At price resistance we have a negative divergence in the composite where as the RSI has failed here.
Conclusion - Since the formation is on a 3day chart the mkt may take some time to turn. But its very evident that the rally is over. The tgts are on ur screen the first tgt is back to the start at rally at 680.

State Bank of India // 2hour Support and ResistaneAs of May 2, 2025, the State Bank of India (SBIN) is trading at ₹728.05, up 0.84% from the previous close of ₹722.00.
📈 2-Hour Intraday Support and Resistance Levels
Based on recent technical analysis and intraday chart patterns, here are the key support and resistance levels for SBIN on a 2-hour timeframe:
Immediate Support Levels:
S1: ₹723.00
S2: ₹718.00
S3: ₹710.00
Immediate Resistance Levels:
R1: ₹735.00
R2: ₹745.00
R3: ₹755.00
These levels are derived from recent price action and volume analysis, indicating potential breakout points and areas where the stock may find support.
🔍 Technical Indicators
50-Day EMA: ₹858.16 (Stock is trading above this level, indicating a bullish short-term trend)
100-Day EMA: ₹839.78 (Stock is trading above this level, indicating a bullish mid-term trend)
200-Day EMA: ₹812.92 (Stock is trading above this level, indicating a bullish long-term trend)
MACD: Bearish crossover observed, suggesting potential short-term weakness
RSI (14): Below 30, indicating oversold conditions
MFI (14): 24.19, suggesting sideways movement
CCI (20): Below -100, indicating oversold conditions
William %R (14): -78.98, indicating oversold conditions
ADX (14): Above 20 with +DI below -DI, indicating a downtrend
PSAR: 238.73, acting as a stop-loss for long positions
These indicators suggest a potential short-term pullback, but the overall trend remains bullish.
📊 Chart Patterns
A recent Cup and Handle pattern has been observed, with the price breaking out from the handle formation. The measured move suggests a potential target of ₹1,342.35, contingent upon sustained volume and price momentum.
⚠️ Important Notes
Risk Management: Always use appropriate stop-loss orders to manage risk.
Market Conditions: Intraday levels are subject to change based on market conditions and news events.
Consult Professionals: Consider consulting with a financial advisor before making investment decisions.

SBIN for 880+?The EW counts and patterns suggests that price is headed higher, maybe for new ATH to 1000 or more..
Detailed count is here.. for now, as per the Inv H&S pattern, 880+ looks very much possible on the cards..
Awaiting breakout at the falling trendline from the top for further confirmation
Counts on larger TF
Disclaimer: I am not a SEBI registered Analyst and this is not a trading advise. Views are personal and for educational purpose only. Please consult your Financial Advisor for any investment decisions. Please consider my views only to get a different perspective (FOR or AGAINST your views). Please don't trade FNO based on my views. If you like my analysis and learnt something from it, please give a BOOST. Feel free to express your thoughts and questions in the comments section.

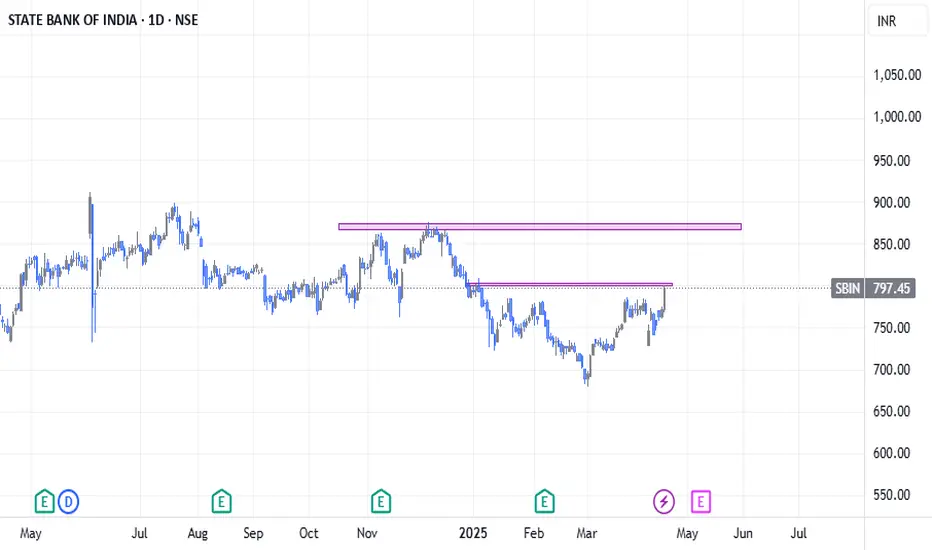
SBIN (NSE:SBIN) Breakout Alert: Inverse H&S Targets 835/875
Timeframe: Daily
Key Levels: Resistance: 786 (neckline of Inverse H&S).
Pattern & Context:
-Inverse Head & Shoulders nearing breakout confirmation.
-Price stabilizing post-gap-down, signaling potential bullish reversal.
Confirmation Needed:
-Breakout Candle: Strong close above 786 with elevated volume.
Trade Setup (Post-Breakout):
Entry: Retest/close above 786 with volume support.
Targets: 835 (pattern-derived), 875 (next key resistance).
Broader Market Check:
-Ensure bullish alignment in indices (Nifty/Bank Nifty).
Risk: Failure to sustain above 786 negates the setup.
Wait for volume-backed breakout before trading.
This idea is for educational purposes only, not financial advice. Trading carries risk—only trade with capital you can afford to lose. Past performance doesn’t guarantee future results. Always conduct your own analysis or consult a SEBI-registered advisor before acting. The author assumes no liability for losses incurred.

SBIN - Technical Analysis with Multi-Timeframe Momentum📈 Technical Analysis:
Strong breakout seen on the daily chart after price moved above a key neckline zone, signaling potential trend reversal.
Price has also closed above the 200-day moving average (200 MA) on the daily timeframe – a strong bullish indicator.
On the weekly chart, there's noticeable buying momentum, with a breakout above the 50-week moving average (50 MA), confirming strength on a higher timeframe.
📊 Overall View:
Multiple bullish confirmations across daily and weekly charts suggest further upside potential.
A successful of the breakout zone could lead to strong upward continuation.
✅ Bias: Bullish
🔎 Watch Levels:
Support: Breakout zone / 200 MA
Resistance: Previous swing highs
🚫 Disclaimer: This is not financial advice. Please do your own research and consult your financial advisor before making any investment decisions.
SBI - Bullish Head and Shoulder patternState Bank of India (SBI) has completed the formation of a bullish inverse head and shoulders pattern on the daily chart — a strong technical indicator of trend reversal from bearish to bullish.
Neckline Breakout:
The pattern has confirmed a clean breakout above the neckline at ₹785, accompanied by rising volume, validating the breakout and signaling that buyers have taken control from sellers.
Support Structure:
Both the left and right shoulders of the pattern have been formed around the strong support zone of ₹725, further strengthening the reliability of this setup.
Candle Confirmation:
The head of the pattern was formed with a Morning Star candlestick pattern, a classic bullish reversal signal, reinforcing the likelihood of an upward move.
Volume Analysis:
During the formation of the head and shoulders pattern, volume was gradually declining, indicating healthy consolidation.
The volume spike at the breakout point adds conviction, showing renewed interest and participation by buyers.
Momentum & Moving Averages:
RSI (Relative Strength Index): RSI is trading above 60, indicating strong bullish momentum without yet entering overbought territory.
EMA Crossover: A bullish crossover has occurred, with the 20-day EMA crossing above the 50-day EMA, a classic trend continuation signal.
The positive slope of both EMAs supports a sustained uptrend.
Price Target & Risk Management:
Target (as per measurement rule): The price target is calculated by measuring the distance from the bottom of the head to the neckline and projecting that from the breakout point.
Estimated Upside Target: ₹880
Stop-Loss (SL) Options: Fixed SL: Below the right shoulder, around ₹730.
Trailing SL: Use the 50-day EMA to dynamically protect gains as the price moves higher.
Conclusion:
SBI is exhibiting a strong bullish setup, with confirmation from price action, volume, and momentum indicators. The inverse head and shoulders pattern breakout, supported by key technical signals like EMA crossover and RSI strength, indicates potential for a trend continuation to the upside. Long positions can be considered with a clear risk-reward structure.

SBIN bullish BAT on weekly and ABCD on monthly chartsSBIN is an interesting charts with following
1. RSI on daily above 60, on monthly near 60
2. Price crossed above 20 SMA, 50/100/200 EMA on daily chart
3. A Text book kind Bullish BAT pattern on weekly charts
4. ABCD pattern on monthly charts
5. major moving averages supports as under:
20 D SMA 767
200D EMA 766
50 D EMA 759
100 D EMA 756
20 WK SMA 766
50 WK EMA 764-765
6. Inverted Head and shoulder pattern on daily chart
Lets See How it evolves from here further
Disclaimer: NOT A BUY / SELL RECOMMENDATION I am not an expert I just share interesting charts here for educational purpose and not to be taken as buy/sell recommendation. Please seek expert opinion before investing and trading as trading/ investing in market is subject to market risks. I do not hold any position in the stock as on date but I may look to take some position with my own Risk Reward matrix.

SBI 11% upside possible in next 30-40 trading sessions.SBI 11% upside possible in next 30-40 trading sessions.
SBI has broken H&S Pattern Neckline & possible targets are 880+
LTP - 798
Targets - 880+
Timeframe - 2 Months.
Happy Investing.

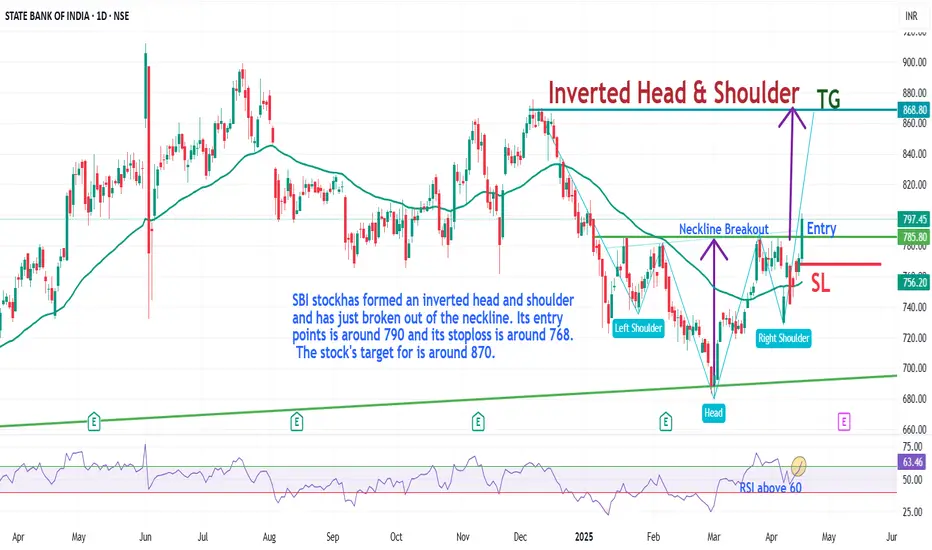
SBIN Stock has broken out an inverted head and shoulderSBI stockhas formed an inverted head and shoulder
and has just broken out of the neckline.
This stock has also broken out in 50 EMA and 200 Ema.
Its entry points is around 792 and its stoploss is around 768.
The stock's target for is around 868.
Banks in focus, chart: 1 SBIChart -> SBI Daily
Inverse head and shoulder breakout.
CMP: 798
Good Range to Buy: 780 to 800
Targets: 832, 862, 898
SL: 765 Daily Close
Disclaimer: This is for educational purposes only, not any recommendations to buy or sell. As I am not SEBI registered, please consult your financial advisor before taking any action.

SBI FORMING INVERSE HEAD & SHOULDERSBI having invrse head and shoulder previous trading day it is holding above neckline is saying something that it is readyn to go. But be aware this must hold neckline or take support neckline if it happen sure target will be achived which is mentioned here in chart.For more information you should study this chart going through arrow mark.and supports and resistances.
this is not my buy/sell call
>>> notice bank nifty is at its previous top which is strong resistance but get weak now even then keeping strenth to reverse upside move.

SBIN Upside potential with a Bullish Bias The Bank Index has been performing since few days
Also structure level SBIN is poised for an upmove, it has a pattern Inverse Head & Shoulders which is a bullish pattern and with a significant upside technically
Suggested to Buy at CMP or wait to retrace at 780s zone
SL 750s zone
Target 870s zone

SbinPrice is testing the trend line in lower and higher time frame. Also price is having at 760 zone.
Buy above 763 with the stop loss of 758 for the targets 768, 774, 780 and 788.
Sell below 754 with the stop loss of 759 for the targets 749, 744 and 738.
Always do your own analysis before taking any trade.

SBIN ready to accept your cheque soonStock Overview: State Bank of India (NSE: SBIN), current price: ₹768.60. SBI is India's largest public sector bank, providing a wide range of banking and financial services across individual and corporate sectors.
Key Levels:
Support: ₹719, ₹667
Upside Swing Zone: ₹734, ₹768
Possible Upside Levels: ₹872, ₹924, ₹991 and ₹1183
Technical Indicators:
RSI (Relative Strength Index): Current RSI is 49.97, reflecting neutral momentum with no signs of the stock being overbought or oversold.
Volume: Daily trading volume is robust at 27.83M, indicating consistent market participation.
Moving Averages (MA): The stock is trading above its short-term moving averages (e.g., 13-day MA), which suggests some bullish traction. However, it remains below longer-term MAs (e.g., 200-day MA), implying an overall mixed trend.
Sector and Market Context: SBI is a leader in the banking sector, which continues to show growth amidst increased credit demand and improved asset quality. The overall financial sector has benefited from resilient market conditions and positive economic recovery trends. Market sentiment aligns with stability in the banking domain, although global interest rate movements and inflation pressures remain influential factors.
Risk Considerations: Key risks include exposure to non-performing assets (NPAs), changes in monetary policy, or macroeconomic factors such as inflationary conditions and interest rate volatility. External events like geopolitical tensions or a global economic slowdown could also impact stock performance negatively.
Analysis Summary: State Bank of India exhibits stable technical patterns and benefits from its strong position within the banking sector. While upside levels indicate growth opportunities, potential risks should be carefully monitored to ensure balanced investment decisions.

A heavy weight at resistanceSBI CMP 771.50
Role Reversal - these zones where support becomes a resistance are imp zone on the chart. That the bulls could not cross that zone is negative and is a sell.
Elliott- the rally was corrective and is over. Hence a three wave correction should start from 785 zone. To me this is an extended five wave, which means a deep correction.
Fibs- the 785 is also a fib zone and hence a strong resistance.
Conclusion - A deeper correction is on the way. Again asking to be careful with ur longs.

SBI bank again ready for fall 710 avoid any buy trade How to take trades using Harmonic pattern projection Trade setup is explained below :-
Entry : 1st SL point : 0% is recent top or bottom.
Trailing D: 11.4% is work as trailing SL of buy or sell trade if hit then we have to book profit
.If price goes below 2nd D 21.4% to 23.6% range then early traders can make fresh reversals trade after breaking 1st D 11.4% safe traders can reversal trade after breaking Point D 21.4% to 23.6% range
Targets :
Target T1 : 35.1% to 38.3%
Target T3 : 49.1% to 53.2%
T3: 60.9% to 64.8% is our 3rd Target since this is reversal zone so must book profit if break then take fresh trade again
Target T4 : 76.4% to 79.7%
Next Targets are 100% , 127.2% ,141.4% and final Target 161.8%.
How to take reversal trade :
If price going upside/ downside then then buy or sell levels appear on Chart ( Automatically show when price reach any reversal zone of harmonic projection pattern based .
After showing reversal levels wait for confirmation until 21.4% or 28.3 % level not break if break then exit from current buy / sell trade and take fresh reverse trade buy/ sell .
Trailing SL:
After reach 1st Target trail SL to just above or below cost ( for example we are holding sell trade from 100 1st Target 110 hit then move trailing sl to 104-105 and move SL as price move upside or Downside)
Re- Entry :
For Re-entry in any pull back Point D ( 11.4% ) is used for re-entry then SL recent high or low Point SL ( 0% ) .
Blue Line is 1st support/ Resistance
Green line is 2nd support/ resistance
Red line is 3rd Support/ resistance

SBI - Long Term Investment IdeaSBI iS BELOW a crucial resistance levels.
Strategy used : Support Resistance levels and Trendlines
SBI near a crucial resistance levels
750-770 level.
CMP: 756
Current support levels 750 are broken and acts as resistance.
Investment idea:
50% - When crossing 762
if 610 levels are tested due to sudden spikes and rebounds, invest 50 % of the funds
Key points:
Q3 results are expected on 31st Jan 2025.
Upcoming Budget on Feb 01 2025
Support resistances - refer above.
This idea will be for long term and will be updated regularly
Note: Not a SEBI registered analyst. Plan and trade as per your analysis

Database Trading# **Database Trading**
**Database Trading** is a strategy that uses **historical market data, quantitative analysis, and AI-driven algorithms** to identify high-probability trading opportunities.
## **1️⃣ Key Concepts**
✅ **Data-Driven Decision Making:** Trades based on **past price patterns, volume, and indicators**.
✅ **Backtesting & Optimization:** Analyzing historical performance to refine strategies.
✅ **Algorithmic Execution:** Automating trades for efficiency and accuracy.
## **2️⃣ How to Trade Using Database Methods**
✅ **Pattern Recognition:** Identifying recurring market behaviors.
✅ **Statistical Edge:** Using probability-based models for trade entries.
✅ **Risk Management:** Adjusting position sizing based on past volatility trends.
### **Conclusion**
Database trading helps traders **eliminate emotions, improve accuracy, and develop systematic trading strategies**, making it a powerful approach in modern markets. 🚀

SBIN: Holding Strong Amid Market Weakness but Facing Further DowTopic Statement:
SBIN has experienced a relatively minor correction compared to the broader market, but technical indicators suggest the possibility of further downside.
Key points:
1. The stock has corrected to the 23.6% retracement level and attempted to break below but has reverted to this level.
2. Price is near the 180-day moving average, signaling a crucial support zone.
3. Weekly RSI is at 38, indicating persistent selling pressure, with a potential decline to the 38.2% retracement level at 612.

SBI Next move **🚀 SBI Trade Setup - Key Levels to Watch! 📉📈**
📊 **Stock:** STATE BANK OF INDIA (NSE)
🕒 **Timeframe:** 1D Chart
🔹 **Current Price:** **₹710.90**
🔹 **Retest Range:** **₹722.75 - ₹722.45** 🔴
🔹 **Immediate Support:** **₹701.55 - ₹700.60** 🔵
🔹 **Immediate Resistance:** **₹771.15**
🎯 **Bullish Targets:**
✅ **₹863.95**
✅ **₹950 & ₹1040 (Short-Term Holding 6-8 Months)**
🔻 **Bearish Breakdown Levels:**
🚨 **Selling Target ₹652.20 - ₹650.60**
💡 **Key Insights:**
✔️ **Breakout above ₹771.15** can trigger a strong bullish move 📈
✔️ **Strong buying expected above the immediate resistance zone!**
✔️ **Failure to hold ₹700.60 could push the price lower** 📉
⚠️ **Disclaimer:** This analysis is for **educational purposes only** and not financial advice. Trade wisely! 📊

database trading part 1 **Database Trading: Part 1 – The Foundation of Data-Driven Trading**
As trading technology continues to advance, traders and investors are increasingly turning to data-driven approaches to inform their decisions. One of the most powerful tools in today’s trading environment is the use of **databases** to manage, analyze, and automate trading strategies. Whether you're an individual trader, an algorithmic trader, or even a hedge fund, **database trading** has the potential to significantly improve decision-making and trading efficiency.
In **Part 1** of this series, we will explore the basics of database trading, its key benefits, and how it serves as the foundation for more advanced trading systems. This will set the stage for diving deeper into the technical implementation in subsequent parts of the series.
#### **What is Database Trading?**
At its core, **database trading** refers to the use of databases to store, manage, and process financial data that is used to inform trading decisions. The idea is to leverage historical and real-time market data, along with analytical tools, to optimize trading strategies and make more informed, data-backed decisions.
A typical database trading setup involves:
1. **Storing Data**: Databases are used to store a wide variety of data, from historical price data to technical indicators, market sentiment data, and trading signals.
2. **Analyzing Data**: Using database queries and analytics, traders can uncover patterns, backtest strategies, and generate insights.
3. **Automation**: The ultimate goal of database trading is to automate aspects of the trading process, allowing for faster decision-making and execution.
---
#### **Why is Database Trading Important?**
Here are some key reasons why database trading is gaining popularity among traders and investors:
1. **Data Organization and Management**
- **Data is King**: In the financial markets, the value of data cannot be overstated. A well-organized database can provide quick access to vast amounts of data that traders can use to analyze market trends, evaluate strategies, and make faster decisions.
- **Structured Storage**: Financial data needs to be stored in a structured and organized manner to be useful. A database allows for easy retrieval and manipulation of large datasets, making the analysis process much more efficient.
2. **Backtesting and Strategy Optimization**
- **Backtest with Confidence**: A crucial part of successful trading is **backtesting**—evaluating how a trading strategy would have performed based on historical data. Databases store historical price data, technical indicators, and other factors, making it easy to simulate and test your strategies without risking real capital.
- **Strategy Refinement**: With a comprehensive database, traders can continuously refine their strategies by analyzing their past performance and adjusting their approach accordingly.
3. **Real-Time Data Integration**
- **Instant Access to Market Data**: To make informed decisions, traders need up-to-the-minute data. By integrating **real-time data feeds** into your database, you can monitor the markets live and adjust your positions in response to market changes.
- **Streamlined Decision-Making**: The ability to react quickly to market fluctuations is vital in today’s fast-paced markets. With real-time updates in a database, trading systems can be automated to respond instantly to specific criteria.
4. **Increased Accuracy and Reduced Human Error**
- **Automated Systems**: By leveraging databases, traders can automate repetitive tasks, such as placing trades, calculating position sizes, or even adjusting stop-loss levels. Automation helps eliminate human error and ensures a more systematic approach to trading.
- **Consistent Decisions**: With a well-defined trading strategy in your database, you can make decisions based on logic and data rather than emotions, leading to more consistent trading outcomes.
5. **Scalability and Flexibility**
- **Handle Larger Datasets**: As you scale your trading strategy or experiment with more complex systems, databases allow you to store and process much larger datasets than you could manage manually. This is especially beneficial for **high-frequency trading** or multi-strategy systems.
- **Expand to Multiple Markets**: With a solid database in place, traders can expand their strategies across multiple markets, whether it’s stocks, forex, or crypto. The ability to manage different assets simultaneously enhances portfolio diversification and risk management.
---
#### **Components of a Trading Database**
For a trading system to be effective, it needs to be structured in a way that allows easy access to relevant data. Here are some essential components that should be included in any trading database:
1. **Historical Data Storage**
- **Price Data**: This includes open, high, low, and close prices for different time frames (daily, hourly, minute, etc.).
- **Volume Data**: Volume is a critical indicator of market activity and liquidity. This data can help confirm trends and predict potential price movements.
- **Indicators**: Storing various technical indicators (e.g., moving averages, RSI, MACD) allows for efficient analysis and decision-making.
2. **Trade Logs**
- **Tracking Trades**: Every trade you execute should be logged in the database, along with relevant details like entry price, exit price, position size, and trade outcome.
- **Performance Metrics**: By storing metrics such as win rate, risk/reward ratio, and average drawdown, you can track the overall performance of your strategy over time.
3. **News and Sentiment Data**
- Many traders also choose to incorporate **alternative data**, such as news articles, social media sentiment, or economic reports, into their databases. This data can offer insights into broader market sentiment and help predict market movements.
4. **Risk Management Parameters**
- Storing your risk management settings, such as position sizing rules and stop-loss levels, ensures that you follow your risk management plan consistently, without exception.
---
#### **How to Get Started with Database Trading**
Getting started with database trading doesn’t need to be complicated, but it does require some technical knowledge. Here’s a step-by-step overview:
1. **Choose a Database Technology**:
- For small-scale systems, **SQL databases** like MySQL or PostgreSQL work well. These databases store data in structured tables, making them great for organizing trade logs and historical price data.
- For more complex or high-frequency systems, **NoSQL databases** like MongoDB or Cassandra can be used to handle large, unstructured data sets, such as real-time market feeds.
2. **Collect and Import Data**:
- **Historical Data**: You can download historical data from sources like Yahoo Finance, Alpha Vantage, or Quandl. Import this data into your database to begin building your trading foundation.
- **Real-Time Data Feeds**: Integrating APIs from data providers (like Interactive Brokers, Binance, or Alpha Vantage) allows you to continuously update your database with live market data.
3. **Build or Integrate a Trading Algorithm**:
- Once your database is set up, the next step is to build or integrate a trading algorithm that will analyze the data and make trading decisions. This can be done using programming languages such as **Python** or **R**, both of which have excellent support for database interaction and data analysis.
4. **Backtest and Automate**:
- With your data in place, you can begin backtesting your strategy, ensuring it performs well over historical data before you implement it in live markets.
- The final step is automation. You can automate trade execution based on predefined strategies and real-time data inputs, allowing your system to trade without constant human intervention.
---
#### **Conclusion: The Power of Database Trading**
In this first part of our **Database Trading** series, we’ve explored the importance of leveraging data to make more informed and systematic trading decisions. By utilizing databases, traders can store and process vast amounts of data, backtest strategies, and automate trading systems. As we continue this series, we’ll delve deeper into how to implement these systems, integrate real-time data, and refine strategies using data-driven techniques.
In **Part 2**, we will explore how to structure and manage your database for optimal performance, and how to backtest and evaluate your strategies using the stored data.
---
This first part introduces the core concepts and importance of database trading, giving your audience a solid foundation. You can now continue with Part 2 to get more into the technical implementation of a database-driven trading system. Let me know if you'd like help with Part 2!

SBI lovers can take risk on these levels If SBIN break this level then next level is there. Can take risk on 1st support and if broken then exit from your position.
