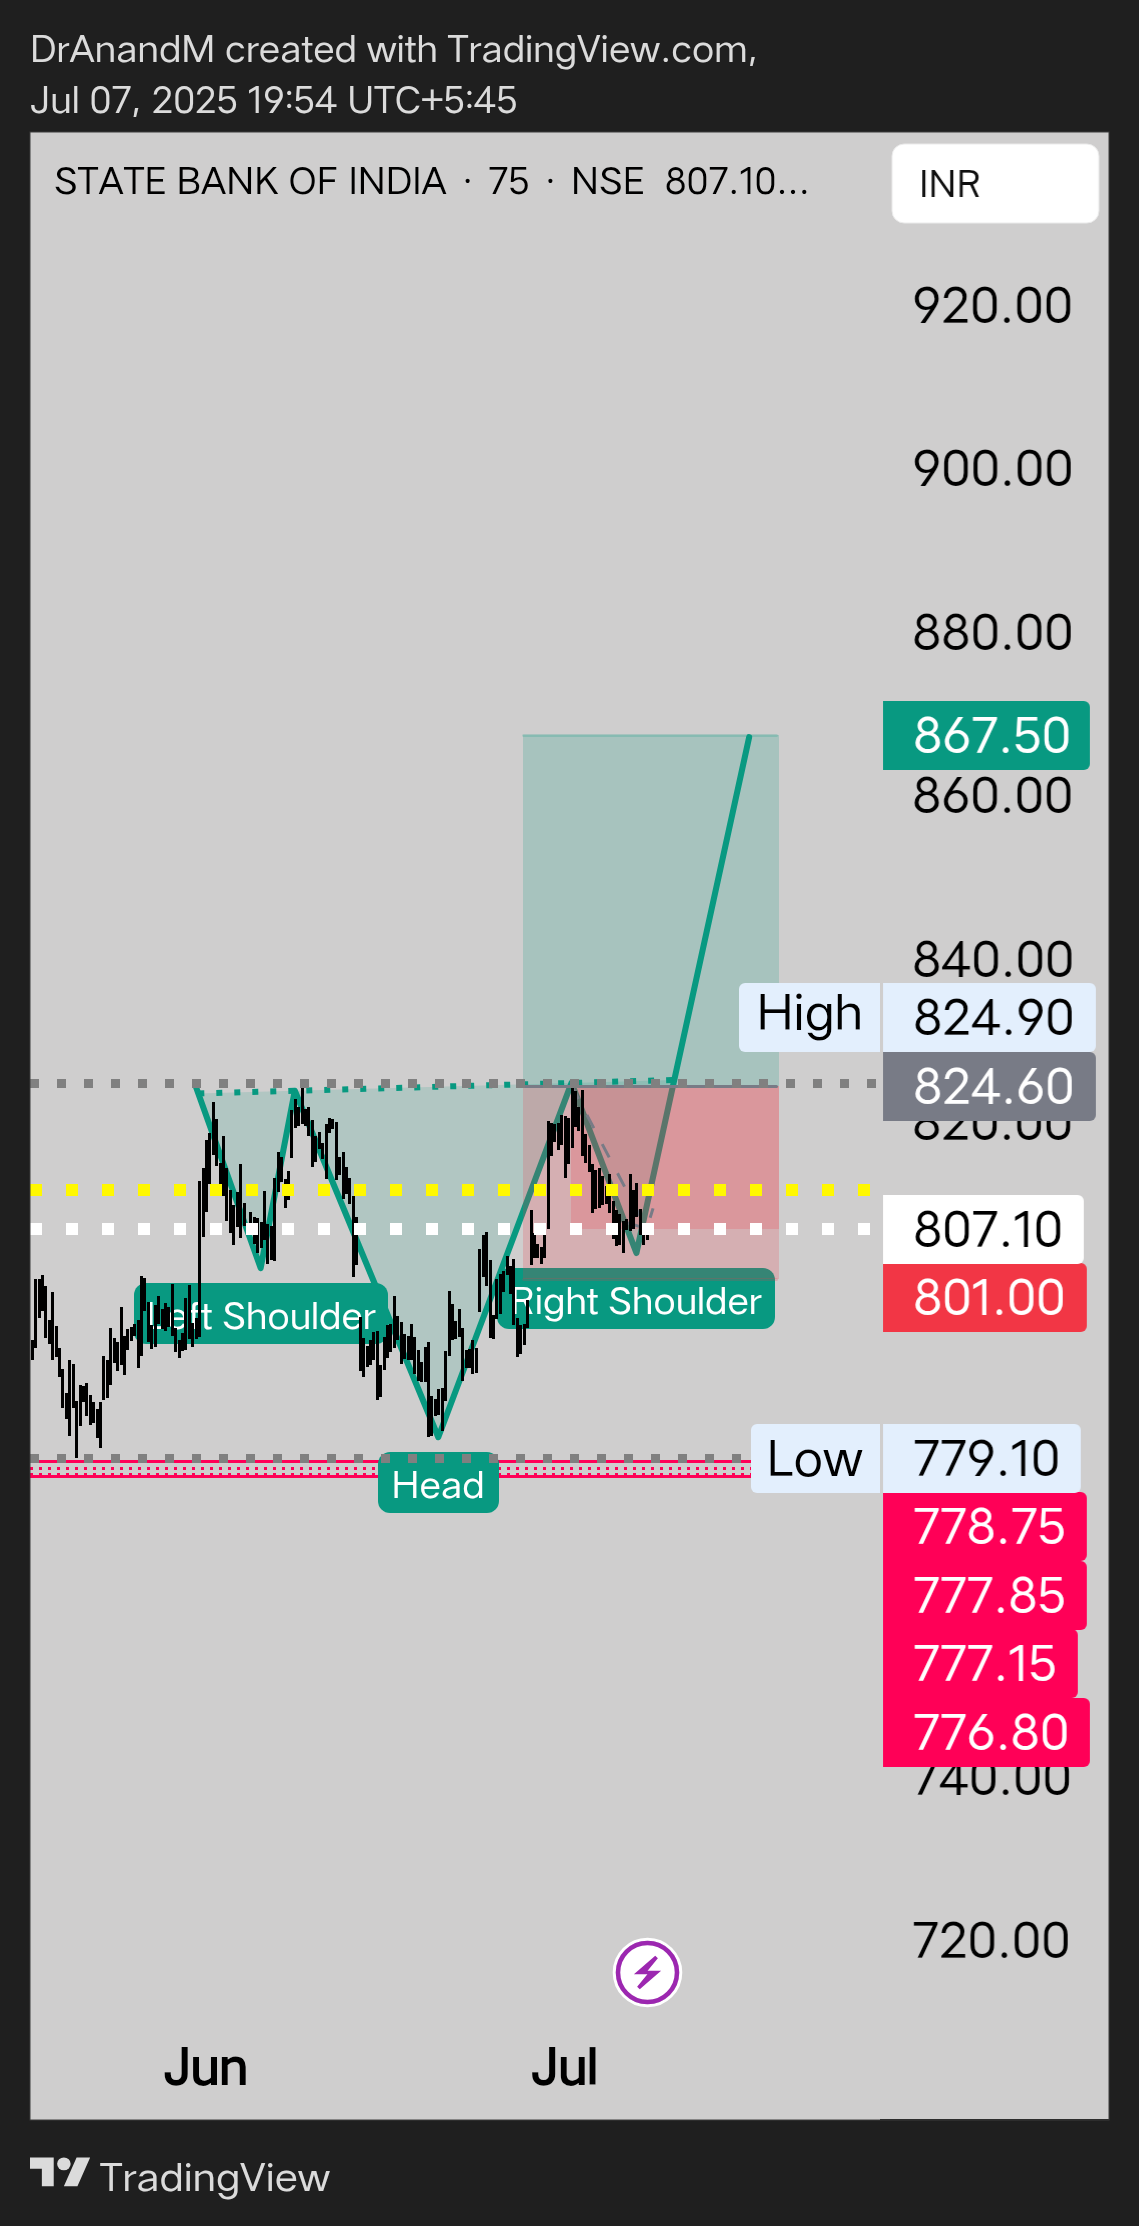
SBIN
As of May 9, 2025, State Bank of India (NSE: SBIN) closed at ₹779.25. Based on various technical analyses, here are the key monthly support and resistance levels for SBIN:
📊 Monthly Support & Resistance Levels (May 2025)
Standard Pivot Points
Pivot Point: ₹839.43
Support Levels:
S1: ₹784.72
S2: ₹733.93
S3: ₹679.22
Resistance Levels:
R1: ₹890.22
R2: ₹944.93
Fibonacci Levels
Pivot Point: ₹784.72
Support Levels:
S1: ₹744.42
S2: ₹719.52
S3: ₹679.22
Resistance Levels:
R1: ₹825.02
R2: ₹849.92
R3: ₹890.22
Camarilla Levels
Pivot Point: ₹784.72
Support Levels:
S1: ₹778.98
S2: ₹769.31
S3: ₹759.64
Resistance Levels:
R1: ₹798.32
R2: ₹807.99
R3: ₹817.66
Woodie's Levels
Pivot Point: ₹785.70
Support Levels:
S1: ₹735.90
S2: ₹680.20
Resistance Levels:
R1: ₹841.40
R2: ₹891.2
Demark Levels
Support Level:
S1: ₹759.33
Resistance Level:
R1: ₹864.83
🔍 Observations
The stock is currently trading near the Camarilla S1 level of ₹778.98, indicating potential support.
The Fibonacci Pivot Point at ₹784.72 may act as a resistance if the stock attempts to move upward.
Key support levels to monitor include ₹733.93 (Standard S2) and ₹719.52 (Fibonacci S2).
Resistance levels to watch are ₹825.02 (Fibonacci R1) and ₹841.40 (Woodie's R1).


SBIN ltd
As of May 2, 2025, the State Bank of India (SBIN) is trading at ₹728.05, up 0.84% from the previous close of ₹722.00.
📈 2-Hour Intraday Support and Resistance Levels
Based on recent technical analysis and intraday chart patterns, here are the key support and resistance levels for SBIN on a 2-hour timeframe:
Immediate Support Levels:
S1: ₹723.00
S2: ₹718.00
S3: ₹710.00
Immediate Resistance Levels:
R1: ₹735.00
R2: ₹745.00
R3: ₹755.00
These levels are derived from recent price action and volume analysis, indicating potential breakout points and areas where the stock may find support.
🔍 Technical Indicators
50-Day EMA: ₹858.16 (Stock is trading above this level, indicating a bullish short-term trend)
100-Day EMA: ₹839.78 (Stock is trading above this level, indicating a bullish mid-term trend)
200-Day EMA: ₹812.92 (Stock is trading above this level, indicating a bullish long-term trend)
MACD: Bearish crossover observed, suggesting potential short-term weakness
RSI (14): Below 30, indicating oversold conditions
MFI (14): 24.19, suggesting sideways movement
CCI (20): Below -100, indicating oversold conditions
William %R (14): -78.98, indicating oversold conditions
ADX (14): Above 20 with +DI below -DI, indicating a downtrend
PSAR: 238.73, acting as a stop-loss for long positions
These indicators suggest a potential short-term pullback, but the overall trend remains bullish.
📊 Chart Patterns
A recent Cup and Handle pattern has been observed, with the price breaking out from the handle formation. The measured move suggests a potential target of ₹1,342.35, contingent upon sustained volume and price momentum.
⚠️ Important Notes
Risk Management: Always use appropriate stop-loss orders to manage risk.
Market Conditions: Intraday levels are subject to change based on market conditions and news events.
Consult Professionals: Consider consulting with a financial advisor before making investment decisions.