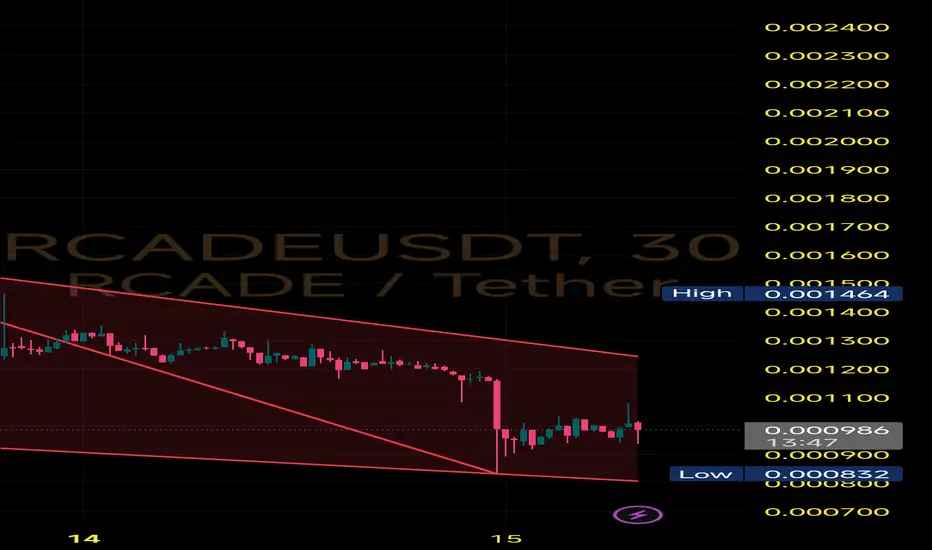
$RCADE 30mins Chart Analysis
A falling wedge is formed when price makes lower highs and lower lows within converging trendlines. It’s typically a bullish pattern, especially after an extended downtrend like this one.
Current Situation - Price touched the lower wedge boundary at $0.000832 (latest local low)
Multiple taps on both support and resistance trendlines confirm wedge validity
Quick rebound from the wedge bottom hints that buyers are stepping in
🔹Breakout zone above $0.00110–$0.00115 could trigger rapid move
🔸Immediate resistance levels: $0.00130 → $0.00150 → $0.00180
⚠️ Invalidation:
A breakdown below $0.00083 with high volume would invalidate the wedge and resume the downtrend.
RCADEUSDT trade ideas
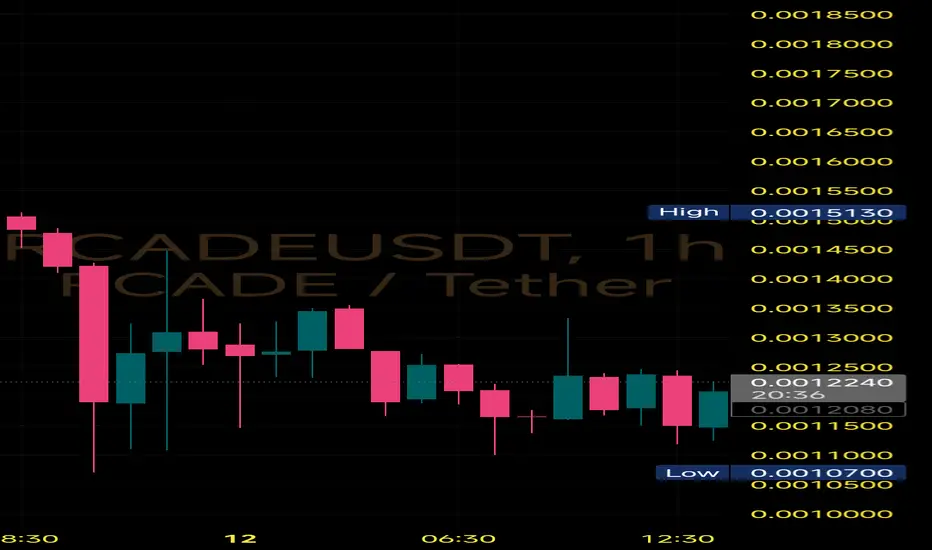
$RCADE 1Hr Chart Analysis
#RCADE is showing signs of a potential reversal on the 1Hr timeframe, forming a Double Bottom near the 0.00117 support zone.
🔹Bottom 1 and Bottom 2 are now clearly defined
🔹Neckline resistance at ~0.00145
🔹Current price hovering around 0.00122
Bullish only if -
A breakout and close above 0.00145 with volume = confirmation of reversal
Target zone = 0.00160–0.00170
Breakdown below 0.00117 would invalidate the double bottom setup
⏳ Price is compressing—watch for breakout attempts soon.