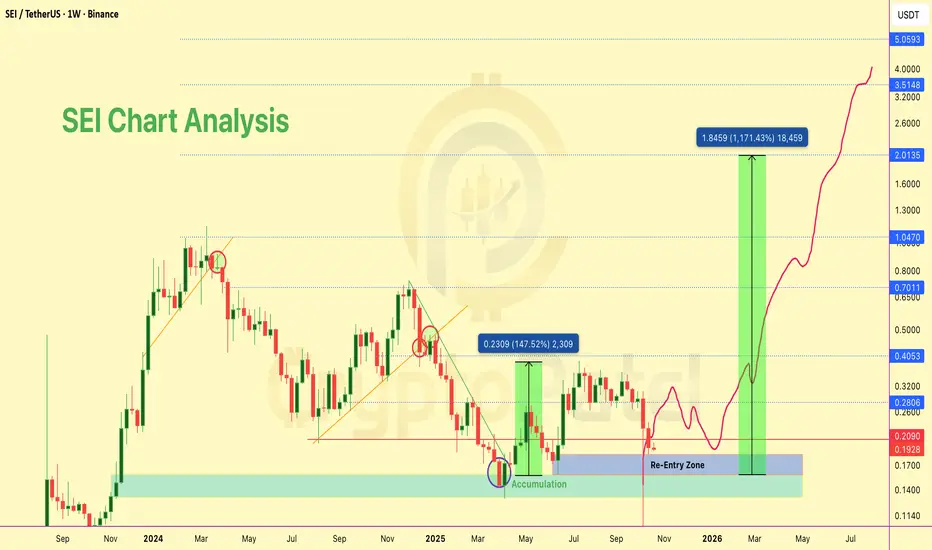
$SEI ACCUMULATION PATTERN FORMING🚨 NYSE:SEI ACCUMULATION PATTERN FORMING 🚨
If you missed the first run (+140%), here's your second chance.
We're back at re-entry levels after accumulation cycle.
RE-ACCUMULATION ZONE: $0.20 - $0.16
TARGETS: 5x-20x (realistic on strong fundamentals)
This isn't hype. Strong backing + proven accum
Related pairs
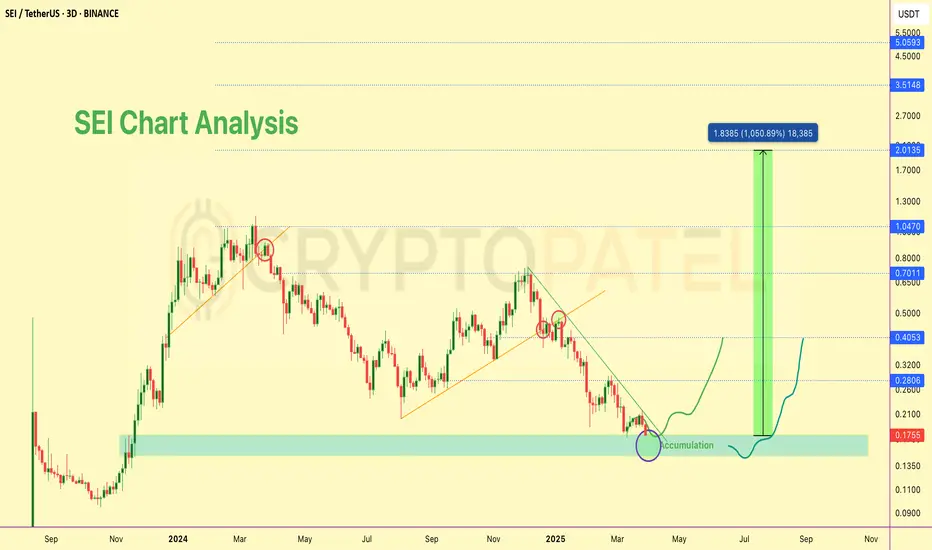
Will $SEI hit $2 in current bull market?NYSE:SEI up 140% from my initial entry, but I'm targeting an 800% gain from current levels 🚀
Looking at $2 as a key target in this bull run — strong support, bullish structure, and key levels lined up.
Let’s see if NYSE:SEI can make this move 💎
NFa & DYOR


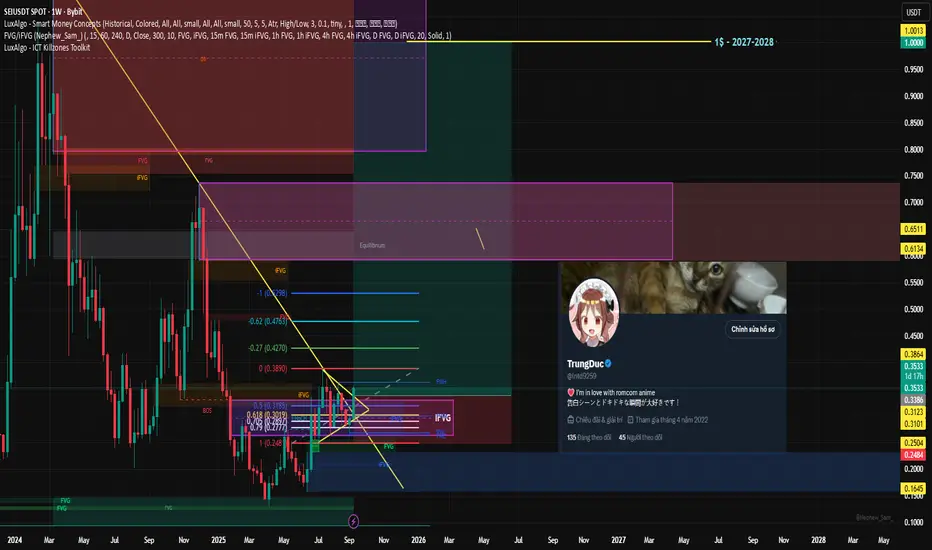
[TRUNGDUC] In my perspective, the coin named SEI will go to soonThe likelihood of SEI “returning to the $0.6–$1.4 range” by 2026–27 is fairly high (≈ more than half) if the ecosystem remains intact. The $1.8–$2.5 zone would require further breakthroughs in TVL/catalysts, while the 2028–30 scenario largely depends on whether Giga can turn its promises into real-w
Trade Strategy for TodayA popular scalp-retracement strategy could work well given the current consolidation:
1. Short-Term Bearish (Scalp/Short)
Entry range: ~$0.2700–$0.2730 (watch for resistance at $0.2776–$0.2800) .
Targets:
TP1: $0.2650
TP2: $0.2600 (fills the fair value gap)
Stop-Loss: Above $0.2780 (> recen

SEI to 1 dollar?Previous resistance broken, EMA 200 broken , big double bottom on the chart, and a small hint of bullish news
Makes a perfect recipe for sei pumping to 70¢
If that's okay

$SEI to $2? Trump-backed + Institutional Buys = Next Altcoin NYSE:SEI to $2? Trump-backed + Institutional Buys = Next Altcoin Rocket!
#SEI already pumped +100% from our entry! Hope you enjoyed the ride.
But I’m still massively bullish on this setup.
▶️ Price is consolidating near strong support at $0.20–$0.14
▶️ This is a golden accumulation zone for the n

Next 10x Gem?: SEI Bulls Eye $2+ After Key ChoCh at $0.22$SEI/USDT – Long-Term Technical Outlook
Price has likely established a local bottom near the $0.13–$0.15 demand zone, signaling potential for a macro accumulation phase.
🔸 Primary Accumulation Zone: $0.15–$0.13
🔸 Break of Structure Support: Below $0.13 opens downside to $0.10–$0.09 (secondary accu

$SEI/USDT- Long-Term Technical Setup and $5 Potential in BullRun📊 $SEI/USDT – Long-Term Technical Setup
NYSE:SEI is holding strong at the $0.18 support zone, showing early signs of accumulation. This level has historically acted as a demand area, making it a key zone to watch.
🔹 Structure: Forming higher lows – bullish trend intact
🔹 Volume: Accumulation pre
SEI TO MAKE 2X IN COMING DAYSThe CRYPTOCAP:ETH chart shows prices hovering around a key support zone of 1,750 - 1,830 within a descending channel. The red Ichimoku Cloud above acts as a strong resistance barrier, indicating potential challenges in breaking upwards.
If support holds, aim for a bounce towards the cloud resista

See all ideas
Summarizing what the indicators are suggesting.
Oscillators
Neutral
SellBuy
Strong sellStrong buy
Strong sellSellNeutralBuyStrong buy
Oscillators
Neutral
SellBuy
Strong sellStrong buy
Strong sellSellNeutralBuyStrong buy
Summary
Neutral
SellBuy
Strong sellStrong buy
Strong sellSellNeutralBuyStrong buy
Summary
Neutral
SellBuy
Strong sellStrong buy
Strong sellSellNeutralBuyStrong buy
Summary
Neutral
SellBuy
Strong sellStrong buy
Strong sellSellNeutralBuyStrong buy
Moving Averages
Neutral
SellBuy
Strong sellStrong buy
Strong sellSellNeutralBuyStrong buy
Moving Averages
Neutral
SellBuy
Strong sellStrong buy
Strong sellSellNeutralBuyStrong buy
Displays a symbol's price movements over previous years to identify recurring trends.
Frequently Asked Questions
The current price of SEI / UST (SEI) is 0.07647400 USDT — it has risen 0.12% in the past 24 hours. Try placing this info into the context by checking out what coins are also gaining and losing at the moment and seeing SEI price chart.
SEI / UST price has fallen by −9.57% over the last week, its month performance shows a −37.74% decrease, and as for the last year, SEI / UST has decreased by −64.72%. See more dynamics on SEI price chart.
Keep track of coins' changes with our Crypto Coins Heatmap.
Keep track of coins' changes with our Crypto Coins Heatmap.
SEI / UST (SEI) reached its highest price on Jan 2, 2024 — it amounted to 1.43000000 USDT. Find more insights on the SEI price chart.
See the list of crypto gainers and choose what best fits your strategy.
See the list of crypto gainers and choose what best fits your strategy.
SEI / UST (SEI) reached the lowest price of 0.00950000 USDT on Jul 23, 2025. View more SEI / UST dynamics on the price chart.
See the list of crypto losers to find unexpected opportunities.
See the list of crypto losers to find unexpected opportunities.
The safest choice when buying SEI is to go to a well-known crypto exchange. Some of the popular names are Binance, Coinbase, Kraken. But you'll have to find a reliable broker and create an account first. You can trade SEI right from TradingView charts — just choose a broker and connect to your account.
Crypto markets are famous for their volatility, so one should study all the available stats before adding crypto assets to their portfolio. Very often it's technical analysis that comes in handy. We prepared technical ratings for SEI / UST (SEI): today its technical analysis shows the sell signal, and according to the 1 week rating SEI shows the strong sell signal. And you'd better dig deeper and study 1 month rating too — it's sell. Find inspiration in SEI / UST trading ideas and keep track of what's moving crypto markets with our crypto news feed.
SEI / UST (SEI) is just as reliable as any other crypto asset — this corner of the world market is highly volatile. Today, for instance, SEI / UST is estimated as 5.78% volatile. The only thing it means is that you must prepare and examine all available information before making a decision. And if you're not sure about SEI / UST, you can find more inspiration in our curated watchlists.
You can discuss SEI / UST (SEI) with other users in our public chats, Minds or in the comments to Ideas.