SOL DUMP TO THE $40YES, YOU SEEN RIGHT
CRYPTO:SOLUSD
SOL ready with multiple negative patterns.
1. all time resistance
2. triple top
3. cup and handle failure
First pattern is already activated and triple top near to active.
Reverse scenario
take support from major strong support. cup and handle breakout
🧠 Alwa

FVG Retracement in a Downtrend📈 Solana Chart – Fair Value Gap Retracement in a Bearish Market Structure
This chart highlights a clear bearish sequence, defined by a repeated formation of Lower Highs (LH) and Lower Lows (LL) with some Higher Highs (HH) and Higher Lows (HL). Throughout this downtrend, multiple Fair Value Gaps (

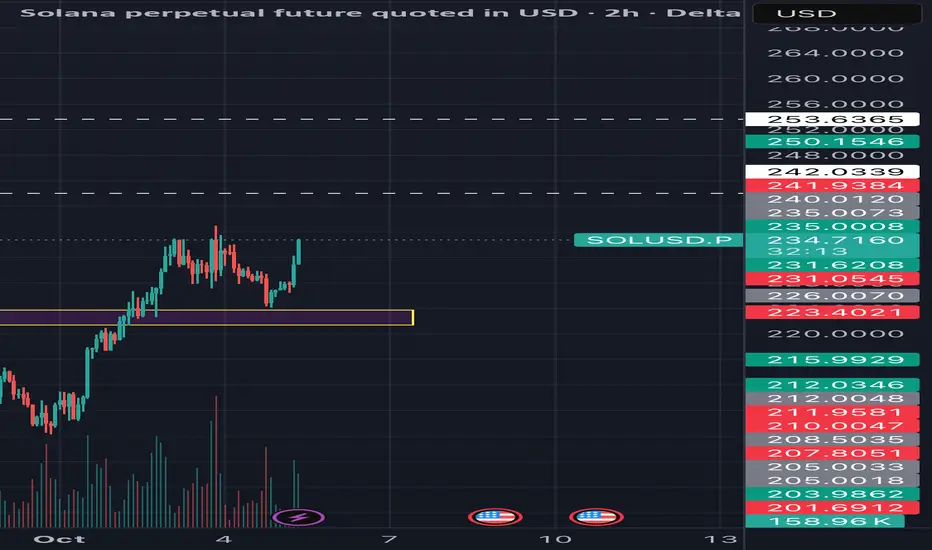
SOLUSD TRADING LEVELSTrading Levels for SOLUSD
Anyone can Trade on both sides (as per levels). WITH STRICT SL.
Levels shared on chart

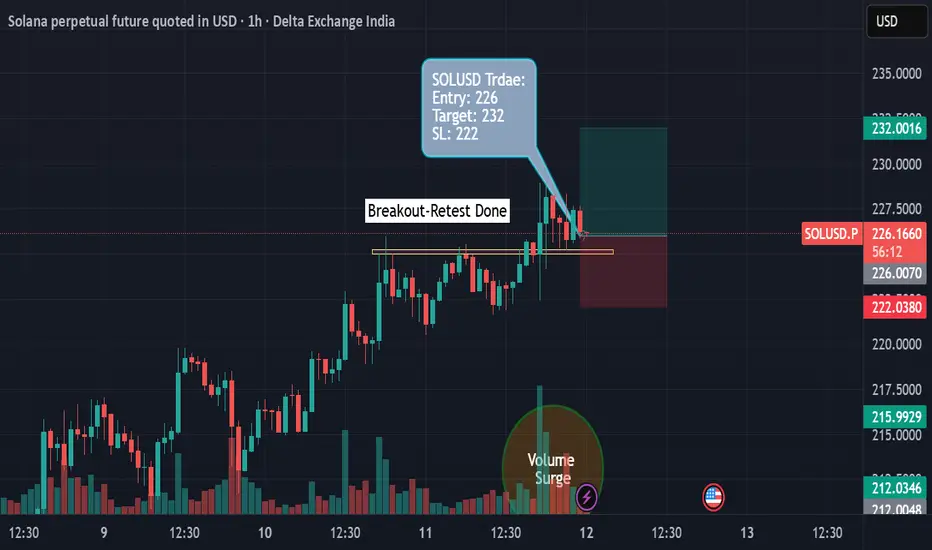
Breakout Play: Demand Zone Reversal with High R:R TargetOverview :
This idea focuses on a breakout trade for Solana (SOLUSD), leveraging recent price action and volume signals at a key demand zone. The setup is designed for a high risk-to-reward ratio based on technical structure and confirmation tools.
Trade Setup & Logic:
• Entry: Price retraced to
Don't miss this explosive move on solana!!!Its taking rejection from 0.5 of fib and volume profile rejection from low volume indicates an upward move.
ONLY and ONLY go for buy if you see a bullish candle !!!
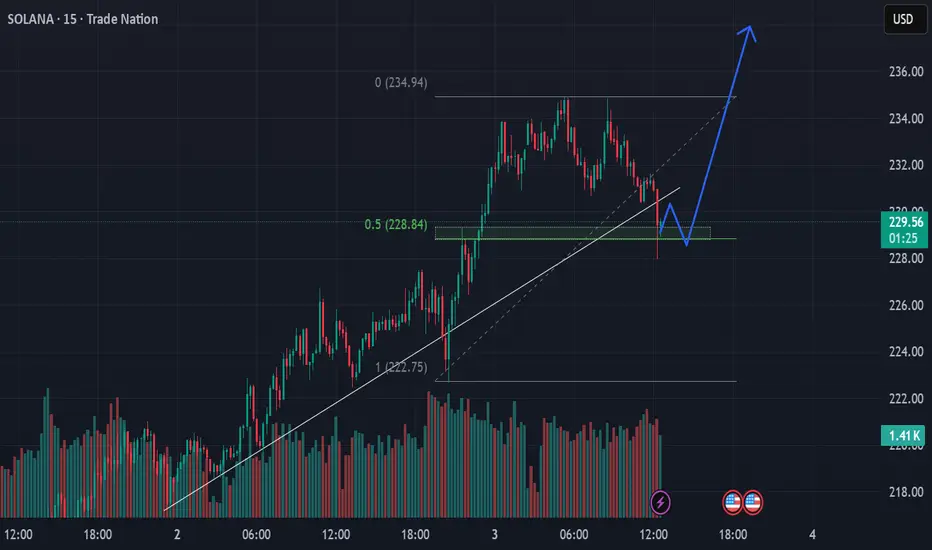
On reversal in 1hr and in 4hr GO LONG in SOLANA199.2162 looks like a good level from where a smaller time frame reversal is expected.
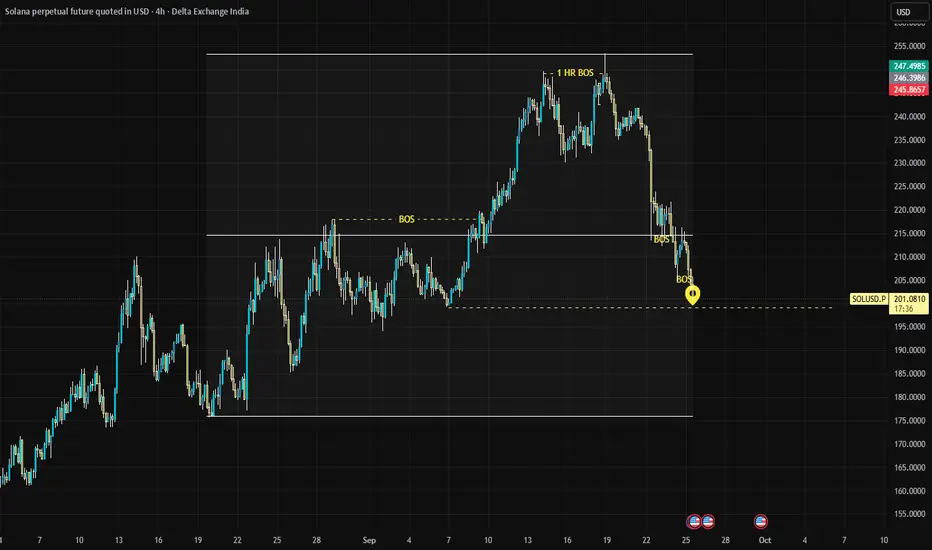
CRYPTO ALERT: SOLANA SHORT TERM BEARISH TREND IN 4H CHARTSOLANA, one of the most traded crypto after BTC and ETH is in a short term bearish trend on the 4H chart. It has multiple demand zones and unmitigated order blocks pending for execution before any further upward movement.
SOLUSD can be shorted at CMP 236 with Stop Loss at 244 for short term targets

SOLANA/USDT Buy Setup – Daily Bullish MomentumMarket Overview
Solana (SOL/USDT) continues to show strength on higher timeframes. The daily chart structure is bullish, and momentum aligns with the weekly timeframe, creating a strong confluence for further upside.
Buy Zone & Entry Strategy
We are looking to accumulate in two parts within the key

Solana (1H Chart) - Breakout-Retest Long TradeThis is a long trade setup for Solana perpetual futures based on a breakout and retest structure, placed on the 1-hour chart.
Trade Overview
• The chart shows price consolidating near a horizontal resistance zone (yellow line), followed by a breakout above this level and a subsequent retest.
• T
Solana Breakout: Ready for Bull Rally After Key Resistance FlipSolana (SOL) has decisively broken out above key resistance in September 2025, signaling strong bullish momentum as traders eye new targets.
Technical Setup and Breakdown:
Solana (SOL) has decisively broken out above the key resistance zone of $200–$210, a level that capped price gains for month

See all ideas
Summarizing what the indicators are suggesting.
Oscillators
Neutral
SellBuy
Strong sellStrong buy
Strong sellSellNeutralBuyStrong buy
Oscillators
Neutral
SellBuy
Strong sellStrong buy
Strong sellSellNeutralBuyStrong buy
Summary
Neutral
SellBuy
Strong sellStrong buy
Strong sellSellNeutralBuyStrong buy
Summary
Neutral
SellBuy
Strong sellStrong buy
Strong sellSellNeutralBuyStrong buy
Summary
Neutral
SellBuy
Strong sellStrong buy
Strong sellSellNeutralBuyStrong buy
Moving Averages
Neutral
SellBuy
Strong sellStrong buy
Strong sellSellNeutralBuyStrong buy
Moving Averages
Neutral
SellBuy
Strong sellStrong buy
Strong sellSellNeutralBuyStrong buy
Displays a symbol's price movements over previous years to identify recurring trends.
Curated watchlists where SOLUSD.P is featured.

Gen 3 crypto: A new day dawns…
25 No. of Symbols

Smart contracts: Make the smart decision
36 No. of Symbols

Staking Coins: Pick up a stake
18 No. of Symbols

Top altcoins: Choose your alternatives carefully
28 No. of Symbols

Up-and-coming crypto: New kids on the block
30 No. of Symbols
See all sparks