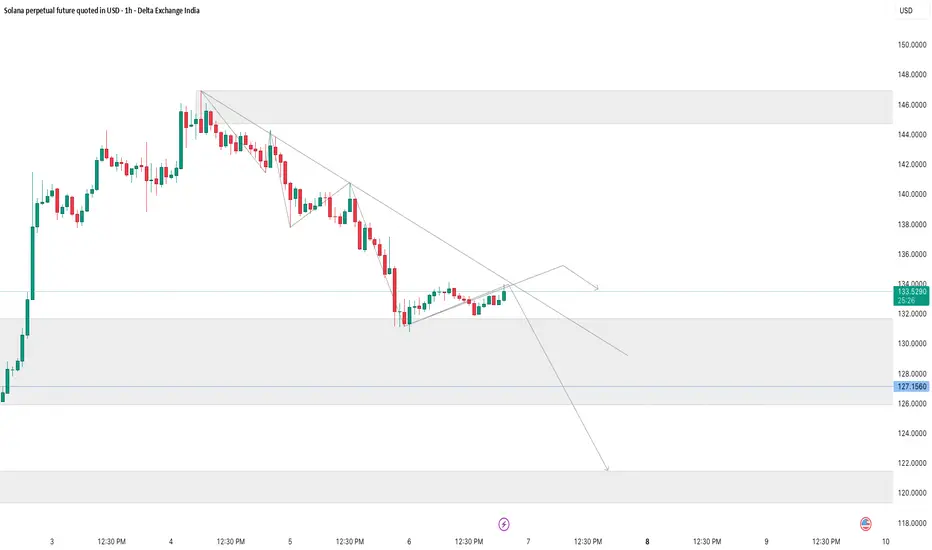
SOL | Descending Trendline Retest – Possible Pullback Toward DemSolana (SOL) is currently trading under a strong descending trendline on the 1H timeframe.
Price has made a minor recovery and is retesting the trendline from below, indicating a potential lower-high formation.
Key Observations
Price is respecting a clear downtrend structure.
Currently near a trendline + minor resistance confluence, indicating possible rejection.
A major demand zone lies between 128 – 127, where buyers have previously reacted.
If the trendline rejection holds, price may continue downward.
Bearish Scenario
If SOL rejects from the trendline,
→ Expect a move back into 128–127 demand zone.
A breakdown below this zone may extend the drop toward 120–118 deeper demand.
Bullish Invalidations
A clean breakout and retest above 138.26 would shift momentum bullish
→ Possible reversal toward 144–147 supply area.
Trading Plan (Not financial advice)
Wait for confirmation on trendline rejection before entering.
Target 1: 128
Target 2: 120–118 zone
Invalidation: Break & close above 138.26 (trend reversal zone)
Trade ideas
Part 3 Learn Institutional Trading Why Do People Trade Options?
Traders use options for three main reasons:
a) Hedging
To protect their portfolios from losses.
Example: If you own shares and fear a price drop, you can buy put options to act as insurance.
b) Speculation
To profit from price movements using small capital.
Options allow traders to control large positions for a fraction of the cost.
c) Income Generation
By selling options, traders can earn premium income regularly.

SOLUSD COMPLETE TRADING PLAN (BUY, SELL, NO-TRADE ZONES)PRICE IS CURRENTLY INSIDE A SUPPLY / SELL ZONE
The light-blue highlighted area is a strong supply zone between:
🔵 Supply Zone (Sell Zone)
146.00 – 149.00
Price has tapped this zone 3 times → weakness for buyers → sellers may take control.
🚫 NO-TRADE ZONE (RIGHT NOW)
The region where price is stuck is:
🚫 No-Trade Zone: 144.00 – 146.00
Reason:
Price is consolidating
Multiple rejections
Both bulls & bears fighting
Not safe for entering until breakout or rejection confirmation
🔥 SELL SETUP (High Probability)
This is the safest setup at the moment.
📍 SELL ENTRY
146.50 – 148.50 (inside the supply zone)
🛑 SL (Stoploss)
150.50
Above previous wick + above the zone.
🎯 TP (Targets)
1️⃣ 140.15
2️⃣ 136.12
3️⃣ 134.84 → strong demand
4️⃣ 130.56 → final target
This gives excellent RR (Reward–Risk).
🟢 BUY SETUP (Only After Breakout)
Don’t buy inside the zone.
Buy only if candles close above the zone.
📍 BUY ENTRY
Above 150.00 (Breakout + Retest)
🛑 SL
147.80
🎯 TP
1️⃣ 153.50
2️⃣ 157.20
3️⃣ 163.94
🟡 BUY SETUP (Pullback Buy)
If price drops to demand zone:
📍 BUY ENTRY ZONE
140.15 – 136.12
🛑 SL
134.00
🎯 TP
1️⃣ 144.00
2️⃣ 146.00
3️⃣ 148.00
📌 SUMMARY
🚫 NO TRADE:
144.00 – 146.00
🔥 SELL SETUP:
Entry: 146.50 – 148.50
SL: 150.50
TP: 140.15 → 136.12 → 134.84 → 130.56
🟢 BUY SETUP (Breakout Buy):
Entry: Above 150
SL: 147.80
TP: 153.50 → 157.20 → 163.94
🟢 BUY SETUP (Demand Buy):
Entry: 140.15 – 136.12
SL: 134
TP: 144 – 146 – 148

Solana ready to Rise till 160It has crossed weekly hurdle of 140 and now it will consolidate till 134, than jump further till 160-170 for next 10-15 points consolidation

SOL DUMP TO THE $40YES, YOU SEEN RIGHT
CRYPTO:SOLUSD
SOL ready with multiple negative patterns.
1. all time resistance
2. triple top
3. cup and handle failure
First pattern is already activated and triple top near to active.
Reverse scenario
take support from major strong support. cup and handle breakout
🧠 Always DYOR (Do Your Own Research)
⚖️ This is not financial advice or suggestion
👉 “Risk Is Real 💸 Stay Practical🚀”
💬 Please feel free to ask any questions (It's Free)

FVG Retracement in a Downtrend📈 Solana Chart – Fair Value Gap Retracement in a Bearish Market Structure
This chart highlights a clear bearish sequence, defined by a repeated formation of Lower Highs (LH) and Lower Lows (LL) with some Higher Highs (HH) and Higher Lows (HL). Throughout this downtrend, multiple Fair Value Gaps (FVGs) have emerged — each representing price inefficiencies created by strong institutional sell-side displacement.
As price continues to decline, these historical FVGs above the current market reveal a consistent pattern:
price retraces into previous imbalances, rebalances them, and then resumes the downward trajectory.
In the current setup, two active bearish FVGs have formed. The upper zone carries greater priority due to its alignment with a major LH, while the lower FVG — although not high priority — can still generate a corrective pullback.
⸻⸻⸻⸻⸻⸻⸻⸻⸻⸻
📊 Key Observations
1️⃣ Prior FVG Mitigation
A previous FVG was cleanly filled, followed by a sharp rejection — a textbook example of institutional rebalancing.
The reaction confirms the efficiency of using FVGs to anticipate retracement zones in a downtrend.
2️⃣ High-Priority FVG
The upper FVG holds greater importance as it aligns with a major Lower High.
This confluence increases the likelihood of a meaningful rejection should price retrace into this imbalance.
3️⃣ Secondary FVG Reaction Zone
A lower FVG also exists beneath the primary one.
Though not a high-priority inefficiency, it may still trigger a pullback if price interacts with it during corrective movement.
4️⃣ Support Line Liquidity Zone
The descending trendline beneath price may function as a liquidity attractor.
Stops often accumulate below such diagonal structures, making it a potential sweep area before a reaction.
5️⃣ Structural Context
The broader price structure remains decisively bearish.
As long as price trades below the upper FVG, sellers maintain control and retracements serve primarily as rebalancing moves rather than reversal attempts.
⸻⸻⸻⸻⸻⸻⸻⸻⸻⸻
📊 Chart Explanation
Symbol → COINBASE:SOLUSD
Timeframe → 1D
This visualization demonstrates how Fair Value Gaps continue to guide price behavior throughout the downtrend.
Each historical FVG above current price acted as a magnet for retracement, followed by rejection once the inefficiency was filled.
The current structure shows:
A clean downtrend defined by Lower Highs and Lower Lows
A previously filled FVG leading to immediate continuation
A new high-priority FVG near a major LH
A secondary FVG capable of producing a corrective bounce
A descending support line acting as a liquidity pool
Together, these elements showcase classic Smart Money concepts:
inefficiency → retracement → rebalancing → continuation.
Price remains under bearish control unless a decisive break above the primary FVG occurs.
⸻⸻⸻⸻⸻⸻⸻⸻⸻⸻
✅ Summary
Market structure shows a series of LH–LL sequences, confirming a strong downtrend.
Previous FVGs were filled and rejected cleanly, validating order-flow-driven rebalancing.
The upper FVG is the highest-priority reaction zone due to its alignment with a major LH.
A lower FVG may still generate a pullback but carries less structural importance.
The descending support line highlights a potential liquidity sweep before any larger rebound.
⸻⸻⸻⸻⸻⸻⸻⸻⸻⸻
⚠️ Disclaimer
📘 For educational purposes only.
🙅 Not SEBI registered.
❌ Not a buy/sell recommendation.
🧠 Purely a learning resource.
📊 Not Financial Advice.

SOLUSD TRADING LEVELSTrading Levels for SOLUSD
Anyone can Trade on both sides (as per levels). WITH STRICT SL.
Levels shared on chart

Breakout Play: Demand Zone Reversal with High R:R TargetOverview :
This idea focuses on a breakout trade for Solana (SOLUSD), leveraging recent price action and volume signals at a key demand zone. The setup is designed for a high risk-to-reward ratio based on technical structure and confirmation tools.
Trade Setup & Logic:
• Entry: Price retraced to retest the 225–230 support zone, which previously acted as resistance and now converts to demand. Entry is triggered by a strong bullish candle closing above 231.5 with an uptick in volume, confirming renewed buyer interest.
• Stop Loss: Placed below 225, the lower bound of the highlighted demand area, to minimize risk if support fails immediately.
• Targets:
Target 1: 241 (first major supply zone and prior swing high).
Target 2: 253.70(multi-week trend resistance, aligns with fib extension and liquidity clusters).
• Risk-Reward: A minimum R:R of 1:2 is targeted. Stop loss is tightly managed once price moves in favor, with trailing stop as price approaches Target 1.
Technical Factors:
• Support/Resistance: The purple highlighted zone shows a confluence of prior reversal points and volume spikes, indicating strong institutional activity.
• Structure Confirmation: Entry is only valid upon a clear bullish reversal signal above the support zone and confirmation of above-average volume.
• Market Context: Recent downtrend is breaking, with higher lows and higher highs. Supply absorption observed at the retest supports the bullish thesis.
Trading Plan:
• Wait for price to close above 231.5 with volume confirmation before entering.
• Adjust stop loss to breakeven after Target 1.
• Take partial profits at Target 1, let remainder ride up to Target 2.
Final Notes:
Discipline and patience are essential—trade only on confirmation to avoid false breakouts. Self-research is recommended, and risk should always be managed per personal capital allocation protocols
Disclaimer: This is a technical analysis idea, not financial advice. Please perform your own due diligence before trading.
Don't miss this explosive move on solana!!!Its taking rejection from 0.5 of fib and volume profile rejection from low volume indicates an upward move.
ONLY and ONLY go for buy if you see a bullish candle !!!
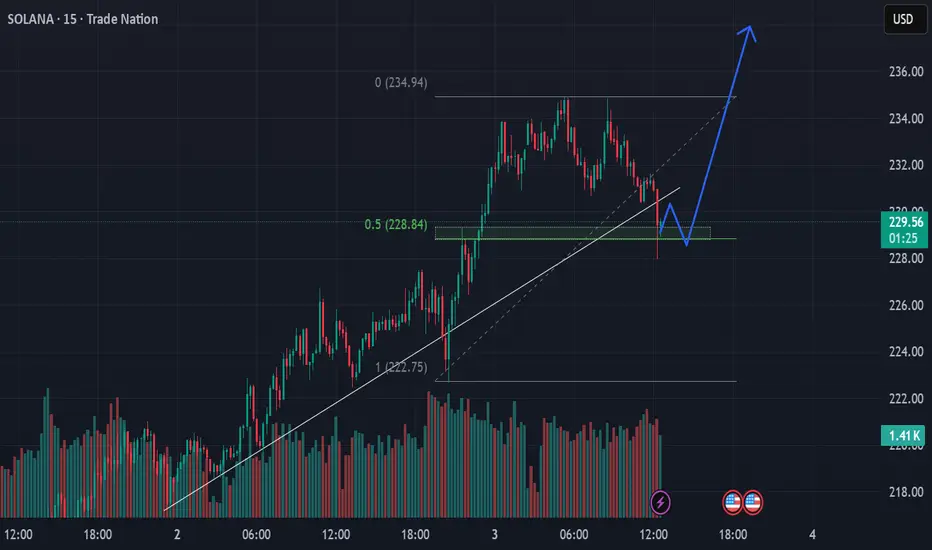
On reversal in 1hr and in 4hr GO LONG in SOLANA199.2162 looks like a good level from where a smaller time frame reversal is expected.
CRYPTO ALERT: SOLANA SHORT TERM BEARISH TREND IN 4H CHARTSOLANA, one of the most traded crypto after BTC and ETH is in a short term bearish trend on the 4H chart. It has multiple demand zones and unmitigated order blocks pending for execution before any further upward movement.
SOLUSD can be shorted at CMP 236 with Stop Loss at 244 for short term targets of 224 - 218 - 200 in a period of 2-3 weeks.
📉 THIS CHANNEL IS ONLY FOR EDUCATIONAL PURPOSES.
Disclaimer: I am Not a SEBI registered analyst. I just share my positions to do paper trading and no where its a recommendation! Please do your own analysis before taking any trade.

SOLANA/USDT Buy Setup – Daily Bullish MomentumMarket Overview
Solana (SOL/USDT) continues to show strength on higher timeframes. The daily chart structure is bullish, and momentum aligns with the weekly timeframe, creating a strong confluence for further upside.
Buy Zone & Entry Strategy
We are looking to accumulate in two parts within the key demand zone:
1st Entry: $218
2nd Entry: $205
Stop Loss (SL): $190 (below structure & invalidation level)
This staggered entry ensures better average positioning while minimizing risk.
Why This Zone?
Daily Bullish Structure: Price has consistently respected higher lows.
Weekly Alignment: Higher timeframe support validates continuation bias.
Discount Area: Entries between $205–218 give exposure to a deeper retracement before the next potential bullish leg.
Risk Management
Always apply strict position sizing. Risking 1–2% of account equity per trade is recommended. If Solana holds above the $205–218 zone, the probability favors continuation toward higher daily targets.
Key Notes
Trend bias: Bullish
Entries: $218 & $205
SL: $190
Confluence: Daily + Weekly Bullish Structure
Reminder: Stick to proper money management
Final Thoughts
Solana remains one of the strongest altcoins in this market cycle. A clean retest into the buy zone ($205–218) could offer a high-risk–reward entry opportunity. Patience and disciplined execution will be key.
TP 290+ Medium Term Targets

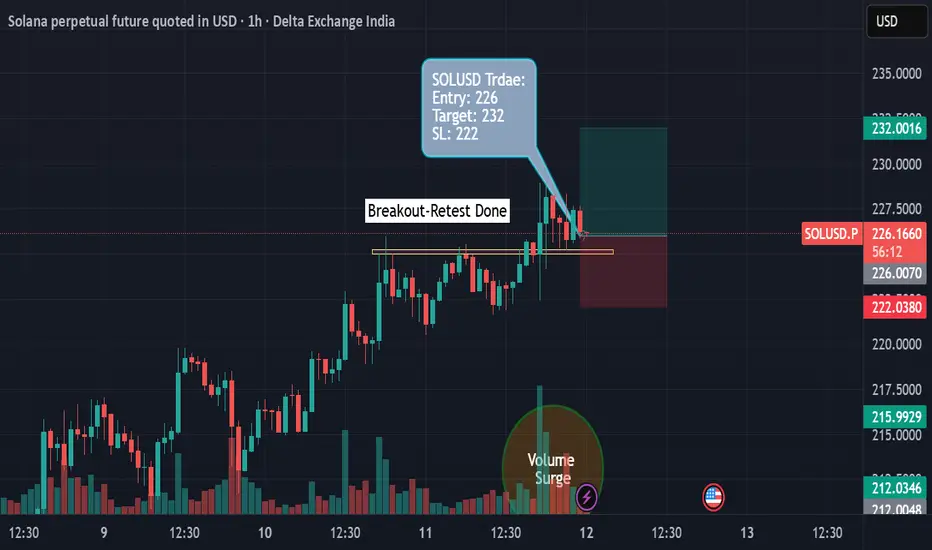
Solana (1H Chart) - Breakout-Retest Long TradeThis is a long trade setup for Solana perpetual futures based on a breakout and retest structure, placed on the 1-hour chart.
Trade Overview
• The chart shows price consolidating near a horizontal resistance zone (yellow line), followed by a breakout above this level and a subsequent retest.
• The entry is taken after confirmation of support at the breakout zone, aiming for a move toward the upper target.
Entry, Target, and Stop-Loss
• Entry: Around 226 USD, following a successful retest of the yellow breakout level.
• Target: 232 USD, marked in green at the upper end of the chart’s risk-reward box.
• Stop-Loss: 222 USD, just below the retest zone, minimizing risk if price reverses.
Trade Logic and Reasoning
• The trade capitalizes on a classic breakout-retest pattern, where price first breaks resistance and then tests it as new support.
• Increasing volume near the breakout supports bullish momentum.
• Risk management is prominent, with a clear stop-loss set below the retest area.
Risk/Reward Profile
This setup offers a favorable risk-to-reward ratio, as visualized by the green/red shaded box indicating potential gain versus loss for the position.
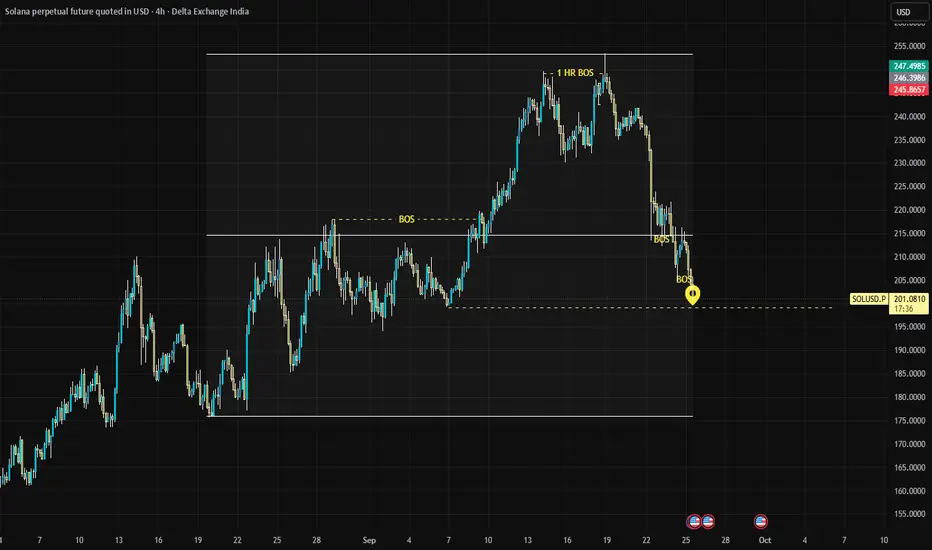
Solana Breakout: Ready for Bull Rally After Key Resistance FlipSolana (SOL) has decisively broken out above key resistance in September 2025, signaling strong bullish momentum as traders eye new targets.
Technical Setup and Breakdown:
Solana (SOL) has decisively broken out above the key resistance zone of $200–$210, a level that capped price gains for months. This breakout is validated by a significant surge in trading volume, signaling strong market conviction behind the move. The previous resistance now flips to support, setting a solid foundation for the next leg of the rally toward $250.
What’s Next? Scenarios and Targets:
The breakout sets the stage for two primary scenarios:
1. Bullish Continuation: If price holds above $210 and builds momentum, Solana could quickly revisit $244–$250 and higher, especially if the crypto market remains positive. Some projections for 2025 suggest targets as high as $350, though immediate monthly resistance sits closer to $250.
2. Pullback Risk: If price fails to sustain above new support, a retest of the Support zone near $205–$210 is possible, providing a key reaction zone for traders.
Final Take:
This chart offers traders a textbook example of a confirmed breakout with actionable price levels and volume confirmation. It provides a structured roadmap for both breakout traders and momentum investors focused on Solana’s bullish momentum.

Bearish Trade Setup for SOLUSDOverview:
This is a short position on SOLUSD, entering on the 1-hour chart with a well-defined risk-to-reward ratio. The trade is based on a downward trend confirmed by the price action and EMAs, making this a high-probability bearish scenario.
Key Levels and Indicators:
Entry Point: 186.6736
The entry is triggered when the price moves below the resistance level. This confirms the continuation of the downtrend.
Stop Loss: 202.2042
The stop loss is set above the most recent swing high to protect from any sudden price reversals. This level is designed to avoid a whipsaw and ensures the trade is kept within a reasonable risk range.
Target: 155.5356
The target is calculated based on a projected price movement in line with the current trend. Given the current market structure, this target provides an optimal reward-to-risk ratio.
Why is this a Bearish Setup?
Trend Confirmation:
The price has been consistently moving lower, showing strong bearish momentum. The EMAs (9 and 20) are also sloping downwards, reinforcing the likelihood of further downside movement.
Price Action:
The recent price action has formed lower highs and lower lows, a key indication of a strong downtrend.
EMA Alignment:
The 9-period EMA (188.6387) is below the 20-period EMA (192.3233), a classic bearish crossover that confirms the downward bias of the market.
Risk-to-Reward Setup:
The trade offers an excellent risk-to-reward ratio of approximately 1:3, which ensures that potential profits outweigh the risk taken on the trade.
Trade Management:
Entry Criteria: Enter the position when the price breaks below the support zone, ideally near the entry point.
Exit Strategy: Target is set at 155.5356, but keep an eye on the price action in case a trend reversal occurs before hitting the target. Always adjust the stop loss to lock in profits as the price moves in your favor.
Final Thoughts:
This is a well-structured bearish trade idea based on both technical analysis and price action. Always ensure that you follow proper risk management rules and adjust your stop loss or take profit levels based on market conditions.

Solana: The Scam or the Breakthrough? | PipGuardSolana: The Scam or the Breakthrough?
Hello there, my colleagues, welcome back!
Article published by PipGuard™ on the TradingView® platform – to continue this free publication, LEAVE A BOOST and a COMMENT, hit the notification bell, and never miss ANOTHER ANALYSIS.
ANALYSIS
Hello everyone,
I know many of you appreciate my analyses, and I thank you for the support. As you know, I spend most of my time on the charts, looking for the best trading opportunities. To avoid missing updates, I recommend you turn on notifications!
Solana, with its ambiguous name, raises a question. Is it the “scam” that will ruin you or the “breakthrough” that will make you take the great leap? Regardless of preferences, what matters is the profit potential.
The Trend to Watch
Solana's dominant trend is clearly bullish. Our focus must remain on growth, but without underestimating possible downside scenarios.
Currently, the price is going through a bullish accumulation phase. There's liquidity to be filled, and we need to keep an eye on two critical levels very close to $210 . This is our support and resistance zone.
Below $210, the risk of a downward correction increases.
Above $210, the bullish trend strengthens.
A possible retracement could push the price into the $175-$160 zone. Here, the market will decide whether to continue falling or resume its upward run.
If Solana breaks above $210 without a retracement, the bullish target remains the $260 zone.
In short, the key levels:
Bullish target: $260
Bearish target: $175-$160
Support/Resistance zone: $210
NEWS
✅ Galaxy Digital, Multicoin, and Jump Crypto are aiming for a $1 billion treasury in Solana, the largest ever seen in the sector.
✅ Sharps Technology soars 70% after raising $400 million for a treasury entirely in Solana, featuring giants like Pantera and ParaFi.
SECRETS
🔓 The return of the Coinbase hacker: a wallet linked to the $300M mega-heist on Coinbase is back in action, buying 38,126 SOL ($8M) around $209.
🔓 The dark side of meme-tokens: on the Solana network, the Kanye West token burned $75M in a week, crashing by 80%. Those who believed in it are now left with worthless paper.
GREETINGS
Remember to leave a GREETING 🚀 or a COMMENT — not because I really need it, but because it's cool to support the one who brings you these bombshells while you're having your coffee.
Talk to you soon,
PipGuard
Article published by PipGuard™ on the TradingView® platform

SOLUSD Long @112SOLUSD trying to consolidate here and tried 2 times to break this Resistance level of 216, but failed we have taken a Long trade according to the market sentiments. Risk Reward Ration is 1:2.
SOLUSD Short trade @205Overall Crypto market is under correction mode. After sharp fall SOLUSD showed some pullback @205 levels and that’s the best entry price to enter for a Short trade. Risk reward ratio is 1:2.5 in this trade.
Entry - 205
Target -198
SL - 207.80

SOL/USDT – Bullish Breakout SetupOn the 1H chart, SOL has broken out of the falling wedge / descending trendline after consolidating for several sessions. The breakout is supported by strong bullish momentum and Heikin Ashi candles showing continuation strength.
Entry: Around current breakout levels (≈196.5)
Stop Loss: 191 (below recent swing low & structure support)
Target: 208 (first major resistance & fib confluence zone)
The risk-reward ratio is favorable, and as long as SOL holds above 191, the bias remains bullish with potential for further upside.
⚠️ This is not financial advice. Please manage risk accordingly.
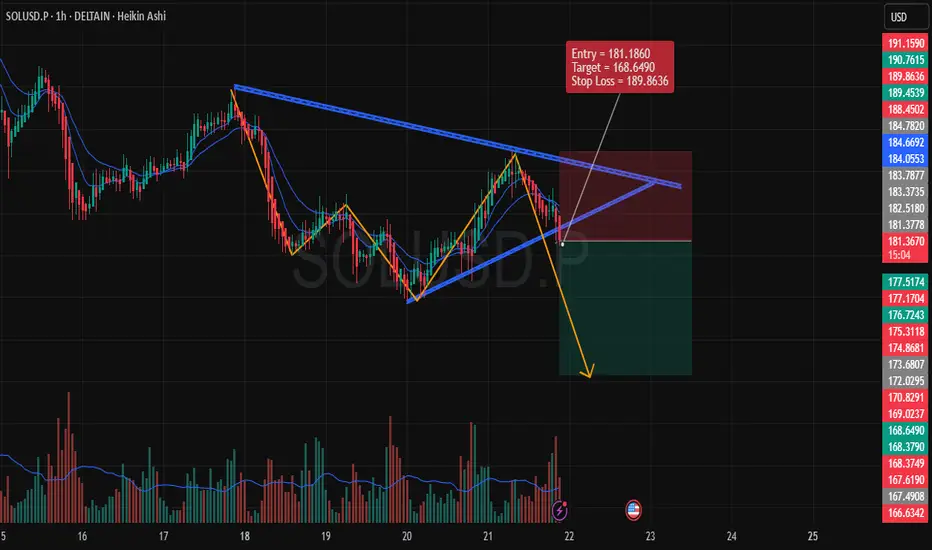
Bearish Setup on SOLUSD (1-Hour Time Frame)Entry Price: 181.1860
Target: 168.6490
Stop Loss (SL): 189.8636
1. Chart Analysis
We are observing a descending triangle pattern formation, which generally signals a bearish continuation once the price breaks downward.
The price action has already shown signs of rejection at the upper boundary of the pattern, reinforcing the possibility of a breakout to the downside.
2. Indicators & Confirmation
Volume Analysis: Noticeable spike in volume during the recent downward movement, which indicates strong selling pressure. This is crucial for confirming the potential bearish trend.
EMA Confluence: The price is below the 9 and 20 EMAs, which are crucial indicators of the current market trend. The EMAs are acting as dynamic resistance, further supporting the bearish scenario.
3. Risk Management
The stop loss is placed above the most recent significant high at 189.8636. This placement ensures that we protect against any false breakouts or short-term price reversals.
The target at 168.6490 is derived based on previous support levels and a measured move from the triangle pattern. This target is realistic given the market structure.
4. Price Action
The price action shows lower highs and lower lows, a typical characteristic of a downtrend. If this pattern holds, the next logical price move is to break downward through the support of the triangle.
5. Conclusion
Overall, this setup provides a solid bearish opportunity, backed by technical patterns and strong momentum indicators. The risk-to-reward ratio is favorable, making it a well-structured trade.
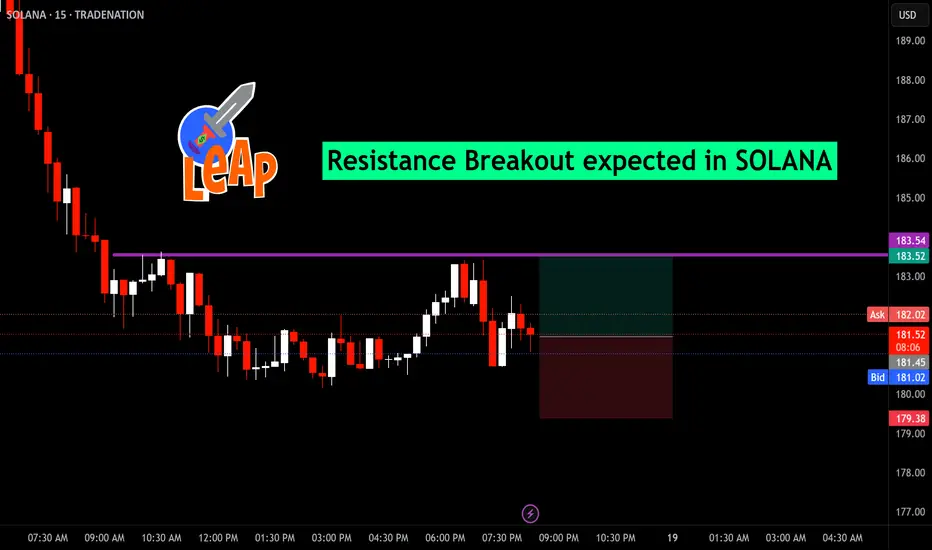
Resistance Breakout expected in SOLANASOLANA Resistance Breakout Alert!
This chart highlights a key trading opportunity in Solana (SOL) on the 15-minute timeframe. After a sustained downward trend, the price is currently consolidating near a significant resistance level at $183.54, marked by the purple horizontal line.
Current Price Action: SOLANA is fluctuating between $179.38 and $182.07, with buyers and sellers locking horns just below resistance.
Breakout Potential: A close above $183.54 (purple line) could trigger bullish momentum and potentially lead to a LEAP in price action.
Trade Setup: Watch for a confirmed breakout above resistance for entry. Target zones and risk management can be visualized on the chart’s green/red areas.
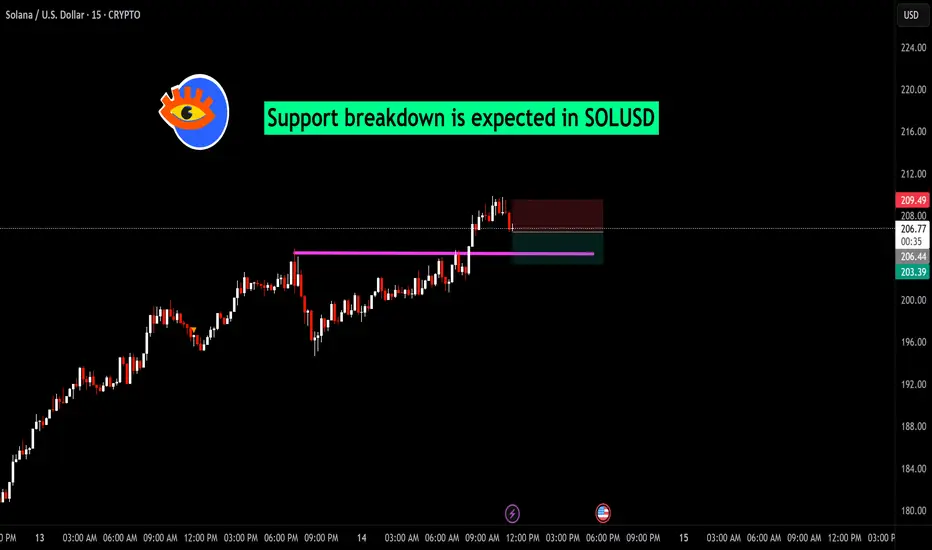
Solana (SOL/USDT) – Short Opportunity on 15-Min ChartSOL/USDT has shown an extended bullish rally, but the recent price action indicates potential short-term exhaustion. On the 15-minute chart, price rejected from the recent high near $209.50, breaking below the immediate support zone and triggering a short setup.
Setup Details:
Entry: Current levels near $206.90
Stop Loss: Above $209.50 (previous swing high)
Target Zone: Around $203.40 (previous support area marked in purple)
This move aligns with an intraday pullback strategy, with risk defined and reward targeting the prior support flip. A decisive break below the purple support line could accelerate downside momentum.
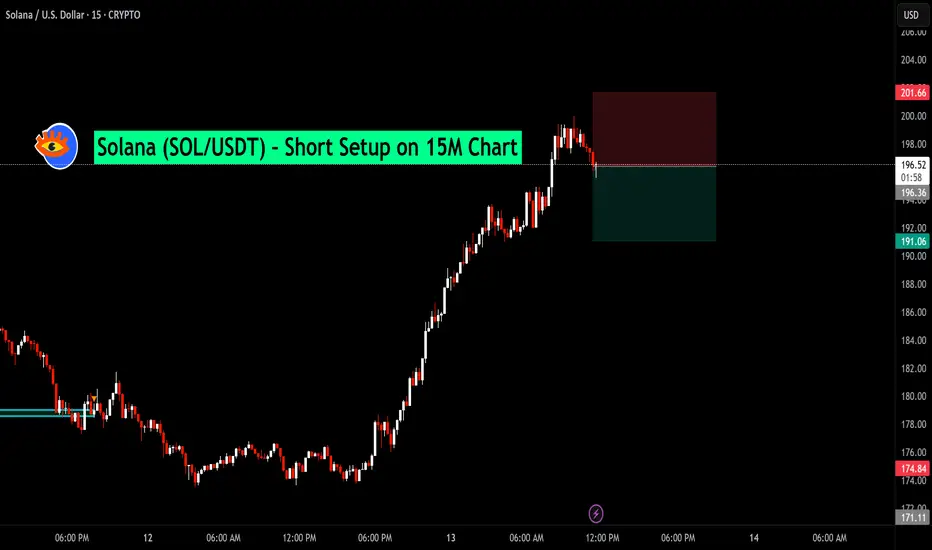
Solana (SOL/USDT) – Short Setup on 15M ChartAfter an extended bullish run, Solana is showing early signs of exhaustion near the $196–$197 zone. Price has failed to sustain above recent highs, forming a potential short-term reversal pattern.
📉 Trade Idea:
Entry: $196.40
Stop Loss: $201.66 (Above recent swing high)
Target: $191.06 (Support zone from prior consolidation)
This setup aims to capture a pullback move following a strong rally, with a favorable risk-to-reward ratio.