Intraday Scalping Tips: Mastering the Art of Fast Profits1. What Is Intraday Scalping?
Scalping is a subset of intraday trading, but with a much shorter time frame. Instead of holding trades for hours, scalpers enter and exit positions within seconds or minutes. The goal is to capture tiny price movements, often ranging from 0.1% to 0.5%, multiple times a day.
For example, if a stock moves from ₹500 to ₹501, a scalper may book a quick profit and repeat the process across different stocks or price levels. Over the course of the day, these small gains can accumulate into substantial profits if managed properly.
However, because scalping involves high trading frequency, transaction costs, timing, and execution speed become critical factors.
2. The Psychology of a Scalper
Scalping is not just about strategy—it’s about mindset. A successful scalper must be calm under pressure, quick in decision-making, and emotionally detached from wins or losses.
Unlike swing traders, scalpers can’t afford to wait for a market to “come back.” They must accept small losses quickly and move on to the next trade. Emotional control and discipline are therefore more important than technical knowledge alone.
Key psychological traits include:
Speed and decisiveness – No hesitation when an entry or exit signal appears.
Emotional neutrality – Avoid greed after profits or frustration after losses.
Discipline – Follow your plan and respect stop-loss limits, no matter what.
3. Essential Tools for Scalping
To succeed as a scalper, you need a professional setup that allows for precision and speed:
Fast Internet Connection: Delays of even a few seconds can affect profits.
Reliable Trading Platform: Choose brokers and platforms with low latency and fast execution (like Zerodha, Angel One, or Upstox for Indian markets).
Direct Market Access (DMA): Helps execute orders directly without delays.
High-Quality Charting Software: For real-time technical analysis (e.g., TradingView).
Level 2 Data / Market Depth: To understand bid-ask spreads and liquidity levels.
Having these tools in place ensures your decisions are based on real-time data and executed without technical lag.
4. Choosing the Right Stocks for Scalping
Not every stock is suitable for scalping. The best scalping stocks share certain characteristics:
High Liquidity: The stock should have high trading volume so you can enter and exit quickly.
Tight Spreads: A small bid-ask spread ensures that transaction costs remain low.
Volatility: Moderate price movement ensures enough opportunities without erratic swings.
Popular Stocks: Large-cap or index-based stocks like Reliance Industries, HDFC Bank, or Infosys are often good choices due to consistent volume.
Scalpers usually stick to 3–5 familiar stocks daily, mastering their price behavior instead of chasing every trending name.
5. Technical Indicators That Work for Scalping
Scalping relies heavily on technical indicators for quick decision-making. Some of the most effective tools include:
Moving Averages (MA): Short-term MAs like 5-EMA and 9-EMA help identify quick trends and crossovers.
VWAP (Volume Weighted Average Price): Acts as a dynamic support and resistance level; many institutional traders use it for intraday benchmarks.
Relative Strength Index (RSI): Helps identify overbought or oversold conditions (ideal range for scalpers: 5–15 RSI periods).
Bollinger Bands: Indicate volatility and possible breakout zones.
Volume Analysis: Volume spikes often precede major price movements—critical for timing entries.
The best scalpers combine 2–3 of these tools rather than cluttering charts with too many indicators.
6. Entry and Exit Strategies
Scalping thrives on timing and precision. Here are a few commonly used strategies:
a. Breakout Scalping
Scalpers wait for the price to break above resistance or below support with strong volume confirmation. Entry happens immediately after the breakout, and exits occur once quick profit targets (0.3%–0.5%) are achieved.
b. Range Scalping
When markets move sideways, scalpers buy near the lower boundary of the range and sell near the upper boundary. Stop-losses are placed just beyond the range.
c. Momentum Scalping
In this method, traders ride short bursts of momentum caused by news, earnings releases, or large market orders. Scalpers jump in with the trend and exit at the first sign of weakness.
Regardless of the method, stop-losses must be placed immediately—typically 0.25%–0.5% below the entry price—to control risk.
7. The Importance of Risk Management
Scalping without risk management is gambling. Since gains are small, even a few large losses can wipe out profits. Effective risk control ensures survival and consistency.
Position Sizing: Don’t risk more than 1%–2% of total capital per trade.
Tight Stop-Loss: Always use stop-loss orders to cap losses quickly.
Avoid Overtrading: Set a limit on the number of trades per day. Quality over quantity.
Keep Costs in Check: Brokerage and taxes can eat into profits. Use low-cost brokers.
Successful scalpers often say: “Protect your capital first; profits will follow.”
8. Trading Discipline and Routine
Consistency is key in scalping. Having a structured trading routine ensures focus and control.
Morning Preparation:
Review pre-market news, global cues, and technical setups.
Identify your watchlist of 3–5 liquid stocks.
Mark key intraday support and resistance zones.
During Trading Hours:
Trade only within your strategy and avoid impulsive trades.
Monitor volume surges and price reactions near key levels.
Book profits quickly; don’t aim for large moves.
Post-Market Review:
Analyze your trades to identify mistakes or strengths.
Maintain a journal recording entry/exit points, emotions, and results.
This continuous improvement mindset separates professional scalpers from amateurs.
9. Avoid Common Scalping Mistakes
Even experienced traders can fall into common traps. Be aware of these:
Over-leveraging: Using too much margin increases the risk of large losses.
Ignoring News Events: Sudden announcements can cause unexpected volatility.
Chasing Trades: Don’t enter trades just because of missed opportunities.
Neglecting Transaction Costs: Frequent trading magnifies brokerage and taxes.
Lack of Patience: Waiting for the right setup is part of the discipline.
Remember, in scalping, one bad trade can ruin ten good ones.
10. Building a Winning Scalping Mindset
Success in scalping is not about winning every trade—it’s about consistency. A skilled scalper understands that small, steady gains compound over time.
Focus on process over profit:
Stick to your rules.
Accept small losses gracefully.
Never revenge-trade after a loss.
Stay humble—markets reward patience and discipline.
Professional scalpers often compare their work to that of a surgeon: precise, focused, and unemotional.
Conclusion
Intraday scalping is an art that blends speed, strategy, and discipline. It may not suit everyone—its fast pace and emotional intensity demand exceptional control and focus. However, for those who master it, scalping can be one of the most consistent and lucrative trading styles.
By understanding market micro-movements, managing risk, and following a structured trading plan, traders can turn tiny price fluctuations into meaningful daily income. In the world of scalping, success doesn’t come from predicting the market—it comes from reacting to it faster and smarter than everyone else.
Trade ideas
Solana Price Action Turns BearishSolana’s market structure shows a gradual weakening of bullish momentum after an extended upward phase earlier in the month. The asset experienced a breakout that temporarily fueled optimism among traders, but recent sessions indicate a loss of strength as sellers began to dominate. The volume profile suggests that market participants are shifting focus from accumulation to potential distribution, reflecting caution ahead of broader market developments.
Price movements over the past few weeks show that Solana has transitioned from impulsive bullish waves into a corrective environment. This phase reflects uncertainty and potential repositioning by large holders. The consolidation seen mid-cycle indicates a period of balance before a directional move resumes. Current activity implies that short-term liquidity adjustments are occurring, and volatility may expand in the coming sessions.
Market sentiment remains sensitive, with investor confidence depending largely on macroeconomic flows and digital asset liquidity trends. Solana’s performance continues to mirror broader crypto risk appetite, where speculative behavior is being tempered by cautious profit-taking. If momentum continues to decline, extended corrective movement could unfold as participants await new catalysts.
Overall, the report indicates that Solana is entering a controlled phase of distribution where institutional participants may be preparing for another medium-term adjustment in valuation.

SOL/USDT (1H timeframe)...SOL/USDT (1H timeframe):
Here’s a clear technical breakdown 👇
🧭 Chart Overview:
Current price: around $200.40
Trend: Uptrend, but showing short-term pullback
Support area: $190 – $195
Resistance area: $205 – $210
🔍 Key Observations:
The ascending trendline is acting as dynamic support.
Price recently rejected near the $210 resistance zone and is pulling back toward the trendline and Ichimoku cloud.
The target points marked on my chart suggest downside retracements if support breaks.
---
🎯 Target Levels:
If price stays above the trendline/support → bullish continuation:
Target 1: $207
Target 2: $212
Target 3: $220 (major breakout target)
If price breaks below the trendline/cloud support → bearish correction:
Target 1: $195 (short-term support / first target point)
Target 2: $188 (lower target zone marked on chart)
Target 3: $180 (major downside target if correction deepens)
---
⚠ Summary:
📈 Bullish scenario: Hold above $198 → move to $207–$212.
📉 Bearish scenario: Break below $198 → drop to $195 → $188.

Part 1 Master Candle Stick PatternOption trading is a popular part of the financial market that allows investors to buy or sell the right—but not the obligation—to trade a stock or asset at a specific price within a certain time period. It’s a flexible and powerful tool used by traders to make profits, hedge risks, or plan future investments.
What is an Option?
An option is a contract between two parties — the buyer and the seller. It gives the buyer the right to buy or sell an asset (like a stock) at a fixed price, known as the strike price, before a set date called the expiry date. There are two main types of options:
Call Option – Gives the holder the right to buy an asset at the strike price.
Put Option – Gives the holder the right to sell an asset at the strike price.

$SOL is showing a classic Head & Shoulders formation on the 1HrCRYPTOCAP:SOL is showing a classic Head & Shoulders formation on the 1-hour chart, a potential early signal of a short-term trend reversal if neckline support gives way.
🔸Left Shoulder: around $198
🔹Head (Peak): near $205
🔸Right Shoulder: formed close to $202
🔹Neckline Support: currently at $192 – $193
Price is now hovering just above that neckline — a critical pivot area.
🔹 Support Zones
$191 (Neckline) → crucial short-term support.
$188 → next reaction zone if neckline fails.
$177 – $180 → full measured move target if breakdown confirms.
🔹 Resistance Zones
$198 – $200 → short-term recovery resistance.
$205 → pattern invalidation if price reclaims and holds above.
If #SOL breaks below $191 with volume confirmation, a quick drop toward $185–$180 looks likely.
If bulls defend the neckline and push back above $200, it could negate the pattern and retest $205+.
📉 Bearish bias short-term while below $193
📈 Bullish recovery only above $200
🎯 Breakdown target: $180 zone
Stay sharp — #Solana is at a make-or-break neckline, and volatility could pick up fast! 🎯

Part 7 Trading Master ClassOption Greeks: Measuring Sensitivity
Professional traders use “Greeks” to assess how option prices change with market variables:
Delta (Δ): Measures the rate of change in option price relative to the underlying asset’s price.
Gamma (Γ): Measures how Delta changes with price movement.
Theta (Θ): Represents time decay – how much value an option loses daily as expiry nears.
Vega (ν): Sensitivity to volatility changes.
Rho (ρ): Sensitivity to interest rate changes.
Understanding Greeks helps traders manage portfolio risks and design advanced strategies.

[SeoVereign] SOLANA BEARISH Outlook – October 27, 2025Hello everyone,
This idea presents a bearish (short) outlook on Solana as of October 27.
Currently, Solana has entered a short-term overheated zone,
and we are beginning to observe a gradual inflow of selling pressure.
First Basis — (DEEP) GARTLEY Pattern
Solana is currently located within the PRZ (Potential Reversal Zone) of a (DEEP) GARTLEY pattern.
This zone is typically recognized as the terminal phase of a short-term upward wave,
where a trend reversal to the downside often occurs due to overbought conditions.
Second Basis — WAVE.M = WAVE.N × 0.786
The ongoing M-wave has formed approximately 78.6% of the length of the previous N-wave,
which represents a classic reversal structure commonly observed within the GARTLEY pattern.
Therefore, entering a short position within this range is considered technically valid.
Accordingly, the average target price is set around 184.97 USDT.
Depending on future price developments,
I will provide further updates on refinements to this idea and position management strategies.
Thank you for reading.

SOLANA 27,560% CYCLE IS ABOUT TO REPEAT - $9,200 TARGET BY 2029 SOLANA 27,560% CYCLE IS ABOUT TO REPEAT - $9,200 TARGET BY 2029
Previous Bull Cycle Metrics:
1️⃣ Duration: 1,492 days
2️⃣ % Gain: 27,560%
3️⃣ Price: $1 → $295
Now here's where it gets CRAZY...
IF we get a healthy retracement to the golden pocket ($60-$35), and IF the fractal repeats:
1️⃣ Bottom: $60-$35
2️⃣ Same % gain: 27,560%
3️⃣ Same timeframe: 1492 days (Feb 2029)
This is Wyckoff accumulation into parabolic expansion.
The risk/reward is GENERATIONAL
Bookmark this. Screenshot this. Thank me in 2029.
This is just my math based on past fractals & returns. Not financial advice - DYOR

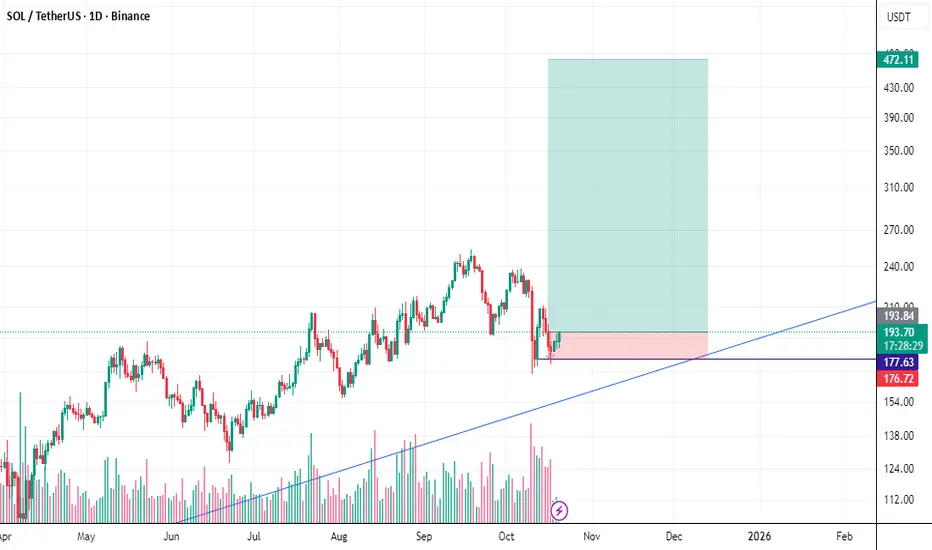
SOLANA make double from Here....?Consensus Outlook: Most forecasts point to $250–$400 by end-2025 (a 33–112% gain), with 2026 extending to $300–$500 (60–165% from now). This suggests a double is realistic by mid-2026, especially if Bitcoin's post-halving rally spills over. Bullish catalysts include:
ETF Approvals: Odds near 100% for spot SOL ETFs by late 2025, per analysts—could spark a 50–80% surge to $290–$345 on news.
Technical Setup: SOL is forming a multi-year ascending triangle and range breakout around $160–$200. A close above $230–$260 could target $290–$520 quickly. Recent double-bottom at $172 signals rebound potential to $220+.
Ecosystem Strength: DEX volumes surpassing Ethereum, plus DeFi/NFT growth, position SOL for outperformance.
Bearish Risks: If it fails to hold $180, a drop to $140–$160 is possible amid broader market corrections or network outages. Sentiment is mixed (Fear & Greed at 29), with only 40% green days recentl
SOLUSDT is for sell side in short termSOLUSDT if closed below 185.35 then only we can plan for sell side up to 182.35. We can book some qty at 184.35 as TGT 1 . After hitting TGT 1 we can trail SL to 185 and wait for 182.35

Divergence Secrets Leverage and Risk Management
Options offer leverage, meaning traders control large positions with relatively small investments. A small premium can yield significant gains if the market moves favorably. However, leverage also magnifies losses if predictions fail. Effective risk management—using stop-losses, diversification, and position sizing—is crucial. Many traders use options not just for profit but for hedging—protecting portfolios from adverse movements. Balancing leverage with caution separates professional option traders from speculative risk-takers in the volatile derivatives market.

Solana Ready for Bullish ContinuationSolana demonstrates a constructive market posture with evidence of renewed accumulation following its recent corrective phase.Price activity indicates that buying momentum is gradually strengthening as liquidity continues to shift from weak hands into strategic positioning.The market structure shows improving stability,with compression patterns hinting at an impending expansion cycle.Sustained absorption near recent lows underscores growing institutional participation,reinforcing the probability of continued upward repricing.Trading volume remains consistent,reflecting controlled demand rather than speculative inflow.The overall market tone supports a constructive bias,with expectations aligning toward a progressive recovery phase and potential continuation of the broader bullish trajectory.

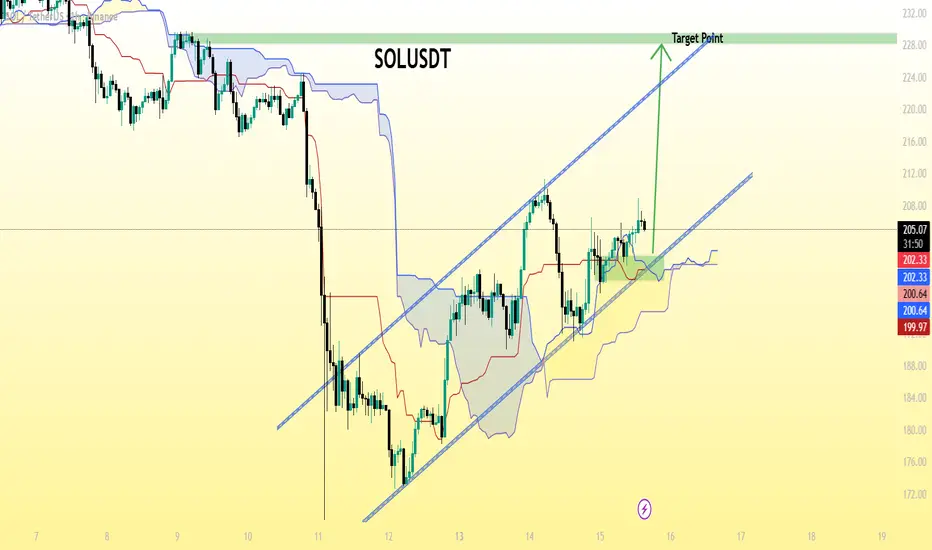
SOL/USDT chart pattern..SOL/USDT
The current price is around 205.5 USDT.
There’s a clear ascending trendline (blue line).
A breakout setup is indicated, with a marked “Target Point” near the top of the chart.
That target level appears to be around 230 USDT — the horizontal green line my labeled “Target Point.”
✅ Summary:
Current price: ≈ 205.5
Target price: ≈ 230 USDT
Upside potential: about +12% from the current level.
⚠ Note: Watch for support around 200–202 USDT (the Ichimoku cloud zone). If SOL holds that level, continuation toward 230 looks likely. A breakdown below the trendline could invalidate the move.
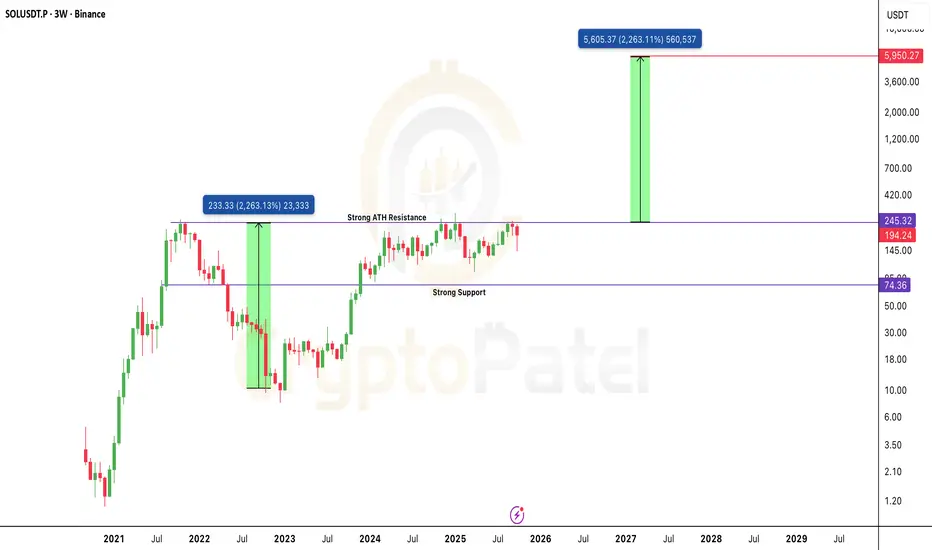
The Chart That Could Send $SOL to $6,000: Cup & Handle on 3W TFThe Chart That Could Send CRYPTOCAP:SOL to $6,000: Cup & Handle on 3W Timeframe
Solana is shaping one of the cleanest Cup & Handle patterns on the 3-Week chart, a formation that often signals the start of a massive long-term rally.
Technical Structure
🔹 Cup formed: $260 → $8 → back to $245 — a perfect rounded recovery base.
🔹 Handle forming: Price consolidating between $140–$245, building pressure before breakout.
🔹 Breakout trigger: Clean close above $245 (ATH zone) will confirm the move.
🔹 Targets:
– First target: $480–$500
– Extended target: $2,000–$6,000 if momentum mirrors the last 2200% run.
🔹 Major Support: $74–$90 zone.
What this really means: Solana is quietly preparing for its next macro expansion phase.
A confirmed breakout above ATH could kickstart one of the strongest alt rallies of this cycle.
Bias: Bullish on breakout confirmation
Timeframe: 3W / Long-Term Swing Setup
Plan: Watch $245 zone closely, breakout with volume = game on.
Note: NFA & DYOR
Part 1 Candle Stick PatternKey Terminology in Options
Before diving deeper, understanding these basic terms is essential:
Strike Price: The price at which the option can be exercised.
Premium: The price paid by the buyer to purchase the option.
Expiry Date: The date on which the option contract ends.
In the Money (ITM): When exercising the option gives a profit (e.g., a call option when the stock price is above the strike price).
Out of the Money (OTM): When exercising the option gives a loss (e.g., a call option when the stock price is below the strike price).
At the Money (ATM): When the stock price and strike price are almost the same.
Underlying Asset: The financial instrument (like a stock, index, or currency) on which the option is based.

SOL | Network Strength Meets Market MomentumSolana (SOLUSDT) continues to show resilience as both technical and fundamental factors align for potential upside. On the technical side, the market has completed a controlled correction phase, suggesting liquidity buildup below recent lows. The structure remains bullish, with increasing volume and price stability hinting that buyers are regaining control. Fundamentally, Solana’s network growth and strong developer activity have reinforced investor confidence, supported by rising on-chain activity and ecosystem expansion in DeFi and NFTs. This combination of solid fundamentals and technical structure indicates the possibility of another bullish leg, with SOL positioning itself for a gradual climb toward the $240–$250 range in the near term.

Part 1 Intraday Master ClassIntroduction to Option Trading
Option trading is one of the most fascinating and flexible areas in the financial markets. Unlike traditional stock trading — where you buy or sell shares directly — options give you the right but not the obligation to buy or sell an underlying asset (like a stock, index, or commodity) at a fixed price within a specified time.
Think of options as financial contracts that allow traders and investors to speculate on price movements, hedge existing positions, or earn income — all without actually owning the underlying asset.
For example, if you believe Reliance Industries’ stock will go up, instead of buying the shares directly, you can buy a call option — a cheaper contract that benefits if the stock price rises. Conversely, if you expect a fall, you can buy a put option.
The main advantage? Leverage. You control a large position with a relatively small investment. But this also means risk — because options lose value as time passes or if prices move against your expectation.

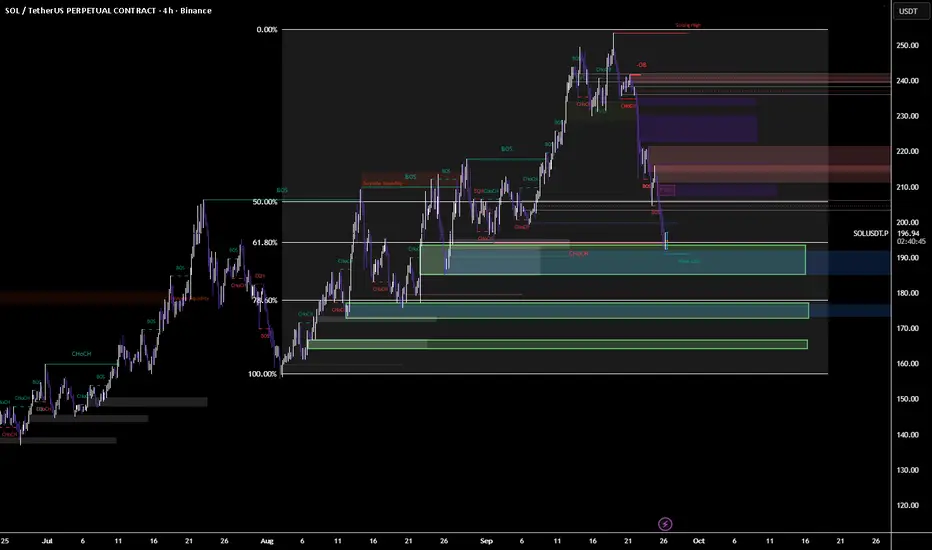
SOL Ready TO Ignite from Demand - Eyeing $240 Supply “SOL Ready to Ignite from Demand – Eyeing $240 Supply”
📌 Description:
Solana swept liquidity into the $192–195 demand zone and is showing signs of strength. As long as $185 holds, bulls may drive price into the $210–240 supply zones. First target sits at $210 (FVG close), with higher objectives at $225 and $240. If demand fails, watch for a rejection short from $210.
Long Setup (Buy Idea)
Entry Zone: $192 – $195 (current demand + weak low + 61.8 retracement support)
Stop Loss (SL): $185 (below demand zone + liquidity sweep area)
Take Profit (TP):
TP1: $210 (FVG imbalance zone)
TP2: $225 (OB resistance zone)
TP3: $240 (supply zone / strong high)
⚖️ Risk–Reward: Around 1:3 to 1:4 if TP2 or TP3 hits.
🔴 Short Setup (Sell Idea, only if rejection occurs)
Entry Zone: $210 – $215 (FVG imbalance / supply)
Stop Loss (SL): $222 (above imbalance zone)
Take Profit (TP):
TP1: $195 (back to current demand)
TP2: $180 (major demand below)
⚖️ Risk–Reward: Around 1:2 to 1:3.
📌 Bias: Currently, price tapped demand and bounced — so long setup looks stronger unless $185 breaks.
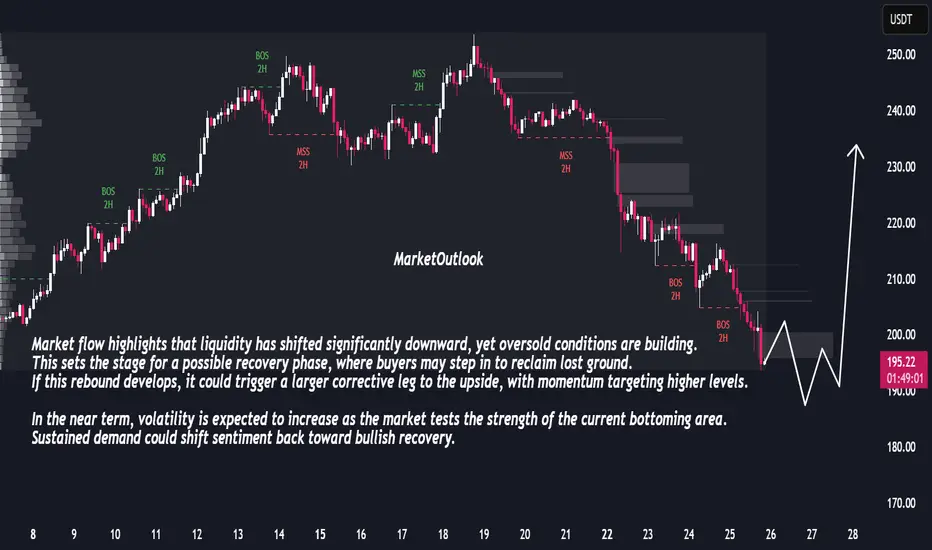
Bullish Reversal Ahead: Market Prepares for Sharp RecoveryThe market has been under consistent selling pressure, with a clear sequence of bearish breaks in structure confirming downside control. Price has now entered a zone where momentum shows signs of slowing, suggesting potential exhaustion in the recent decline. The sharp extension lower indicates that sellers may be reaching a short-term limit, creating conditions for a corrective rebound.
Market flow highlights that liquidity has shifted significantly downward, yet oversold conditions are building. This sets the stage for a possible recovery phase, where buyers may step in to reclaim lost ground. If this rebound develops, it could trigger a larger corrective leg to the upside, with momentum targeting higher levels.
In the near term, volatility is expected to increase as the market tests the strength of the current bottoming area. Sustained demand could shift sentiment back toward bullish recovery.
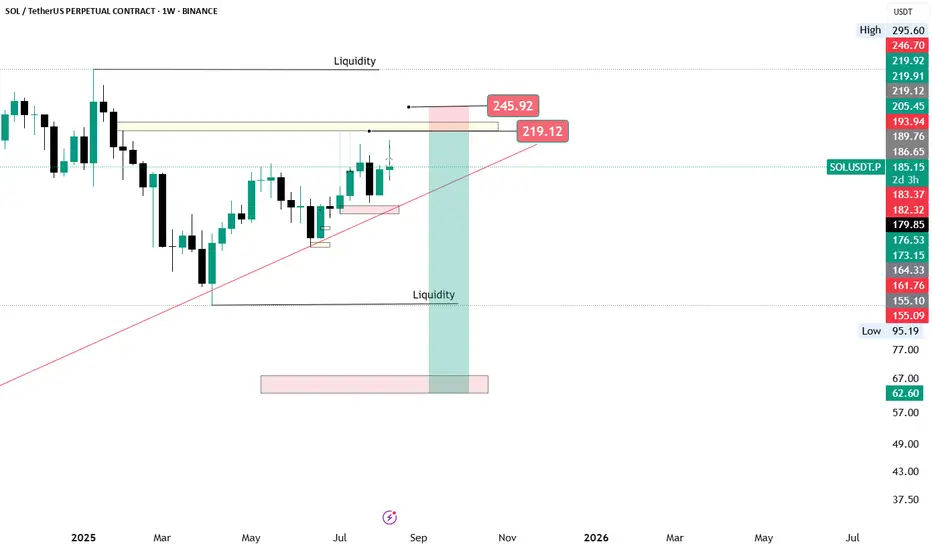
Solana Price Forecast | SOLUSDT Market OutlookSOLUSDT has completed a strong upward cycle and is now unwinding through a structured retracement. This phase is not showing disorderly selling but rather a controlled reset, where liquidity is being cleared to prepare for the next expansion.
The chart reflects a market that is cycling through accumulation, breakout, and pullback phases with consistency. Current downside movement is shaping a foundation zone that could serve as the springboard for renewed upward momentum.
Overall, the asset is displaying a constructive trajectory: corrections are functioning as fuel rather than weakness, pointing toward continuation of its broader growth path once this reset stabilizes.

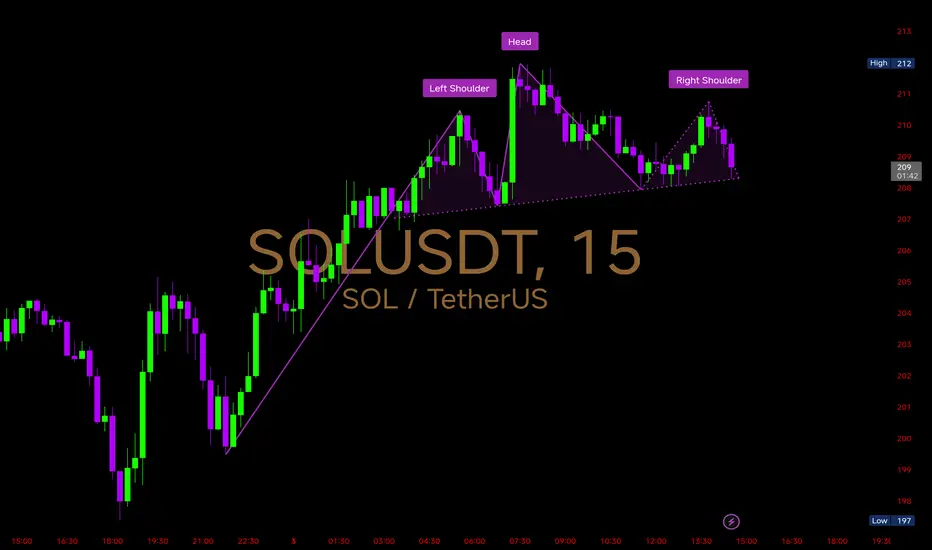
$SOL 15mins Chart Analysis CRYPTOCAP:SOL 15mins Chart Analysis
A Head & Shoulders pattern has formed with the left shoulder near 210, head at 212, and right shoulder around 211.
Key Technical Levels
Neckline Support: Around 208 – if this breaks decisively, we could see stronger bearish momentum.
Immediate Resistance: 210–212 (right shoulder + recent high). A breakout above invalidates the bearish pattern.
Downside Targets: If the neckline fails, price could test 205 → 202 → 197 support zones.
Bullish Case: Sustaining above 212 would flip the structure invalid, pushing price back into 215–220 zone.
Right now, #SOLANA is at a critical point – holding above the neckline keeps bulls alive, but losing it confirms a bearish breakdown.
Solana BUY nowSonala so good to buy
Fibonaci indicator
Top 10 coin crypto market cap has been sizeway a long time. And now run to pamp
Buy and wating 281$ to sell.
Good luck all!

Sol 1 Pending Market Crash so wait for thisSol 1 Pending Market Crash so wait for this
Sol 1 Pending Market Crash so wait for thisSol 1 Pending Market Crash so wait for thisSol 1 Pending Market Crash so wait for thisSol 1 Pending Market Crash so wait for thisSol 1 Pending Market Crash so wait for thisSol 1 Pending Market Crash so wait for thisSol 1 Pending Market Crash so wait for this