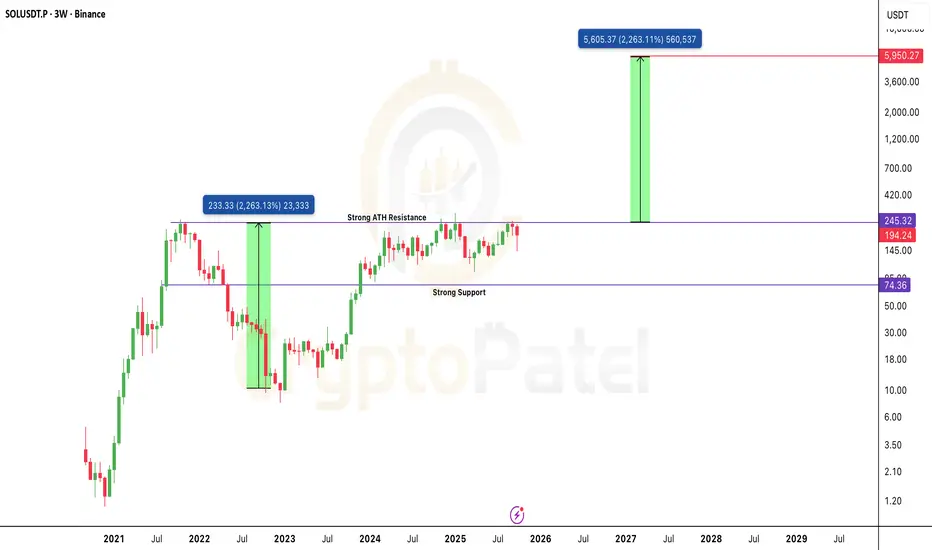
The Chart That Could Send $SOL to $6,000: Cup & Handle on 3W TFThe Chart That Could Send CRYPTOCAP:SOL to $6,000: Cup & Handle on 3W Timeframe
Solana is shaping one of the cleanest Cup & Handle patterns on the 3-Week chart, a formation that often signals the start of a massive long-term rally.
Technical Structure
🔹 Cup formed: $260 → $8 → back to $245 — a p
SOL | Network Strength Meets Market MomentumSolana (SOLUSDT) continues to show resilience as both technical and fundamental factors align for potential upside. On the technical side, the market has completed a controlled correction phase, suggesting liquidity buildup below recent lows. The structure remains bullish, with increasing volume and

Part 1 Intraday Master ClassIntroduction to Option Trading
Option trading is one of the most fascinating and flexible areas in the financial markets. Unlike traditional stock trading — where you buy or sell shares directly — options give you the right but not the obligation to buy or sell an underlying asset (like a stock, in

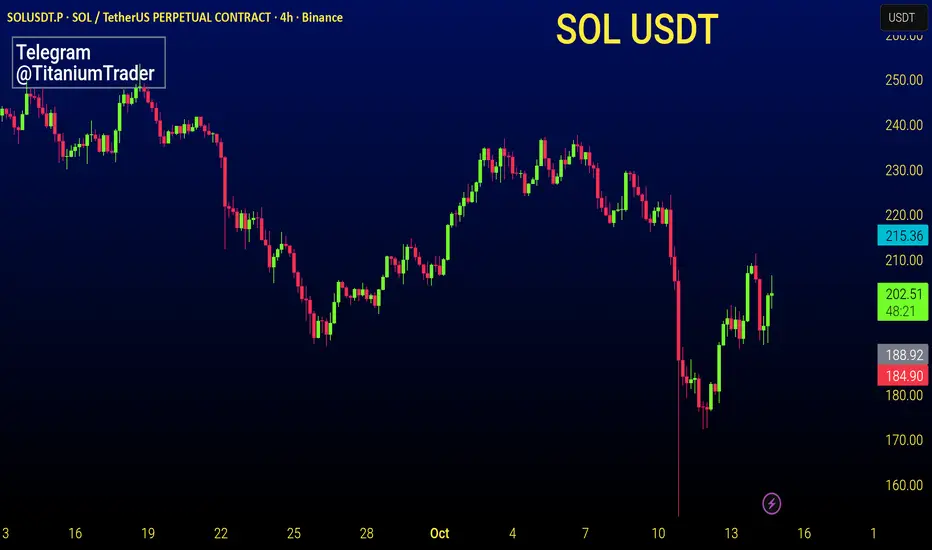
SOLANA IS GOING TO 300!✅SOL 4-Hour Timeframe: Short-Term Price Dynamics
⚜️Solana (SOL) is currently trading around 202.49 USDT, showing consolidation after recent volatility. Over the past hour, price has fluctuated within a narrow range of 201.43 to 203.86 USDT, indicating short-term equilibrium between buyers and selle
Part 1 Candle Stick PatternKey Terminology in Options
Before diving deeper, understanding these basic terms is essential:
Strike Price: The price at which the option can be exercised.
Premium: The price paid by the buyer to purchase the option.
Expiry Date: The date on which the option contract ends.
In the Money (ITM):

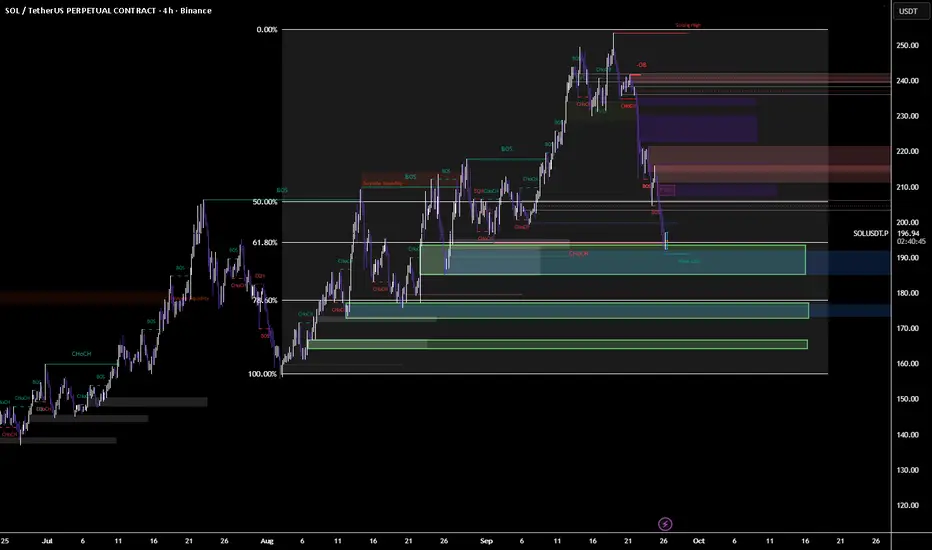
SOL Ready TO Ignite from Demand - Eyeing $240 Supply “SOL Ready to Ignite from Demand – Eyeing $240 Supply”
📌 Description:
Solana swept liquidity into the $192–195 demand zone and is showing signs of strength. As long as $185 holds, bulls may drive price into the $210–240 supply zones. First target sits at $210 (FVG close), with higher objectives at
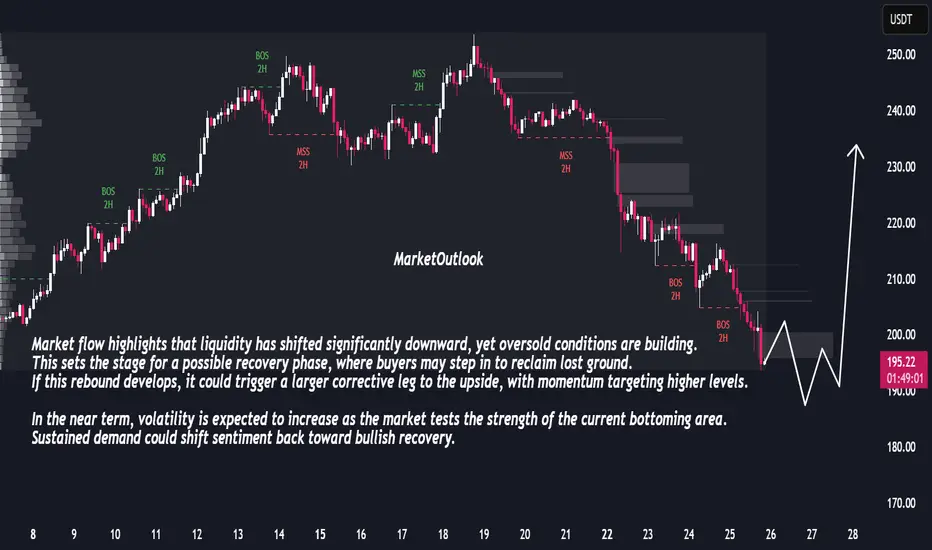
Bullish Reversal Ahead: Market Prepares for Sharp RecoveryThe market has been under consistent selling pressure, with a clear sequence of bearish breaks in structure confirming downside control. Price has now entered a zone where momentum shows signs of slowing, suggesting potential exhaustion in the recent decline. The sharp extension lower indicates that
Solana Price Forecast | SOLUSDT Market OutlookSOLUSDT has completed a strong upward cycle and is now unwinding through a structured retracement. This phase is not showing disorderly selling but rather a controlled reset, where liquidity is being cleared to prepare for the next expansion.
The chart reflects a market that is cycling through accu

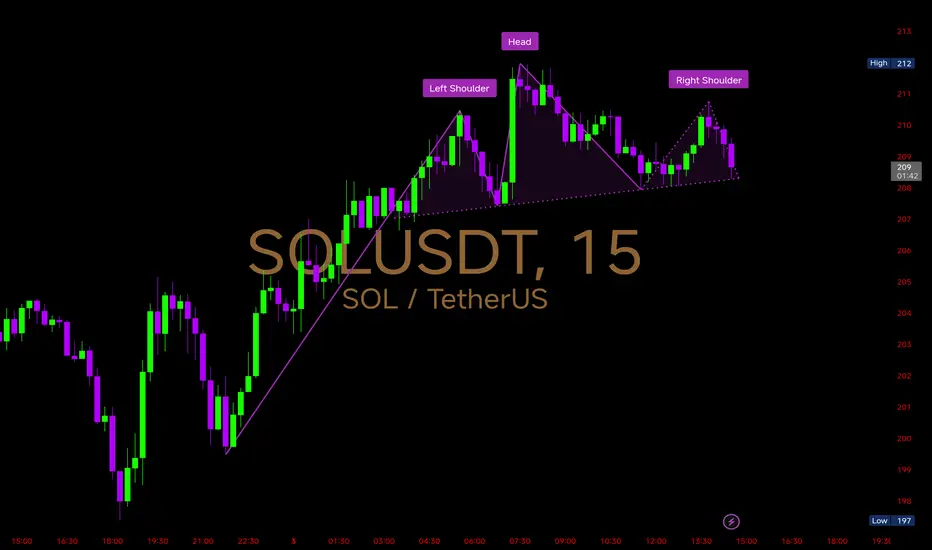
$SOL 15mins Chart Analysis CRYPTOCAP:SOL 15mins Chart Analysis
A Head & Shoulders pattern has formed with the left shoulder near 210, head at 212, and right shoulder around 211.
Key Technical Levels
Neckline Support: Around 208 – if this breaks decisively, we could see stronger bearish momentum.
Immediate Resistance: 2
Solana BUY nowSonala so good to buy
Fibonaci indicator
Top 10 coin crypto market cap has been sizeway a long time. And now run to pamp
Buy and wating 281$ to sell.
Good luck all!

See all ideas
Displays a symbol's price movements over previous years to identify recurring trends.