SPX – Wave 5 in Progress | Updated Analysis - 06-Dec-2025Continuation of Previous Elliott Wave Outlook (Link Below)
Chart Update Date: 06 Dec 2025
📍 Old Analysis Reference (28 Aug 2025)
In my previous analysis shared on 28 August 2025, I highlighted that the SPX was completing Wave 4 and was expected to resume the upward journey into Wave 5 within the
S&P 500 Index
No trades
About S&P 500 Index
Standard and Poor's 500 Index is a capitalization-weighted stock market index measuring the performance of 500 large publicly traded companies in the United States. This index covers a wide range of industries, including technology, healthcare, energy, and finance. It serves as a benchmark for the overall health of the U.S. stock market, as well as a reflection of the country's economic strength.
Substantial gains in the S&P 500 are often interpreted as positive signals for the economy, while losses can be seen as indicators of potential trouble. Investors use this index as a barometer for their own portfolios and to assess the performance of individual stocks. The S&P 500 index plays a vital role in the financial world and is closely watched by analysts and policymakers.
Substantial gains in the S&P 500 are often interpreted as positive signals for the economy, while losses can be seen as indicators of potential trouble. Investors use this index as a barometer for their own portfolios and to assess the performance of individual stocks. The S&P 500 index plays a vital role in the financial world and is closely watched by analysts and policymakers.
Related indices

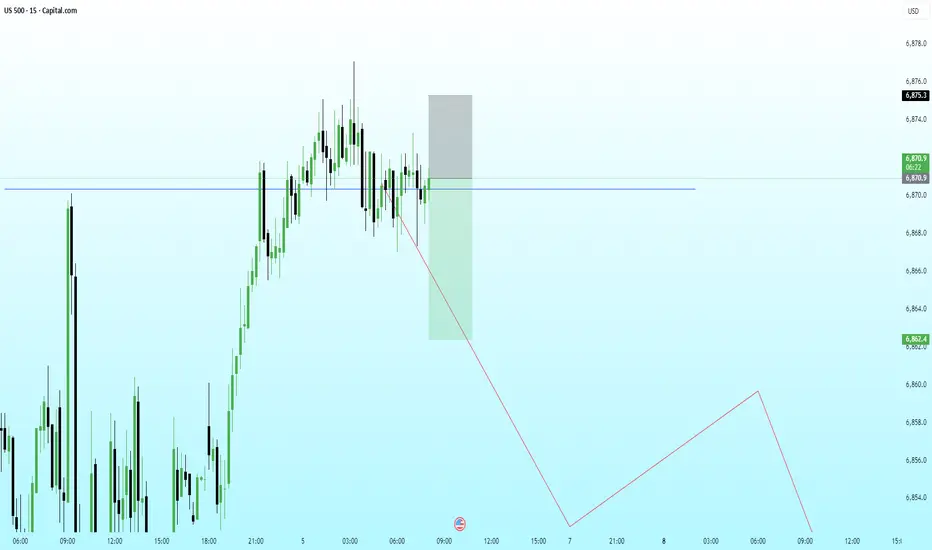
US500 – Clean Retest of Broken Structure With Bearish ContinuatiPrice has retested the broken structure level (blue line) and is now reacting inside a premium zone, suggesting sellers may re-enter the market from this region. The consolidation and repeated rejections indicate absorption of buy-side pressure.
With HTF context still pointing toward a deeper corre
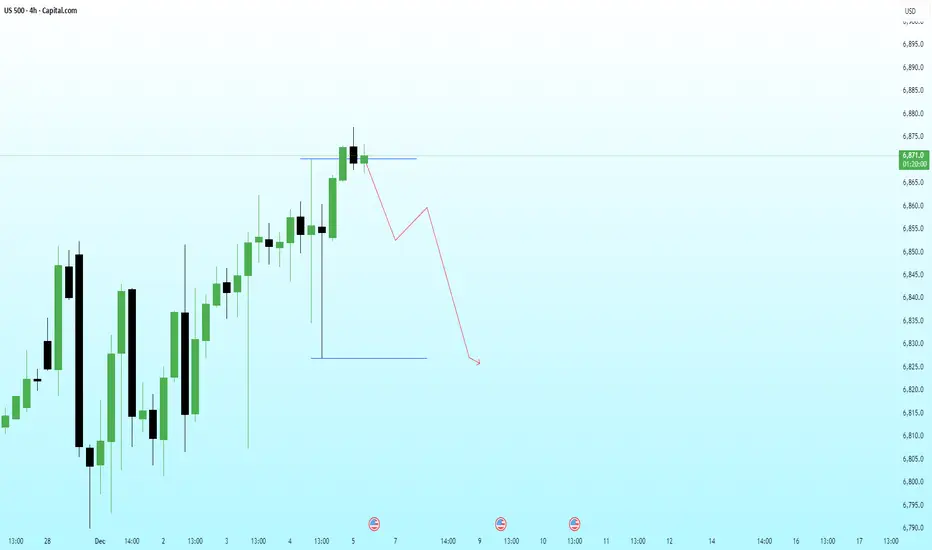
US500 – Liquidity Sweep at the Highs With Bearish Continuation PPrice has swept the immediate buy-side liquidity sitting above the recent high and is already showing signs of exhaustion. The reaction suggests a possible distribution phase forming near the top, aligning with the broader HTF narrative for a corrective leg.
If price fails to reclaim the swept high
US 500 – Next Moves on a Knife EdgeIt’s often said that fear and greed underpin moves across financial markets and that was certainly the case for US indices at the end of last week.
Focusing on the US 500, prices first reacted positively to a Federal Reserve interest rate cut which was accompanied by a more dovish outlook than man

Part 10 Trade Like Institutions Role of Option Greeks
Option Greeks help traders measure risk:
Delta: Sensitivity to price movement.
Gamma: Rate of change of delta.
Theta: Impact of time decay.
Vega: Sensitivity to volatility.
Rho: Sensitivity to interest rates.
Understanding Greeks enables better strategy selection and pos

Earnings Season Trading – A Complete Guide1. What Is Earnings Season?
Earnings season is the period when companies release their quarterly financial performance, including:
Revenue (sales)
Net profit or loss
Earnings per share (EPS)
Operating margins
Management guidance and outlook
In India, earnings seasons usually begin shortly aft

Part 6 Learn Institutional Trading Buyers vs. Sellers
Option Buyers
Pay premium.
Limited risk (premium only).
Unlimited reward potential.
Low probability of profit (because time decay erodes premium).
Option Sellers (Writers)
Receive premium.
Limited profit (premium only).
Can face huge losses.
High probability of profit (be

SPX Short , Possible Trend ChangeBy the looks of it we might have got a top on SPX.
We got an ATH (Top#1) mentioned as Top #1 , followed by 2 additional tops Top#2 and Top#3.
Following the ATH each Top was a Lower High compared to the previous one showing difficulties breaking above it.
After each top we got a correction the botto

Super Cycle Outlook: The Big Picture in Financial MarketHistorical Perspective of Super Cycles
Historically, super cycles have often been observed in commodities, stock markets, and global trade patterns. For instance:
Commodity Super Cycles: The industrialization of the United States and Europe during the 19th century created the first global commodit
6000 is good for trendSP:SPX
6000 is good for trend.
10% Retracement also trap pattern repetition actual down trend in previous trend is around 20% but any assume 10% for good economic via trump 😅
always do your own research
i am not financial advisor.
please feel free to ask any questions

See all ideas
Summarizing what the indicators are suggesting.
Oscillators
Neutral
SellBuy
Strong sellStrong buy
Strong sellSellNeutralBuyStrong buy
Oscillators
Neutral
SellBuy
Strong sellStrong buy
Strong sellSellNeutralBuyStrong buy
Summary
Neutral
SellBuy
Strong sellStrong buy
Strong sellSellNeutralBuyStrong buy
Summary
Neutral
SellBuy
Strong sellStrong buy
Strong sellSellNeutralBuyStrong buy
Summary
Neutral
SellBuy
Strong sellStrong buy
Strong sellSellNeutralBuyStrong buy
Moving Averages
Neutral
SellBuy
Strong sellStrong buy
Strong sellSellNeutralBuyStrong buy
Moving Averages
Neutral
SellBuy
Strong sellStrong buy
Strong sellSellNeutralBuyStrong buy
Displays a symbol's value movements over previous years to identify recurring trends.
Frequently Asked Questions
The current value of S&P 500 Index is 6,816.52 USD — it has fallen by −1.07% in the past 24 hours. Track the index more closely on the S&P 500 Index chart.
S&P 500 Index reached its highest quote on Oct 29, 2025 — 6,920.34 USD. See more data on the S&P 500 Index chart.
The lowest ever quote of S&P 500 Index is 2.73 USD. It was reached on Jun 1, 1877. See more data on the S&P 500 Index chart.
S&P 500 Index value has decreased by −0.57% in the past week, since last month it has shown a −0.59% decrease, and over the year it's increased by 12.33%. Keep track of all changes on the S&P 500 Index chart.
The top companies of S&P 500 Index are NASDAQ:NVDA, NASDAQ:AAPL, and NASDAQ:GOOGL — they can boast market cap of 4.28 T USD, 4.05 T USD, and 3.73 T USD accordingly.
The highest-priced instruments on S&P 500 Index are NYSE:NVR, NASDAQ:BKNG, and NYSE:AZO — they'll cost you 7,632.35 USD, 5,457.70 USD, and 3,488.71 USD accordingly.
The champion of S&P 500 Index is NASDAQ:SNDK — it's gained 475.78% over the year.
The weakest component of S&P 500 Index is NASDAQ:TTD — it's lost −72.72% over the year.
S&P 500 Index is just a number that lets you track performance of the instruments comprising the index, so you can't invest in it directly. But you can buy S&P 500 Index futures or funds or invest in its components.
The S&P 500 Index is comprised of 503 instruments including NASDAQ:NVDA, NASDAQ:AAPL, NASDAQ:GOOGL and others. See the full list of S&P 500 Index components to find more opportunities.