Part 1 Intraday Institutional Trading Strike Price: The pre-agreed price at which the stock can be bought or sold.
Expiration Date: The date the contract expires.
Premium: The price paid to purchase the option.
Leverage: One option contract typically controls 100 shares of stock. This allows for significant gains (and losses) with a
S&P 500 Index - Standard & Poors 500 (SPX)
No trades

Part 1 Institutionaal Intraday Trading The Infrastructure: Speed and Connectivity
Institutional traders don’t use standard web-based brokers. They operate on direct market access (DMA) systems, connecting directly to stock exchange servers.
Co-location: Many firms pay premium fees to house their servers in the same data center as the ex

The Modern Economic SystemImportance of Policymakers, Investors, and Traders
The global economic and financial system functions like a living organism, driven by decision-makers operating at different levels. Among the most influential actors are policymakers, investors, and traders. Each plays a distinct yet interconnected

S&P 500 For Long Side viewS& P 500, 4 hrs time frame The Triangle ABCDE formation after A motive wave completion so next motive wave can be anticipate ....................

Open Interest (OI) Analysis for Futures & Options TradersOpen Interest Analysis for Futures & Options Traders
Open Interest (OI) is one of the most powerful yet misunderstood tools in the derivatives market. While price and volume tell traders what is happening, open interest helps explain why it is happening and who is likely behind the move. For future

PSU Banks Rising: Understanding the Structural Turnaround1. Resolution of the NPA Crisis
The most important reason behind the rise of PSU banks is the significant improvement in asset quality. Between 2015 and 2019, PSU banks were hit hard by a surge in Non-Performing Assets (NPAs), mainly from stressed corporate loans in sectors such as infrastructure,
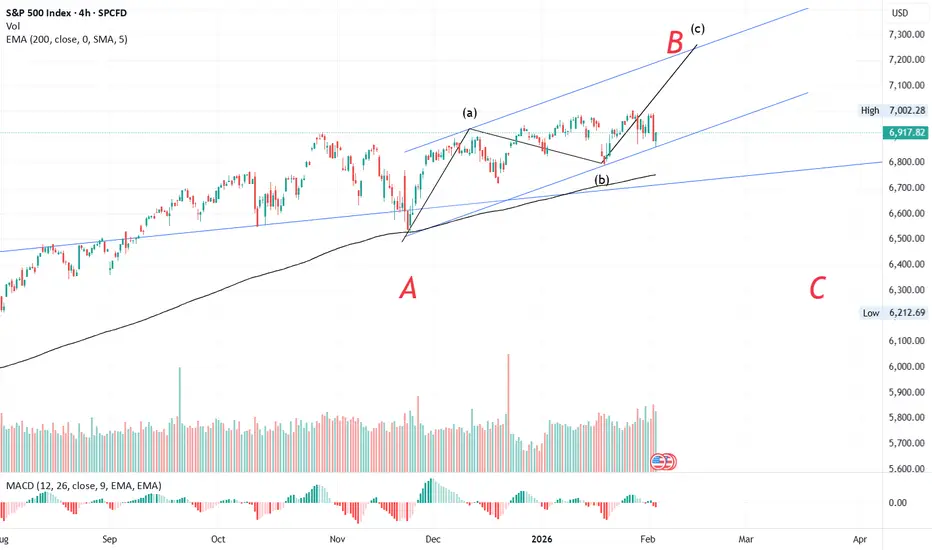
#S&P📊 S&P 500 Wave Analysis Update
The S&P began its corrective phase on 29 Oct 2025, forming its A wave by 21 Nov 2025. From there, the index rallied into its B wave, retracing more than 61.8%, which signals the development of a flat correction.
Breaking down the B wave:
- The a wave formed on
Exotic Option Structured Products1. Basic Structure
A structured product generally consists of two main components:
Fixed-income component (bond or note)
This portion provides capital protection (partial or full) at maturity, depending on the structure.
Derivative component (exotic option)
This generates additional returns linke

Bond Yield Volatility & Fixed-Income Trading StrategiesPart I: Bond Yield Volatility
1. What Is Bond Yield Volatility?
Bond yield volatility refers to fluctuations in interest rates (yields) over time. Since bond prices move inversely to yields, volatility in yields translates into price volatility.
When yields rise:
Bond prices fall
Longer-duration

Index Trading: (S&P 500, NASDAQ, DAX, Nikkei, Nifty)1. What Is a Stock Market Index?
A stock market index measures the performance of a selected group of stocks that represent a particular market or sector. Each index has its own methodology for selecting and weighting companies.
Indexes serve three main purposes:
Benchmarking portfolio performanc

See all ideas
Displays a symbol's value movements over previous years to identify recurring trends.
Frequently Asked Questions
S&P 500 Index - Standard & Poors 500 (SPX) reached its highest quote on Jan 28, 2026 — 7,017.4 USD. See more data on the S&P 500 Index - Standard & Poors 500 (SPX) chart.
The lowest ever quote of S&P 500 Index - Standard & Poors 500 (SPX) is 1,384.9 USD. It was reached on Nov 28, 2012. See more data on the S&P 500 Index - Standard & Poors 500 (SPX) chart.
S&P 500 Index - Standard & Poors 500 (SPX) is just a number that lets you track performance of the instruments comprising the index, so you can't invest in it directly. But you can buy S&P 500 Index - Standard & Poors 500 (SPX) futures or funds or invest in its components.