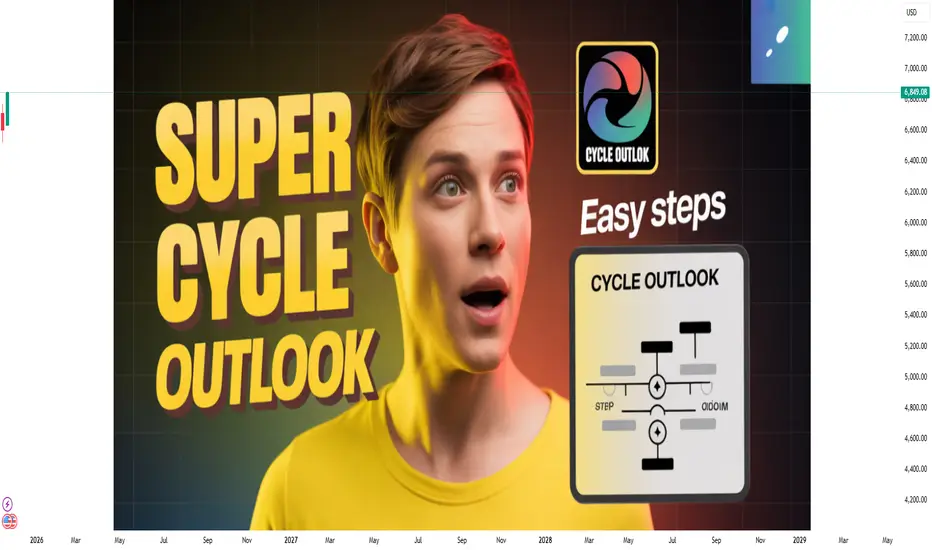
Super Cycle Outlook: The Big Picture in Financial MarketHistorical Perspective of Super Cycles
Historically, super cycles have often been observed in commodities, stock markets, and global trade patterns. For instance:
Commodity Super Cycles: The industrialization of the United States and Europe during the 19th century created the first global commodit
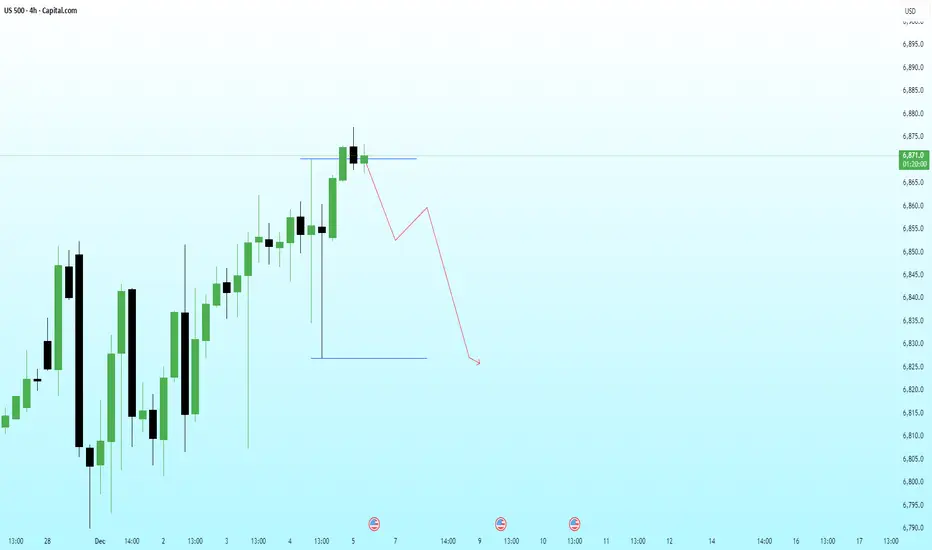
US500 – Clean Retest of Broken Structure With Bearish ContinuatiPrice has retested the broken structure level (blue line) and is now reacting inside a premium zone, suggesting sellers may re-enter the market from this region. The consolidation and repeated rejections indicate absorption of buy-side pressure.
With HTF context still pointing toward a deeper corre
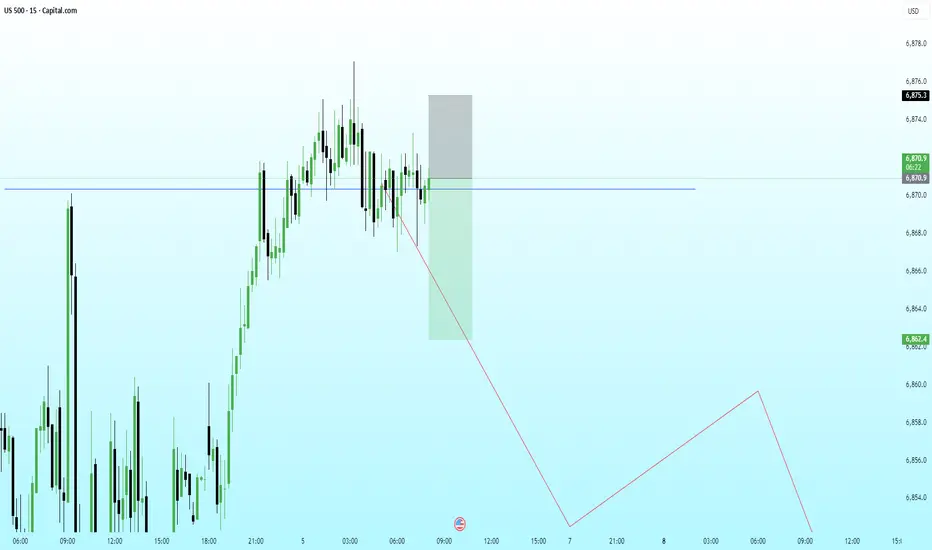
US500 – Liquidity Sweep at the Highs With Bearish Continuation PPrice has swept the immediate buy-side liquidity sitting above the recent high and is already showing signs of exhaustion. The reaction suggests a possible distribution phase forming near the top, aligning with the broader HTF narrative for a corrective leg.
If price fails to reclaim the swept high
Part 9 Trading Master Class With Experts What Are Options?
Options are derivative contracts, meaning their value is derived from an underlying asset—most commonly stocks, indices (like Nifty or Bank Nifty), commodities, or currencies.
Every option has two key components:
Strike Price – The agreed price at which the trader can buy or sel

SPX – Wave 5 in Progress | Updated Analysis - 06-Dec-2025Continuation of Previous Elliott Wave Outlook (Link Below)
Chart Update Date: 06 Dec 2025
📍 Old Analysis Reference (28 Aug 2025)
In my previous analysis shared on 28 August 2025, I highlighted that the SPX was completing Wave 4 and was expected to resume the upward journey into Wave 5 within the

SPX Short , Possible Trend ChangeBy the looks of it we might have got a top on SPX.
We got an ATH (Top#1) mentioned as Top #1 , followed by 2 additional tops Top#2 and Top#3.
Following the ATH each Top was a Lower High compared to the previous one showing difficulties breaking above it.
After each top we got a correction the botto

6000 is good for trendSP:SPX
6000 is good for trend.
10% Retracement also trap pattern repetition actual down trend in previous trend is around 20% but any assume 10% for good economic via trump 😅
always do your own research
i am not financial advisor.
please feel free to ask any questions

Daily Macro, Market Mood Swings, & the Stories Behind the NoiseNvidia: The Market’s Emergency Generator
Nvidia didn’t just beat expectations—it blew past them like a power surge through an already overloaded grid. The post-market 5% jump wasn’t enough to revisit October highs, but it was enough to jolt the entire AI complex back to life. More importantly, it s

Daily Macro, Market Mood Swings, & the Stories Behind the NoiseThe Background Buzz
What’s the market mood?
Think of a machine that’s been running too long, too hot, too fast — now humming with that faint, hollow “something’s-off” vibration. The AI complex, once the unstoppable locomotive of 2025, suddenly sounds like someone poured sand into the gearbox. Not a

Divergence SecretsRisks in Option Trading
1. Option Buying Risks
Premium becomes zero if market doesn’t move
Time decay erodes value daily
Volatility crush hurts premiums
Beginners often lose due to poor timing.
2. Option Selling Risks
Unlimited losses if market breaks range
Requires strict discipline & risk m

See all ideas
Displays a symbol's price movements over previous years to identify recurring trends.
Frequently Asked Questions
S&P 500 Index - Standard & Poors 500 (SPX) reached its highest quote on Oct 30, 2025 — 6,928.7 USD. See more data on the S&P 500 Index - Standard & Poors 500 (SPX) chart.
The lowest ever quote of S&P 500 Index - Standard & Poors 500 (SPX) is 1,384.9 USD. It was reached on Nov 28, 2012. See more data on the S&P 500 Index - Standard & Poors 500 (SPX) chart.
S&P 500 Index - Standard & Poors 500 (SPX) is just a number that lets you track performance of the instruments comprising the index, so you can't invest in it directly. But you can buy S&P 500 Index - Standard & Poors 500 (SPX) futures or funds or invest in its components.