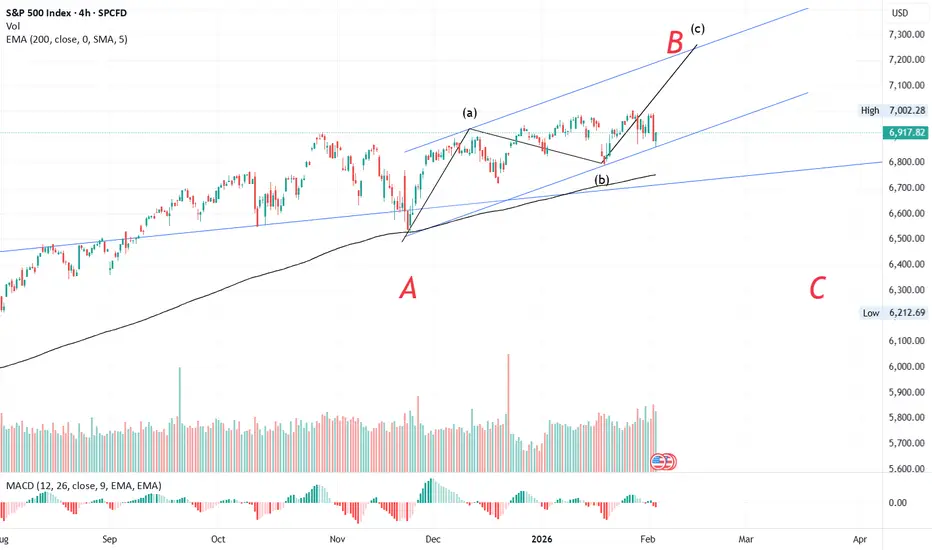
#S&P📊 S&P 500 Wave Analysis Update
The S&P began its corrective phase on 29 Oct 2025, forming its A wave by 21 Nov 2025. From there, the index rallied into its B wave, retracing more than 61.8%, which signals the development of a flat correction.
Breaking down the B wave:
- The a wave formed on 5 Dec 2025.
- The subsequent b wave retraced less than 61.8%, indicating a zig-zag structure.
- This sets the stage for the c wave, which has the potential to extend towards the 7200–7300 zone.
S&P 500 Index - Standard & Poors 500 (SPX)
No trades
What traders are saying
Part 5 Best Trading Strategies Simple Example to Understand
Scenario
Nifty at 21500
You expect it to go to 21650.
Call Option Buy
Buy 21500 CE
If Nifty moves up → premium increases → profit
If Nifty falls → premium collapses → loss
Put Option Buy
Not useful in this scenario
Option Seller’s View
If seller expects market to remain sideways:
Seller sells 21600 CE
Seller sells 21400 PE
Both sides decay → seller profits

Part 5 Advance Option Trading Option Seller (Short Option)
Advantages:
Benefits from time decay
Higher probability of profit
Works well in sideways markets
Disadvantages:
Unlimited or very high risk
Requires margin
Risk increases sharply during volatility spikes

S&P 500 For Long Side viewS& P 500, 4 hrs time frame The Triangle ABCDE formation after A motive wave completion so next motive wave can be anticipate ....................

Momentum Patterns in Cryptocurrency MarketsUnderstanding Momentum in Crypto Markets
Momentum refers to the speed and strength of price movement in a particular direction. In crypto markets, momentum is driven by a combination of factors such as liquidity inflows, news events, social media hype, whale activity, derivatives positioning, and macroeconomic sentiment.
Unlike equities, where institutional flows dominate, crypto momentum often begins with retail enthusiasm and is amplified by leverage in futures markets. This creates exaggerated price movements, making momentum patterns more pronounced and more frequent.
Why Momentum Is Stronger in Cryptocurrencies
Cryptocurrency markets exhibit stronger momentum patterns than most traditional assets due to:
High Volatility – Daily moves of 5–15% are common.
Leverage Availability – Futures allow 10x–100x leverage, accelerating trends.
24/7 Trading – No closing bell means trends evolve continuously.
Narrative-Driven Moves – News, tweets, and narratives can trigger instant momentum.
Lower Liquidity in Altcoins – Small capital inflows can cause explosive price action.
These characteristics make momentum trading especially attractive—but also risky.
Major Momentum Patterns in Cryptocurrency Markets
1. Breakout Momentum Pattern
Breakouts occur when price moves beyond a well-defined resistance or support zone with increased volume.
Crypto-specific traits:
Breakouts often happen during low-liquidity periods.
Fake breakouts are common due to stop-hunting.
Volume confirmation is crucial.
Strong breakout signals include:
Expansion in volume
Large candle bodies
Open Interest increasing with price
Breakout momentum works best in high-liquidity coins like Bitcoin, Ethereum, and top-tier altcoins.
2. Trend Continuation Momentum
Once a trend is established, crypto markets often show extended continuation phases.
Common continuation patterns include:
Bull flags
Bear flags
Ascending or descending channels
Consolidation above key moving averages
In strong bull markets, cryptocurrencies can remain overbought for extended periods, making traditional indicators less effective. Traders who wait for “cheap” prices often miss the move entirely.
3. Parabolic Momentum Pattern
Parabolic moves are unique to crypto markets and occur when buying pressure becomes exponential.
Characteristics:
Steep price angle
Increasing candle size
RSI staying above 70 for long periods
Media and social hype at extremes
While parabolic momentum can produce massive gains, it is unsustainable. The end often comes with a sharp vertical drop, trapping late buyers.
4. Momentum Divergence Pattern
Divergences occur when price continues to make higher highs or lower lows while momentum indicators fail to confirm.
Common divergence types:
Bearish divergence (price up, momentum down)
Bullish divergence (price down, momentum up)
In crypto, divergences are early warnings, not immediate reversal signals. Strong trends can ignore divergences for extended periods, especially in Bitcoin during macro-driven cycles.
5. Mean Reversion Momentum Exhaustion
Crypto markets frequently experience momentum exhaustion, where price moves too far too fast.
Signs include:
Long wick candles
Declining volume at highs
Extreme funding rates
Overcrowded long or short positions
This often leads to sharp pullbacks or sideways consolidation rather than immediate trend reversal.
Momentum Indicators Commonly Used in Crypto Trading
Relative Strength Index (RSI)
RSI measures momentum strength but behaves differently in crypto:
RSI above 70 can persist for weeks
RSI below 30 often leads to short-term bounces
RSI mid-range (40–60) signals consolidation
Moving Averages
Momentum traders watch:
20 EMA for short-term momentum
50 EMA for trend confirmation
200 EMA for macro bias
Strong momentum often keeps price above key EMAs with shallow pullbacks.
MACD
MACD works best on higher time frames in crypto. Frequent false signals appear on lower time frames due to volatility.
Volume and Open Interest
True momentum requires participation:
Rising price + rising volume = healthy momentum
Rising price + falling volume = weak momentum
Rising Open Interest confirms leveraged participation
Role of Derivatives in Crypto Momentum
Futures and options markets significantly influence momentum patterns.
Key elements:
Funding rates reflect crowd bias
Liquidations accelerate momentum
Stop-loss cascades amplify moves
Large liquidation events often create forced momentum, leading to exaggerated candles known as “liquidation wicks.”
Momentum Across Market Cycles
Bull Market Momentum
Strong continuation patterns
Shallow pullbacks
Altcoins outperform Bitcoin
Narratives dominate fundamentals
Bear Market Momentum
Sharp relief rallies
Lower highs and lower lows
Momentum fades quickly
Volume dries up
Understanding the broader cycle is critical because the same momentum signal behaves differently depending on market conditions.
Risks of Momentum Trading in Crypto
Momentum trading is not without danger.
Major risks include:
Fake breakouts
Sudden reversals from whale activity
News-driven volatility
High leverage liquidation
Risk management is essential. Stop-loss placement, position sizing, and avoiding emotional entries are more important than indicator selection.
Best Practices for Trading Momentum in Crypto
Trade in the direction of the higher-time-frame trend
Use volume and Open Interest confirmation
Avoid chasing late-stage parabolic moves
Combine price action with momentum indicators
Respect volatility—reduce leverage during high uncertainty
Successful momentum traders focus not on predicting tops or bottoms but on participating in the middle of the move.
Conclusion
Momentum patterns in cryptocurrency markets are powerful, fast-moving, and emotionally charged. They arise from a unique blend of retail behavior, leverage, narrative influence, and structural market features. While momentum can generate outsized profits, it demands discipline, adaptability, and strong risk management.
By understanding breakout momentum, trend continuation, parabolic phases, divergence signals, and exhaustion patterns, traders can better navigate crypto’s volatile landscape. In a market where prices can double or halve in days, mastering momentum is not optional—it is essential.

Open Interest (OI) Analysis for Futures & Options TradersOpen Interest Analysis for Futures & Options Traders
Open Interest (OI) is one of the most powerful yet misunderstood tools in the derivatives market. While price and volume tell traders what is happening, open interest helps explain why it is happening and who is likely behind the move. For futures and options traders, OI analysis provides insight into market participation, strength of trends, potential reversals, and the behavior of smart money.
This makes OI a critical component for traders dealing in index futures, stock futures, options, and commodity derivatives.
What Is Open Interest?
Open Interest refers to the total number of outstanding derivative contracts (futures or options) that are currently open and not settled. Each contract represents a buyer and a seller, and open interest increases when new positions are created and decreases when positions are closed or squared off.
Key points:
OI increases when a new buyer and new seller enter a trade
OI decreases when an existing buyer and seller close their positions
OI does not change when one trader transfers a position to another
Unlike volume, which resets daily, open interest is cumulative and reflects ongoing market commitment.
Difference Between Volume and Open Interest
Many traders confuse volume with open interest, but both serve different purposes.
Volume measures how many contracts were traded during a specific period
Open Interest measures how many contracts remain open at the end of that period
High volume with low OI suggests short-term activity or intraday trading, while rising OI indicates fresh positions and conviction. Professional traders always study price, volume, and OI together.
Why Open Interest Matters in Trading
Open interest is important because it:
Confirms trend strength
Identifies new money entering or leaving
Signals long buildup or short buildup
Helps detect trend exhaustion
Improves options strategy selection
Reveals support and resistance zones
In derivatives trading, price movement without OI confirmation is often unreliable.
Open Interest Analysis in Futures Trading
1. Price Up + OI Up → Long Buildup
This indicates new buyers are entering the market with confidence.
Bullish trend confirmation
Strong upward momentum
Suitable for trend-following strategies
Example: Index futures rally with rising OI often suggests institutional buying.
2. Price Down + OI Up → Short Buildup
This signals fresh short positions entering the market.
Bearish trend confirmation
Indicates strong selling pressure
Often seen during market breakdowns
Professional traders use this to stay aligned with downside momentum.
3. Price Up + OI Down → Short Covering
This move is driven by short sellers exiting their positions.
Temporary rally
Weak bullish structure
Often occurs near resistance or after panic selling
Such rallies may fade once short covering ends.
4. Price Down + OI Down → Long Unwinding
This shows existing long positions are being closed.
Bearish but often near support
Indicates trend exhaustion
Can lead to sideways movement or reversal
Smart traders watch for price stabilization after long unwinding.
Open Interest Analysis in Options Trading
Options OI provides even deeper insights because it shows market expectations across strike prices.
Call Option Open Interest
High Call OI indicates resistance
Call writing suggests bearish or neutral outlook
Call buying suggests bullish expectations
Put Option Open Interest
High Put OI indicates support
Put writing suggests bullish or neutral outlook
Put buying suggests bearish expectations
Put-Call Open Interest Ratio (PCR)
The PCR is calculated as:
PCR = Total Put OI / Total Call OI
Interpretation:
PCR < 0.7 → Overly bullish (market may correct)
PCR between 0.7–1.2 → Balanced market
PCR > 1.3 → Overly bearish (market may bounce)
PCR is best used as a sentiment indicator, not a standalone signal.
Open Interest Shifts and Strike Price Analysis
Options traders closely watch:
Change in OI rather than absolute OI
OI buildup near key strikes
Unwinding before major breakouts
If heavy Call OI at a strike starts unwinding while price approaches it, that resistance may break. Similarly, Put OI unwinding near support can signal downside risk.
Max Pain Theory and OI
Max Pain refers to the strike price where option buyers experience maximum loss and option sellers gain maximum profit at expiry. Markets often gravitate toward this level close to expiry due to option writers’ influence.
While not exact, Max Pain combined with OI analysis improves expiry-day precision trading.
Intraday OI Analysis
For intraday traders:
Rising price + rising OI = trend continuation
Sudden OI drop = position exit or profit booking
OI spikes near VWAP = institutional activity
Intraday OI analysis is especially effective in index futures and liquid stock futures.
Common Mistakes in Open Interest Analysis
Using OI without price confirmation
Ignoring OI change and focusing only on absolute values
Misinterpreting short covering as trend reversal
Trading OI without understanding market context
Over-relying on PCR alone
OI should always be part of a broader trading framework.
Combining OI with Technical Analysis
The best results come from combining OI with:
Support and resistance
Trendlines
Moving averages
Volume profile
Price action patterns
For example, a breakout above resistance with rising volume and rising OI is far more reliable than price alone.
Role of Open Interest for Smart Money Tracking
Institutional traders rarely chase price. They build positions gradually, which reflects in:
Rising OI at key price zones
Stable price with increasing OI (accumulation)
Sudden OI drop after sharp moves (distribution)
OI helps retail traders align with smart money behavior rather than emotional price moves.
Conclusion
Open Interest analysis is an essential skill for futures and options traders who want to understand market structure, sentiment, and positioning. While price shows the outcome of trading decisions, open interest reveals the commitment and conviction behind those decisions.
When used correctly, OI helps traders:
Confirm trends
Spot reversals early
Identify strong support and resistance
Improve risk management
Trade with institutional flow rather than against it
However, open interest should never be used in isolation. Its real power emerges when combined with price action, volume, and market context. Traders who master OI analysis gain a significant edge in navigating the complex world of futures and options trading.

Part 1 Intraday Institutional Trading Types of Options- Call Option: Right to buy.
- Put Option: Right to sell.
Basic Strategies- Long Call: Bet on price ↑.
- Long Put: Bet on price ↓.
- Covered Call: Sell call on stock you own.
- Protective Put: Buy put on stock you own.

Part 1 Intraday Institutional Trading Moneyness of Options
ITM, ATM, OTM based on underlying price.
ATM options are most sensitive to price moves.
OTM options are cheap but decay fast.
Implied Volatility (IV)
Measures expected movement.
High IV = high premium.
IV crush happens after events (e.g., RBI meeting, Fed decision).

Commodity Trading: Energy, Metals & Agricultural MarketsCommodity trading involves buying and selling physical goods or their derivative contracts with the objective of profit, hedging risk, or portfolio diversification. Unlike equities (which represent ownership in companies), commodities are tangible assets such as crude oil, gold, wheat, or natural gas. These markets play a critical role in the global economy because commodities are essential inputs for energy production, manufacturing, construction, and food security.
Commodity trading is broadly divided into three major categories:
Energy Commodities
Metal Commodities
Agricultural (Agri) Commodities
Each category has unique drivers, risks, and trading characteristics.
1. Energy Commodity Trading
Energy commodities are among the most actively traded commodities globally. They are highly sensitive to geopolitical events, economic growth, and supply disruptions.
Major Energy Commodities
Crude Oil (WTI & Brent)
Natural Gas
Heating Oil
Gasoline
Coal (limited exchange trading)
Key Market Drivers
Supply & Demand Balance
OPEC+ production decisions
US shale oil output
Refinery capacity
Geopolitical Factors
Middle East tensions
Russia–Ukraine conflict
Sanctions and trade restrictions
Economic Growth
Strong economies increase fuel demand
Recessions reduce consumption
Seasonality
Natural gas demand rises in winter
Gasoline demand peaks during summer travel
Inventory Data
Weekly reports like EIA crude oil inventories
Trading Characteristics
High volatility
Strong trend-following behavior
Heavy participation by institutions, hedge funds, and governments
Prices often react sharply to news and data releases
Trading Instruments
Futures contracts (most common)
Options on futures
Commodity ETFs
CFDs (in some markets)
Energy trading is popular among short-term traders due to sharp intraday movements, but it also attracts hedgers like airlines and oil producers.
2. Metal Commodity Trading
Metals are divided into Precious Metals and Base (Industrial) Metals, each serving different economic purposes.
A. Precious Metals Trading
Major Precious Metals
Gold
Silver
Platinum
Palladium
Key Drivers
Inflation & Interest Rates
Gold performs well during high inflation
Rising interest rates often pressure prices
Currency Movements
Strong US Dollar usually weakens precious metals
Safe-Haven Demand
Economic crises, wars, or market crashes boost demand
Central Bank Buying
Especially important for gold
Trading Characteristics
Gold is relatively less volatile than energy
Silver is more volatile due to industrial usage
Strong correlation with macroeconomic indicators
Gold is often used as a hedge against inflation and currency risk, making it popular with long-term investors as well as traders.
B. Base (Industrial) Metals Trading
Major Base Metals
Copper
Aluminium
Zinc
Nickel
Lead
Key Drivers
Industrial & Infrastructure Demand
Construction
Manufacturing
Electric vehicles and renewable energy
Economic Growth Indicators
GDP growth
PMI data
Supply Constraints
Mining disruptions
Environmental regulations
China’s Demand
China is the largest consumer of base metals
Trading Characteristics
Strongly cyclical
Move with global economic cycles
Copper is often called “Dr. Copper” because it signals economic health
Base metals are ideal for traders who closely follow macro and industrial trends.
3. Agricultural (Agri) Commodity Trading
Agricultural commodities represent soft commodities derived from farming and livestock. These markets are deeply influenced by natural and seasonal factors.
Major Agricultural Commodities
Grains: Wheat, Corn, Rice
Oilseeds: Soybean, Mustard
Softs: Sugar, Coffee, Cotton
Livestock: Live Cattle, Lean Hogs
Key Market Drivers
Weather Conditions
Rainfall, droughts, floods
El Niño and La Niña effects
Crop Reports
USDA acreage and yield reports
Sowing and harvesting data
Seasonality
Planting and harvest cycles
Government Policies
Minimum Support Prices (MSP)
Export/import restrictions
Global Demand
Population growth
Biofuel usage (corn → ethanol)
Trading Characteristics
Often range-bound, except during supply shocks
Highly seasonal
Can experience sudden spikes due to weather news
Agri trading is popular among farmers and food companies for hedging, as well as speculators who understand seasonal cycles.
Commodity Trading Instruments & Markets
Common Trading Instruments
Futures Contracts (primary instrument)
Options on Futures
Spot Markets
ETFs / ETNs
Commodity Mutual Funds
Indian Commodity Exchanges
MCX (Multi Commodity Exchange) – Energy & Metals
NCDEX – Agricultural commodities
Global Commodity Exchanges
CME Group (USA)
LME (London Metal Exchange)
ICE Exchange
Risk Management in Commodity Trading
Commodity markets are volatile, so risk management is critical:
Use stop-loss orders
Proper position sizing
Avoid over-leveraging
Understand contract specifications (lot size, expiry)
Be aware of rollover risks
Professional traders focus more on capital protection than profit chasing.
Advantages of Commodity Trading
Portfolio diversification
Inflation hedge
High liquidity (especially energy & metals)
Opportunities in both rising and falling markets
Risks Involved
High volatility
Leverage risk
Sudden policy or weather-driven shocks
Global geopolitical uncertainty
Conclusion
Commodity trading in Energy, Metals, and Agricultural markets offers diverse opportunities for traders, investors, and hedgers. Energy commodities provide high volatility and strong trends, metals reflect macroeconomic and industrial health, while agricultural commodities are driven by seasonality and weather. Successful commodity trading requires a solid understanding of fundamental drivers, technical analysis, and strict risk management.
When approached with discipline and knowledge, commodities can be a powerful addition to any trading or investment strategy.

Part 4 Institutional VS. Technical1. Delta
Measures how much the premium changes with a ₹1 move in the underlying.
Call delta: +0.0 to +1.0
Put delta: –0.0 to –1.0
High delta = faster premium movement.
2. Gamma
Measures how fast delta changes. Used to evaluate momentum and risk.
3. Theta
Measures time decay—how much premium decreases as expiration approaches.
Sellers benefit from theta.
Buyers lose value daily.
4. Vega
Measures sensitivity to implied volatility (IV).
Higher IV → higher premium.
5. Rho
Impact of interest rates (less important for short-term traders).

Equity Market Trends: An In-Depth Analysis1. Defining Equity Market Trends
At its core, an equity market trend refers to the general direction in which stock prices move over a period. These trends can be upward (bullish), downward (bearish), or sideways (neutral/consolidation). Bullish trends indicate sustained buying pressure, reflecting optimism about the economy or specific sectors. Conversely, bearish trends signify prolonged selling pressure, often triggered by negative economic signals, corporate earnings disappointments, or geopolitical tensions. Sideways trends occur when the market fluctuates within a range without a clear directional bias, often reflecting indecision among investors.
Trends are influenced by a combination of fundamental, technical, and behavioral factors. While fundamental factors relate to corporate earnings, macroeconomic indicators, and monetary policies, technical factors focus on price patterns, moving averages, and market volumes. Behavioral factors capture investor psychology, herd behavior, and sentiment-driven trading.
2. Historical Trends and Market Cycles
Historically, equity markets exhibit cyclicality. Markets move in long-term secular trends, lasting several years, superimposed with short-term cyclical fluctuations driven by economic and corporate cycles. For instance, the post-World War II era saw sustained growth in global equities, punctuated by periods of correction during recessions, oil crises, and financial meltdowns such as the 2008 Global Financial Crisis.
Equity markets often follow the four phases of market cycles:
Accumulation Phase: Smart money or institutional investors begin buying stocks at undervalued levels.
Mark-Up Phase: Rising prices attract broader participation, leading to bullish trends.
Distribution Phase: Early investors start booking profits, slowing growth.
Mark-Down Phase: Pessimism prevails, resulting in sustained declines.
Recognizing these phases helps investors anticipate trend reversals and manage risk effectively.
3. Key Drivers of Equity Market Trends
Equity trends are shaped by a multitude of interconnected factors:
a. Macroeconomic Indicators
Economic indicators such as GDP growth, inflation, interest rates, unemployment, and industrial production heavily influence stock market trends. For example, strong GDP growth and low unemployment generally foster bullish sentiment. Conversely, rising inflation or tightening interest rates may trigger bearish trends as borrowing costs increase and corporate profits are pressured.
b. Corporate Earnings
Earnings growth is a primary determinant of stock performance. Consistently strong earnings growth supports rising stock prices, while disappointing results can trigger corrections. Investors often rely on forward-looking earnings estimates to gauge potential market directions.
c. Monetary and Fiscal Policy
Central bank policies, including interest rate adjustments and quantitative easing, directly impact equity markets. Lower interest rates reduce borrowing costs, making equities more attractive relative to fixed-income securities. Similarly, fiscal stimulus measures, such as tax cuts or government spending, can boost investor confidence and drive market rallies.
d. Global Events
Equity markets are increasingly interconnected. Geopolitical tensions, trade wars, pandemics, and technological disruptions can create volatility. For example, the COVID-19 pandemic caused a sharp market sell-off in early 2020, followed by an unprecedented recovery fueled by global stimulus.
e. Sectoral Trends
Not all sectors move in unison. Technology, healthcare, energy, and financials often exhibit independent trends based on sector-specific developments. Investors track sector rotation strategies to capitalize on these divergences, moving capital from overvalued sectors to those with higher growth potential.
4. Technical Analysis and Trend Identification
Technical analysis plays a critical role in identifying and confirming market trends. Common tools include:
Moving Averages: Indicators like the 50-day and 200-day moving averages help identify bullish or bearish momentum. A crossover between short-term and long-term averages often signals trend reversals.
Trendlines and Channels: Connecting price highs and lows visually highlights the market’s direction.
Momentum Indicators: Tools like RSI (Relative Strength Index) and MACD (Moving Average Convergence Divergence) help assess whether the market is overbought or oversold.
Volume Analysis: High trading volumes during price increases suggest trend strength, while low volumes may indicate weakening momentum.
Technical analysis provides insights into entry and exit points, trend duration, and potential reversals, complementing fundamental analysis.
5. Investor Behavior and Sentiment
Equity trends are also heavily influenced by behavioral finance. Psychological factors, such as fear, greed, and herd mentality, often exaggerate market movements. For instance:
Fear-driven sell-offs can lead to panic-induced bearish trends.
Speculative bubbles form when optimism drives overvaluation, as seen during the dot-com bubble of the late 1990s.
Market sentiment indicators, such as the VIX (Volatility Index), measure investor anxiety and help anticipate trend shifts.
Understanding sentiment allows investors to make contrarian moves, buying during pessimism and selling during irrational exuberance.
6. Recent Equity Market Trends
In the past decade, global equity markets have exhibited several notable trends:
Technology-led Bull Market: Growth in digitalization, cloud computing, and AI has fueled long-term bullish trends in technology stocks.
Sustainable and ESG Investing: Increasing focus on environmental, social, and governance factors has shifted capital toward sustainable investments, impacting sector trends.
Market Volatility: Geopolitical tensions, inflationary pressures, and interest rate cycles have resulted in alternating bullish and bearish phases.
Retail Investor Influence: Platforms enabling easy stock trading have introduced new dynamics, contributing to rapid price swings and short-term trends.
Emerging trends include AI-driven investment strategies, algorithmic trading, and growing interest in thematic and global ETFs, further diversifying equity market behavior.
7. Risk Management in Trending Markets
While trends offer opportunities, they also carry risks:
Trend Reversals: Markets can suddenly reverse due to economic shocks or geopolitical events, causing significant losses.
Overvaluation: Extended bullish trends may lead to asset bubbles.
Liquidity Risks: Sudden sell-offs can strain liquidity, especially in small-cap stocks.
Investors manage these risks through diversification, hedging strategies, and systematic monitoring of trend indicators. Setting stop-loss limits and maintaining a balanced portfolio are essential for capital preservation.
8. Conclusion
Equity market trends are a dynamic interplay of economic fundamentals, corporate performance, investor sentiment, and global events. Understanding these trends requires a holistic approach that combines macro analysis, technical tools, behavioral insights, and risk management. Long-term success in equities depends on recognizing the market cycle, tracking macroeconomic shifts, and identifying sector-specific opportunities.
While trends offer avenues for wealth creation, they demand disciplined investment strategies, continuous learning, and the ability to adapt to changing market conditions. With globalization, technological innovation, and increasing retail participation, equity market trends are becoming more complex, volatile, and interconnected, presenting both opportunities and challenges for investors worldwide.
In essence, equity market trends are not just about price movements—they are reflections of economic realities, corporate health, investor psychology, and global dynamics. By studying trends rigorously, investors can navigate the uncertainties of the market, capitalize on growth opportunities, and safeguard their investments against volatility. In the modern financial ecosystem, staying attuned to equity market trends is both an art and a science, requiring analytical acumen, emotional discipline, and strategic foresight.

S&P 500: Late-Stage Structure Worth WatchingThe S&P 500’s recent advance is showing overlapping price action and narrowing ranges , raising the possibility of a developing Ending Diagonal near the highs.
Internally, the move lacks impulsive strength , with Wave (v) struggling for follow-through and RSI hovering around the mid-50s, suggesting momentum is not confirming price . This behavior is more typical of a terminal phase than a trend expansion.
That said, this is not a confirmed top . A break below the lower diagonal would support the bearish case, while strong acceptance above recent highs would invalidate the diagonal view.
For now, this remains a caution zone , not a conviction call.
Disclaimer: This analysis is for educational purposes only and does not constitute investment advice. Please do your own research (DYOR) before making any trading decisions.

Part 2 Technical VS. Institutional Common Options Trading Strategies
Options trading is not limited to buying calls and puts. Some widely used strategies include:
Covered Call: Holding a stock and selling a call option to earn premium income.
Protective Put: Buying a put option to protect a stock holding from downside risk.
Straddle: Buying both a call and a put at the same strike price to profit from high volatility.
Strangle: Similar to a straddle but with different strike prices.
Spread Strategies: Using multiple options to limit risk, such as bull spreads and bear spreads.
These strategies allow traders to tailor risk and reward according to their market outlook.

Part 11 Trading Master Class With Experts Understanding Option Pricing
Option pricing is influenced by:
Stock Price
Strike Price
Time to Expiry
Volatility
Interest Rates
Dividends

Is this a Top in US500 Bearish Divergence + Rising WedgeThe US500 is forming higher highs in price, while the RSI is showing a clear bearish divergence, failing to confirm the move and indicating weakening momentum. Additionally, the price action is developing a rising wedge pattern, which typically signals exhaustion. A decisive close below the lows of the past two sessions could confirm a short-term top, especially amid ongoing negative geopolitical developments.

Part 11 Trading Master Class With Experts What Are Options?
Options are derivative contracts, meaning their value is derived from an underlying asset such as:
Stocks
Index (Nifty, Bank Nifty)
Commodities (Gold, Crude)
Currency pairs
ETFs
An option gives the buyer the right, but not the obligation, to buy or sell the underlying asset at a fixed price within a specific period.
There are two main types of options:
1. Call Option
A Call Option gives you the right to buy the underlying asset at a fixed price.
2. Put Option
A Put Option gives you the right to sell the underlying asset at a fixed price.
That “fixed price” is called the strike price, and the last day on which you can exercise the option is called the expiry date.

SPY - Hope it tops this time :)US markets have been super resilient, sucking capital from across the world.
We have a good pattern in place, as the triggers for pushing the market up have been reducing with time, with everything running quite thin.
The rally has been quite low on breadth and is supported on weak pillars - but still has been resilient and all selling have been bought into.
Let's see if it breaks and sustains this time.
We need a 10-15% (ideally + 20%) fall in US for money to flow into emerging markets :)
It is a good time to try some positional shorts with SL as 7k.
View void if we sustain above 7k.

Part 6 Learn Institutional Trading Key Terminologies in Options Trading
Before diving into strategies and mechanics, it’s crucial to understand some foundational terms:
Underlying Asset: The security on which the option is based (e.g., stocks, indices, commodities, currencies).
Strike Price (Exercise Price): The price at which the option holder can buy or sell the underlying asset.
Expiration Date (Maturity): The date on which the option contract expires.
Premium: The cost of purchasing the option, influenced by intrinsic and extrinsic factors.
Intrinsic Value: The real, immediate value of the option if exercised now.
Time Value: The portion of the premium representing the potential for the option to gain value before expiration.
In-the-Money (ITM): A call option is ITM if the underlying price is above the strike price; a put is ITM if the underlying is below the strike price.
Out-of-the-Money (OTM): A call is OTM if the underlying price is below the strike price; a put is OTM if above.
At-the-Money (ATM): When the strike price is roughly equal to the current price of the underlying asset.

Unlock Market Rotation: Turn Shifting Trends into Powerful ProfiStay Ahead of Capital Flow & Capture the Next Big Opportunity
What Is Market Rotation?
Market rotation refers to the movement of capital from one sector, asset class, or investment theme to another as economic conditions, interest rates, inflation, and growth expectations change. Understanding this shift allows investors to align portfolios with where money is flowing next, not where it has already been.
Why Market Rotation Matters More Than Ever
In today’s fast-moving global markets, leadership changes quickly. Sectors that outperform in one phase of the cycle can underperform in the next. Investors who unlock market rotation gain a powerful edge by identifying early signals and positioning before the crowd reacts.
Economic Cycles Drive Rotation
Different sectors perform best at different stages of the economic cycle. Early recovery favors cyclicals, mid-cycle supports growth sectors, late-cycle shifts toward defensives, and slowdown phases reward capital preservation strategies. Market rotation is the bridge between macro trends and smart allocation.
Interest Rates as a Key Trigger
Rising interest rates often rotate money away from high-growth, high-valuation stocks toward value, financials, and commodities. Falling rates usually support technology, consumption, and growth-oriented sectors. Tracking rate expectations is critical to anticipating rotation.
Inflation and Sector Leadership
Inflation reshapes winners and losers. High inflation typically benefits energy, metals, and real assets, while compressing margins in rate-sensitive sectors. Unlocking rotation means understanding how inflation impacts pricing power across industries.
Institutional Money Leaves Clues
FIIs, DIIs, and large institutional players move capital systematically. Volume expansion, relative strength, and sectoral index breakouts often signal early institutional rotation. Smart investors learn to read these footprints rather than react to headlines.
Relative Strength Is the Core Tool
Market rotation is best identified through relative performance. Comparing sectors against benchmark indices reveals which areas are gaining strength and which are losing momentum. Sustained outperformance is a strong sign of rotation in progress.
From Sector to Stock-Level Rotation
Rotation doesn’t stop at sectors—it flows into sub-sectors and then into specific stocks. Leaders within a strong sector usually outperform peers. Unlocking market rotation means narrowing focus from macro to micro with precision.
Risk Management Through Rotation
Instead of exiting markets entirely, rotation allows investors to shift risk, not abandon opportunity. When one theme weakens, another strengthens. This approach smooths volatility and improves long-term consistency.
Psychology of Market Rotation
Most investors chase past performance. Market rotation rewards those who act before trends become obvious. Discipline, data-driven decisions, and patience are essential to avoid emotional investing.
Technical Indicators That Signal Rotation
Moving averages, sectoral relative strength lines, momentum oscillators, and trend confirmation tools help validate rotation. Technical confirmation ensures that allocation decisions are backed by price action, not assumptions.
Macro Events Accelerate Rotation
Central bank decisions, geopolitical shifts, policy reforms, and global growth changes can rapidly accelerate capital movement. Prepared investors use these events as catalysts rather than shocks.
Short-Term vs Long-Term Rotation
Rotation can be tactical (weeks to months) or strategic (quarters to years). Traders benefit from short-term sector momentum, while investors focus on structural shifts like digitization, energy transition, or infrastructure growth.
Equity, Debt, and Alternative Rotation
Rotation is not limited to equities. Capital also moves between stocks, bonds, commodities, and alternative assets. A holistic approach captures opportunities across asset classes.
Market Rotation in Indian Markets
In India, rotation often reflects domestic growth cycles, government policies, earnings visibility, and global capital flows. Understanding local drivers adds a significant advantage to portfolio positioning.
Avoiding Overcrowded Trades
When a sector becomes over-owned, upside potential reduces. Unlocking market rotation helps investors exit crowded themes early and enter emerging ones before valuations expand.
Consistency Beats Prediction
Market rotation is not about predicting tops or bottoms. It is about consistently reallocating capital toward strength and away from weakness based on objective signals.
Portfolio Rebalancing with Purpose
Regular rebalancing aligned with rotation trends keeps portfolios dynamic. This reduces drawdowns and improves risk-adjusted returns over time.
Long-Term Wealth Creation Advantage
Investors who master market rotation compound gains by riding multiple leadership cycles instead of staying stuck in one theme. This adaptability is key to sustainable wealth creation.
Unlock the Edge
Market rotation is the silent force behind every major rally and correction. Those who understand it move ahead of trends, protect capital during uncertainty, and capture opportunity when it matters most.
Unlock Market Rotation is not just a strategy—it’s a mindset. By tracking capital flow, aligning with economic cycles, and acting decisively, investors can transform uncertainty into opportunity and stay one step ahead of the market.

Part 7 Trading Master Class What Are Options?
Options are financial derivatives, meaning their value is derived from an underlying asset such as stocks, indices, commodities, or currencies.
An option is a contract that gives the buyer the right, but not the obligation, to buy or sell the underlying asset at a predefined price before or on a fixed date.
There are two types of options:
1. Call Option
Gives the right to buy.
A trader buys a call if they expect the price of the underlying asset to go up.
2. Put Option
Gives the right to sell.
A trader buys a put if they expect the price to go down.
Each option has:
Strike Price: The price at which buying/selling occurs.
Expiry Date: The last date the contract is valid.
Premium: The price paid to buy the option.

SMC Breakdown – US500 (15M)Price delivered a strong sell-side liquidity sweep, followed by an impulsive bullish displacement, confirming short-term bullish intent. Post-displacement, market respected structure and began forming higher highs and higher lows, indicating internal BOS to the upside.
Current price is reacting into a premium supply zone / HTF imbalance, aligning with prior distribution. This area is marked as a high-probability reaction zone, not an immediate entry.

Risk Smart, Grow Fast: The Art of Intelligent Wealth CreationUnderstanding Risk the Right Way
Risk is often misunderstood as something to avoid. In reality, risk is unavoidable in any form of growth—whether in trading, investing, business, or personal development. The key difference between winners and losers is not the presence of risk, but how risk is managed. Smart risk-takers identify potential downsides before focusing on upside. They ask critical questions: What can go wrong? How much can I lose? Can I survive this loss? This mindset shifts risk from a threat into a calculated tool.
The Power of Risk Management
Risk management is the backbone of fast yet sustainable growth. Without it, even the best strategy eventually collapses. Smart risk management involves defining risk limits, position sizing, diversification, and exit rules. In trading and investing, this could mean risking only a small percentage of capital on each trade. In business, it might involve testing ideas on a small scale before full implementation. By controlling downside, you create the freedom to pursue opportunities aggressively without fear of ruin.
Why Smart Risk Accelerates Growth
Ironically, those who take controlled risks often grow faster than those who chase high rewards impulsively. This is because they stay in the game longer. Consistency compounds. A person who avoids catastrophic losses can benefit from compounding returns, learning cycles, and experience. Over time, small intelligent gains stack up, leading to exponential growth. Fast growth is rarely about one big win—it is about many smart decisions executed repeatedly.
The Role of Probability and Edge
Smart risk-takers think in probabilities, not certainties. They understand that no decision guarantees success. Instead, they focus on having an edge—a situation where the odds are slightly in their favor over many repetitions. In markets, this might be a tested strategy. In careers, it might be acquiring rare skills. Growth becomes fast when decisions are aligned with favorable probabilities and repeated consistently with discipline.
Emotional Control: The Hidden Advantage
One of the biggest threats to smart risk-taking is emotion. Fear leads to hesitation, while greed leads to overexposure. Emotional decisions distort risk perception and cause impulsive behavior. Those who grow fast learn to detach emotionally from outcomes and focus on processes. Losses are treated as feedback, not failure. This emotional resilience allows them to take the next opportunity confidently without being psychologically damaged by past setbacks.
Learning From Losses Without Being Destroyed by Them
Losses are inevitable when taking risks, but smart risk-takers design losses to be small and educational. Instead of asking “How do I avoid losses?”, they ask “How do I ensure losses don’t harm my long-term progress?” This shift is powerful. Each controlled loss becomes a tuition fee for experience. Over time, this learning curve accelerates growth far more than avoiding risk altogether.
Leverage: A Tool, Not a Shortcut
Leverage—whether financial, time-based, or skill-based—can accelerate growth dramatically, but it magnifies both gains and losses. Smart growth does not reject leverage; it respects it. Using leverage responsibly means ensuring that a single mistake cannot wipe out years of effort. Those who grow fast understand leverage deeply and apply it only when risk is well defined and controlled.
Diversification vs. Focus
Risk-smart growth balances diversification and focus. Diversification protects capital and reduces volatility, while focus allows for meaningful impact and higher returns. Intelligent growth strategies often start with diversification to survive and learn, then gradually increase focus as confidence, skill, and edge improve. This phased approach reduces risk while maintaining growth momentum.
Long-Term Vision With Short-Term Discipline
Growing fast does not mean thinking short term. In fact, the fastest sustainable growth often comes from a long-term vision supported by strict short-term discipline. Every decision is evaluated based on how it fits into the bigger picture. Short-term setbacks are accepted if they align with long-term goals. This clarity prevents impulsive risk-taking and keeps growth on track.
Risk Smart Is a Mindset, Not a Strategy
Ultimately, Risk Smart, Grow Fast is a mindset. It is about respecting uncertainty, preparing for downside, and acting decisively when opportunity arises. It requires humility to accept what you don’t know and confidence to act on what you do. This mindset applies beyond finance—to careers, entrepreneurship, relationships, and personal growth.
Conclusion
Fast growth is not achieved by avoiding risk or chasing reckless rewards. It is achieved by understanding risk, controlling it, and using it intentionally. When risks are smart, losses are survivable, learning accelerates, and compounding works in your favor. In a world full of noise and shortcuts, those who risk smartly stand out—not because they never fail, but because they never allow failure to stop them. That is the true formula to grow fast and grow strong.

S&P 500 — Mature but Structurally HealthyThe S&P 500 remains in a long-term impulsive uptrend at cycle degree.
Despite maturity, the structure shows no confirmed cycle-degree violation. Corrections continue to be corrective, not distributive.
This suggests the global equity cycle is aging — but not ending.
Invalidation: Only a confirmed breakdown below the primary rising structure would alter the yearly view.
📌 Cycles age before they end.
#SP500 #USMarkets #Equities #MarketStructure #CycleAnalysis #LongTermView
