SPU- SPOOS OOPS NUMBERSChart details in text is self explanatory. We have completed shoulder and head and are now in right shoulder (view negates above 4630 close).. What is interesting is the current move down which is impulsive... can extend the move towards 4030-80... 4300 close confirms 4630 close negates.
Trade ideas

S&P 500 (short) You can short S&P 500 near resistance line for tgts as mentioned on charts. It has rise without much consolidation. If 4200 broken as support it may reach 3400. Very less likely but still its not impossible.
Please correlate by yourself also on charts. This is for paper trading and educational purpose only. Must consult your Financial advisor before investing.

S&P 500S&P 500 is trying to make a base after correcting 12% in 3 weeks.
Near 200 D EMA
Support at 4300 level
This is a good indication for the INDIAN market, before BUDGET
#budget2022 #globalmarket #techinicalanalysis #trader

SPXCritical support around 200 day averages.
Last Support demand points
RSI hit oversold and exiting for a swing bottom.

S&P 500 Index - FallS&P 500 Index - Fall
It will fall another 600 points surely in next few weeks...

Deep Analysis on SPX BULLISHHDeep Analysis on SPX in the long timeframe (1M). Hence market is in restesting face in long/ short time.

S&P 500 As per cycle calculation S&P 500 i am looking long here @ 4227
As per my Dynamic Cycles looking 4450 Target
As per Cycle 4227 cycle finished further down only below 4156
Buy @4227 Keep Sl 4156

S&P 500 Index (Weekly)
> Break down of channel
> Closed below 21 EMA in a significant manner after almost 2 years (last time was 24 Feb 2020 week)
> There is small support around 4250 levels
Are we heading towards some serious correction??


S&P 500 (SPX) | Best point for sell🎯Hello traders, S&P 500 in daily timeframe , this analysis has been prepared in daily timeframe but has been published for a better view in 2 day timeframe.
According to the count, the first 1 and 2 waves have been completed and wave 2 is not normal correction compared to the main wave 1 because it does not have good conditions in terms of time and depth of correction, but in our wave, wave 2 is in this range.
In our opinion, the 3rd main wave is not complete and the 5th microwave is being formed.
The microwave 5 is not in the range that is likely to end compared to waves 1 and 3, so we think this wave will move up to the Fabio 0.38 relative to the previous waves and then the desired correction will begin.
The structure of wave 5 itself is in its fifth wave, which is relatively well formed in good conditions, and for the completion of other waves and better roofing, we will have climbs up to Fibo 0.618.
Breaking the trend line is required to confirm the correction.
🙏If you have an idea that helps me provide a better analysis, I will be happy to write in the comments🙏
❤️Please, support this idea with a like and comment!❤️

SPX AND BTC relationshipsearlier i have said that if spx fall btc will also fallls and now spx is recovering so btc is also recovering

S&P500#SPX
When SPX broke out to new all-time highs at the end of 2021 and the beginning of 2022, it left behind support at 4700 – the area of the old highs.
That level is now being broken & I'm assuming Major top done of 2009-2021 Bull Cycle.

S&P 500 (SPX) | Best point for sell🎯Hello traders, S&P 500 in daily timeframe , this analysis has been prepared in daily timeframe but has been published for a better view in 2 day timeframe.
In indicators, the ratio of waves to each other is either too low or too high.
In this wave, wave 1 is formed and wave 2 has modified wave 1 relatively little.
Wave 3 then forms its microwave trend in a relatively normal state on a line and is in its last microwave.
Wave 5 The last microwave, wave 3 is not complete and this wave is on Fibo 0.50 compared to its microwaves and is not in a good position compared to the waves of the main wave 3 and it is better to return from the point after completing the waves to Fibo 0.38 Do a quick move.
Also, waves 3 and 4 of wave 5 of wave 3 form a harmonious pattern, and if this pattern is correct and we break the red circle and the downward trend line , we will have a heavy downward trend.
🙏If you have an idea that helps me provide a better analysis, I will be happy to write in the comments🙏
❤️Please, support this idea with a like and comment!❤️

SPX is forming a Flag patternS&P500 looks extremely bullish. But again volumes are on the average side. If the volume expansion kicks in with the breakout of this flag patter then may witness a huge upmove.

S&P 500 (SPX) | Best point for sell🎯Hello traders, S&P 500 in daily timeframe , this analysis has been prepared in daily timeframe but has been published for a better view in 2 day timeframe.
In the indicators, because the movements of the waves are always upward and its corrections are very short compared to the forward movement that is done, no relation between the waves can be detected.
Therefore, we consider the beginning of new waves after the biggest correction in terms of time.
After the largest correction, we counted an almost normal wave 1 and a not-so-excellent wave 2, and considered the rest of the waves to be related to wave 3, and it was only in this scenario that we were able to make a connection between the waves.
Wave 3 is probably made up of 1, 2, 3, and 4 microwaves, and now we are inside wave 5.
In the previous analysis, we said that if the end of the previous wave is broken, the motion will be different and so on.
From wave 5, this ascent is related to microwave 5, which according to Fibo must end before 4900 and start the correction by breaking the black trend line .
If the price moves more than the specified targets, this count should be doubted.
🙏If you have an idea that helps me provide a better analysis, I will be happy to write in the comments🙏
❤️Please, support this idea with a like and comment!❤️

SPX FOR 17/12/2021HI, Please look @ the graph. I Find it accurate . I have made quite good money.. Hope You all will make some money with this graph.
Thankyou.

Shorting Spx 500 is rewarding set up as its unable to break the previous high's and in shorter time frame its making downtrend hence can short now and blue line is sl for first target 4600 and second target would be 4550.
please book profit as per you need safe tradet can go short below box candle close.

S&P500 at decisive level S&P 500 1D Chart
Observation 1 - S&P 500 is presently at the lower band of the upward channel formed since April 2020.
Observation 2 – Focused view of the last 2 months shows, S&P 500 is seen taking support at 50% retracement level (Oct 4 Low – Nov 22 High).
Conclusion:
S&P 500 taking support at 50% retracement level on two months chart when it is at the lower band of 19 months old upward channel is indicating
a) Even with small down moves during the week, S&P 500 can still maintain its position within upward channel as the lower band is upward moving.
b) Decisive close below 4480 may accelerate the downfall. SP:SPX

spx negative breakdownnegative breakdown in spx
the bollinger band shown an overbought territory
and spx h=given a breakdown below the 20 period mid band security areas
is a negative sign technically

S&P MONTHLY chart ...S&P too showing massive distribution pattern on monthly log scale.If my analysis is to be true then massive crash is coming . It will wipe out investors money .

US500 SELL SELL SELL!!!!bearish divergence followed by a break and retest of downward structure. entry was at retest and i will be riding this down to the previous structure level at 4482 area.

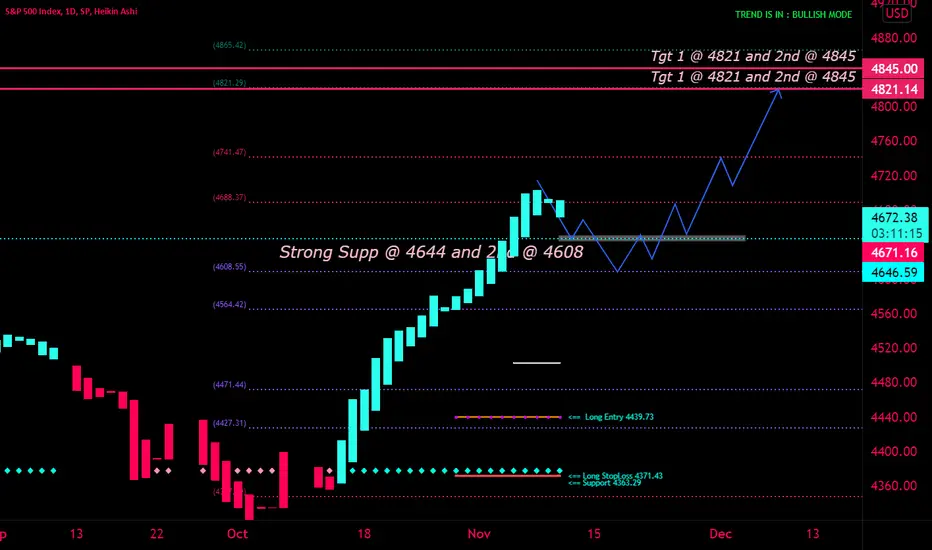
S&P500 Bullish but overbought region .. S&P500 is in oversold and hasnt corrected much might retest 4608 before its next upward move whidh will lead it to 4821.29/ 4845.42
Trading gaps with a confirmation
I'm trading from last 2 years, started from Indian Stock Market and join the cryptos and forex as well yeah may be you will think that I'm a newbie but trust me price action is the real king.
Today I am sharing one of my favourite strategy the gap with power candle confirmation, so in this tutorial I'm going to tell you How I personally trade gaps the strategy is very simple and easy to understand.
As you can see in the above image the chart is a index chart of S&P 500, there is a gap up opening at 15 October 19:00(UTC+5:30) with creating a gap up in 15 min. timeframe, the gaps are of 3 types and I really don't know the name of the gaps just know how to react on these, now come to the point at 18 October 19:00(UTC+5:30) on 15 min. timeframe the price made a green hammer candle with lows touching the gaps as support and that's the point at the gap if there is a healthy bullish hammer candle then we can initiate a buy trade by placing the stop loss just below the lower levels of the candle and can expect a R:R of 1:1.5 minimum .
Don't follow it blindly be sure to backtest this before execution.
Happy to share this my first Idea.
- NITIN
