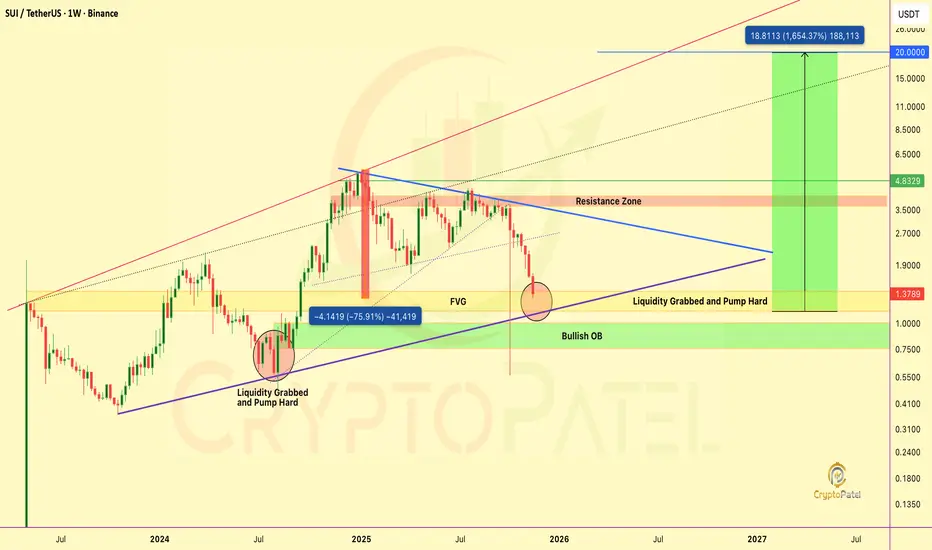
$SUI PRICE FORECAST | IS $20 POSSIBLE? CRYPTOCAP:SUI PRICE FORECAST | IS $20 POSSIBLE? | ANALYSIS BY CRYPTOPATEL
CRYPTOCAP:SUI Is Showing A Clear High-Timeframe Smart Money Re-Accumulation Structure On The Weekly Chart After A Deep Correction From 2024 Highs.
Market Structure Overview
After A ~76% Drawdown, Price Swept Liquidity At
Related pairs

$SUI JUST ENTERED ITS DO-OR-DIE ZONE CRYPTOCAP:SUI JUST ENTERED ITS DO-OR-DIE ZONE AND THE WEEKLY CHART IS SCREAMING A REVERSAL SETUP
Everyone is panicking at the dump…
But nobody is seeing what actually happened on the HTF:
🔹 Massive Liquidity Grab Completed — identical to the 2024 bottom pattern.
🔹 Price nuked directly into FVG + B
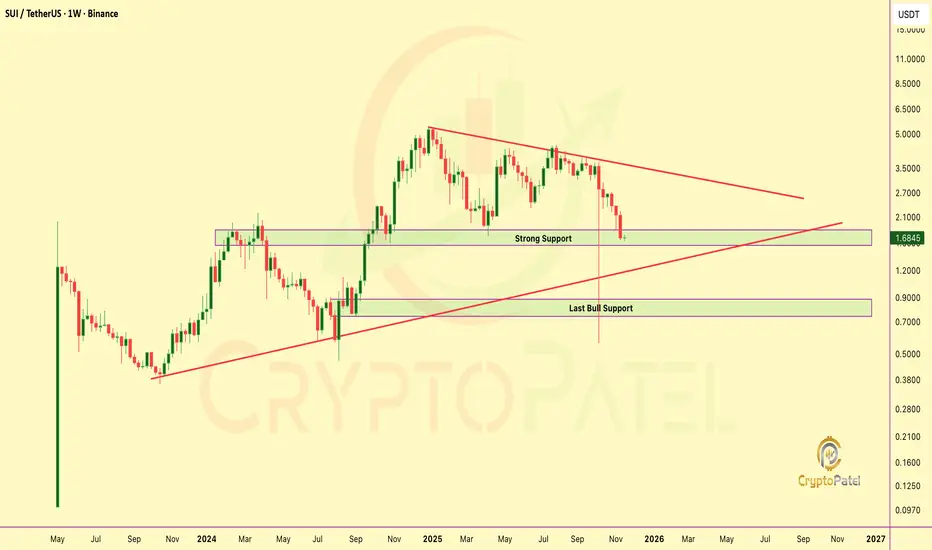
$SUI $1.66: The Liquidation Event That Just Printed the Next CycCRYPTOCAP:SUI Sharp ~70% Drawdown to the $1.66 zone has triggered broad Capitulation, with sentiment flipping decisively risk-off.
This is market structure: forced liquidity, weak-hand exits, and a reset in positioning after an overextended leg.
But historically, deep corrective sweeps often mark
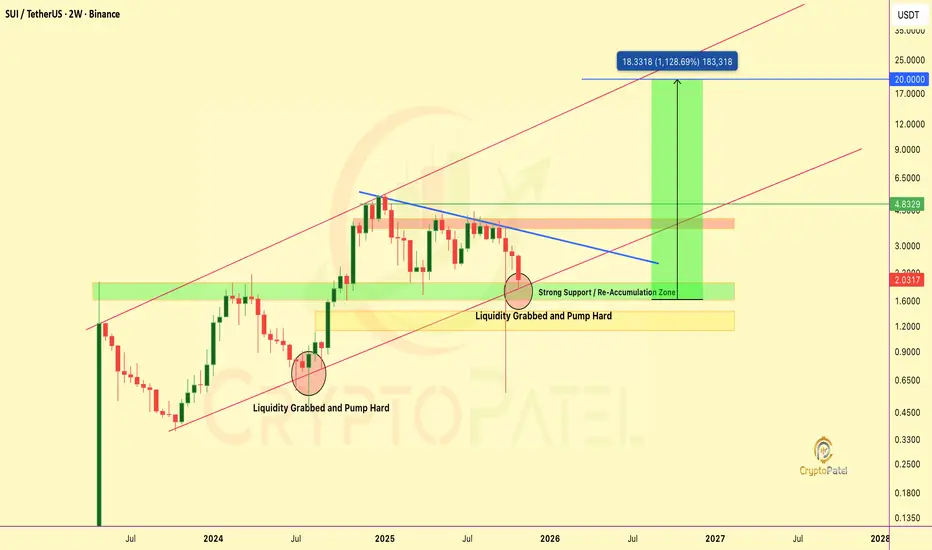
SUI– Breakout Setup Forming, Bulls Eyeing a Move Toward $20SUI/USDT – Breakout Setup Forming, Bulls Eyeing a Move Toward $20
SUI is building a strong re-accumulation base after months of correction. The $1.6–$2 demand zone continues to attract heavy buying interest, the same zone that triggered the last major rally.
Technical Highlights:
✅ Multiple liquid
Will SUI/USDT hit $20 in current bull market or future?SUI Testing Final Demand Zone: Reversal Imminent?
SUI is currently testing a major re-accumulation zone around $2.1 – $1.8, which previously acted as a strong demand area.
A liquidity grab below this level could trigger a sharp reversal, similar to the last time price swept lows before a massive ra

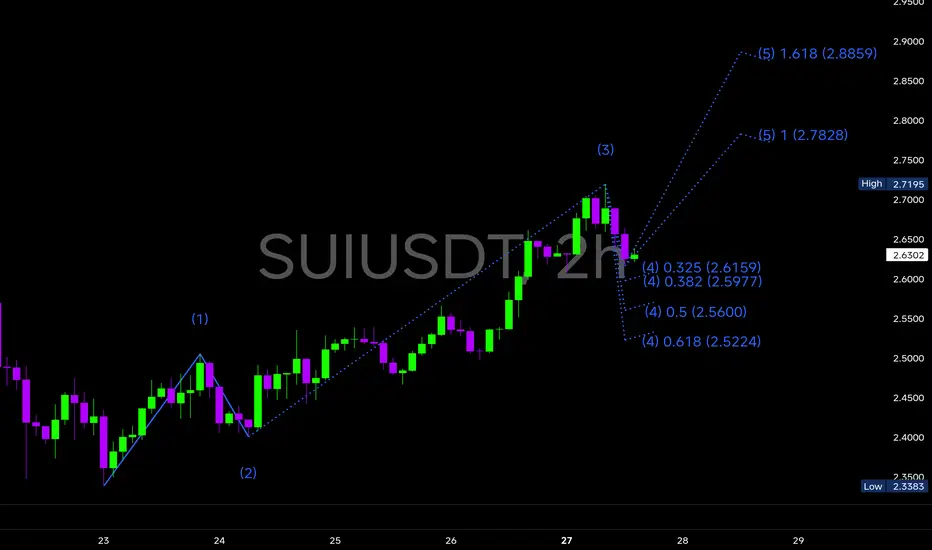
$SUI continues to follow our previously projected bullish pathCRYPTOCAP:SUI continues to follow our previously projected bullish path, showing impressive technical alignment across both Elliott Wave structure and MA confluences.
🔹We’re currently in Wave 4 correction after completing an impulsive Wave 3 rally that peaked around 2.71.
🔸Wave 4 retracement app
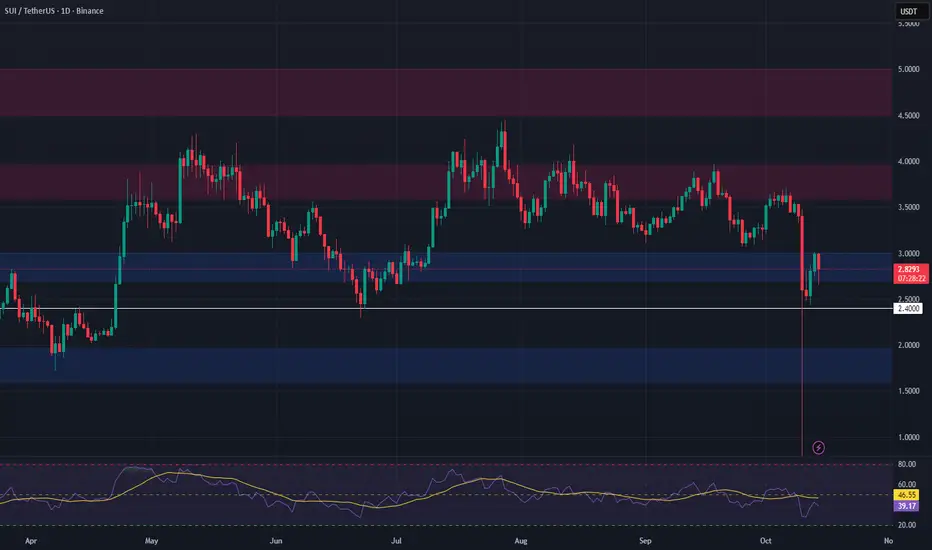
SUI – Swing Trade Setup from Key Support ZoneSUI is currently trading in a major support zone between $2.70 and $3.00, a level that has previously acted as a strong demand area. The price is consolidating here, and this could offer a high-probability long opportunity for swing traders watching for a potential bounce.
📈 Entry Zone: $2.70 – $3.
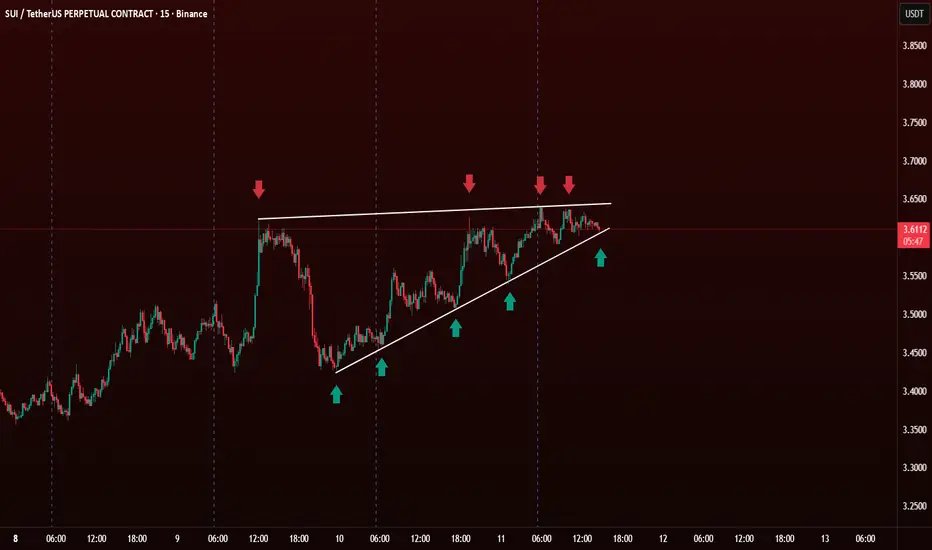
Ascending Triangle Pattern in Technical Analysis The Ascending Triangle is a bullish continuation pattern. It forms when the price creates higher lows (🔼) while facing consistent resistance at the same horizontal level (🔴).
🧐 How to Identify It
Flat Resistance Line 🔴
Price hits the same level multiple times and gets rejected.
This
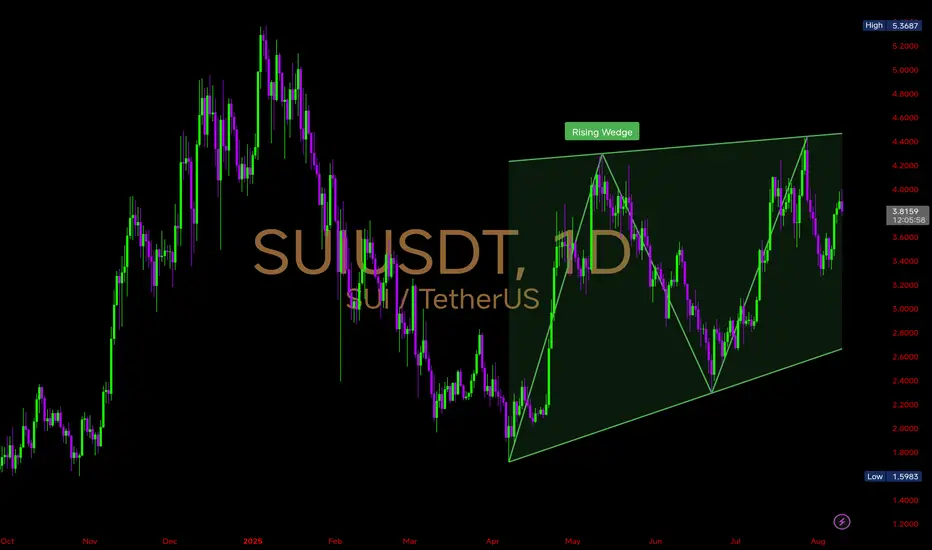
$SUI Daily Chart Analysis CRYPTOCAP:SUI Daily Chart Analysis
Price is currently trading inside a Rising Wedge pattern on the 1D timeframe — a structure that often signals potential trend exhaustion if broken to the downside, but can still extend higher within the channel before a breakout.
🔹Support: The lower wedge trend
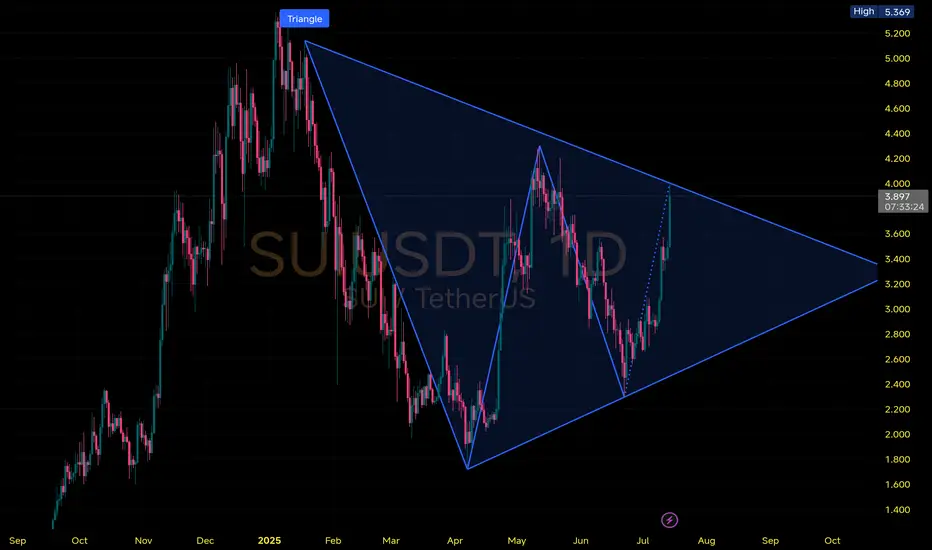
$SUI Daily Chart Analysis
Price is tightening within a large symmetrical triangle pattern on the 1D chart, signaling a major move brewing in the coming weeks.
🔹Price currently pushing toward upper trendline resistance near $4.00
🔸Upside Potential: Break above $4.20 could trigger a rally toward $5.00–$5.30+
🔹Pattern
See all ideas
Summarizing what the indicators are suggesting.
Oscillators
Neutral
SellBuy
Strong sellStrong buy
Strong sellSellNeutralBuyStrong buy
Oscillators
Neutral
SellBuy
Strong sellStrong buy
Strong sellSellNeutralBuyStrong buy
Summary
Neutral
SellBuy
Strong sellStrong buy
Strong sellSellNeutralBuyStrong buy
Summary
Neutral
SellBuy
Strong sellStrong buy
Strong sellSellNeutralBuyStrong buy
Summary
Neutral
SellBuy
Strong sellStrong buy
Strong sellSellNeutralBuyStrong buy
Moving Averages
Neutral
SellBuy
Strong sellStrong buy
Strong sellSellNeutralBuyStrong buy
Moving Averages
Neutral
SellBuy
Strong sellStrong buy
Strong sellSellNeutralBuyStrong buy
Displays a symbol's price movements over previous years to identify recurring trends.
Frequently Asked Questions
The current price of SUI / UST (SUI) is 1.52670000 USDT — it has risen 2.01% in the past 24 hours. Try placing this info into the context by checking out what coins are also gaining and losing at the moment and seeing SUI price chart.
SUI / UST price has fallen by −20.66% over the last week, its month performance shows a 3.42% increase, and as for the last year, SUI / UST has decreased by −65.26%. See more dynamics on SUI price chart.
Keep track of coins' changes with our Crypto Coins Heatmap.
Keep track of coins' changes with our Crypto Coins Heatmap.
SUI / UST (SUI) reached its highest price on Oct 20, 2024 — it amounted to 15.00000000 USDT. Find more insights on the SUI price chart.
See the list of crypto gainers and choose what best fits your strategy.
See the list of crypto gainers and choose what best fits your strategy.
SUI / UST (SUI) reached the lowest price of 0.36247000 USDT on Oct 19, 2023. View more SUI / UST dynamics on the price chart.
See the list of crypto losers to find unexpected opportunities.
See the list of crypto losers to find unexpected opportunities.
The safest choice when buying SUI is to go to a well-known crypto exchange. Some of the popular names are Binance, Coinbase, Kraken. But you'll have to find a reliable broker and create an account first. You can trade SUI right from TradingView charts — just choose a broker and connect to your account.
Crypto markets are famous for their volatility, so one should study all the available stats before adding crypto assets to their portfolio. Very often it's technical analysis that comes in handy. We prepared technical ratings for SUI / UST (SUI): today its technical analysis shows the sell signal, and according to the 1 week rating SUI shows the sell signal. And you'd better dig deeper and study 1 month rating too — it's sell. Find inspiration in SUI / UST trading ideas and keep track of what's moving crypto markets with our crypto news feed.
SUI / UST (SUI) is just as reliable as any other crypto asset — this corner of the world market is highly volatile. Today, for instance, SUI / UST is estimated as 6.14% volatile. The only thing it means is that you must prepare and examine all available information before making a decision. And if you're not sure about SUI / UST, you can find more inspiration in our curated watchlists.
You can discuss SUI / UST (SUI) with other users in our public chats, Minds or in the comments to Ideas.