Fiscal Policy Risk and Its Impact on Debt Markets1. Understanding Fiscal Policy Risk
Fiscal policy risk refers to the uncertainty that arises from government budgetary actions, particularly when those actions impact the broader economy and financial markets. It is associated with the possibility that fiscal decisions—such as changes in tax rates, spending programs, or public debt issuance—may have unintended consequences on economic stability, inflation, and investor confidence.
Key elements of fiscal policy risk include:
Budget Deficits and Surpluses: When a government spends more than it collects in revenue, it runs a budget deficit, often financed through borrowing. Persistent deficits can raise concerns about fiscal sustainability, potentially leading to higher interest rates on government bonds. Conversely, surpluses may reduce borrowing needs, positively impacting debt markets.
Public Debt Levels: High levels of government debt relative to GDP can create risk perceptions among investors. Large debt stocks increase the likelihood of fiscal stress, which can lead to credit rating downgrades, rising borrowing costs, and lower demand for sovereign bonds.
Policy Uncertainty: Uncertainty about future fiscal measures—such as potential tax hikes, spending cuts, or structural reforms—can deter investment and destabilize markets. Unclear or inconsistent policy can increase volatility in debt markets.
Structural Imbalances: Fiscal policies that fail to address structural economic weaknesses, such as inefficient subsidies, high social welfare spending, or poorly targeted tax systems, can amplify risks over time. Markets often respond to these imbalances by demanding higher yields on government securities.
2. Debt Markets: An Overview
Debt markets, also known as bond markets, are platforms where governments, corporations, and financial institutions issue debt securities to raise capital. These markets are critical for economic functioning, as they provide governments with financing for infrastructure, social programs, and other initiatives.
Key components of debt markets include:
Government Bonds: Issued by central governments to fund deficits and manage liquidity. They are generally considered low-risk investments, particularly in stable economies.
Corporate Bonds: Issued by corporations to finance expansion, operations, or refinancing existing debt. Risk levels vary based on the issuer’s creditworthiness.
Municipal Bonds: Issued by local governments to fund public projects. Risk is influenced by the local government's financial health.
Sovereign Debt in Emerging Markets: Often carries higher risk due to political instability, currency fluctuations, and weaker fiscal frameworks.
Interest rates, inflation expectations, credit ratings, and global capital flows heavily influence debt markets. Fiscal policy plays a crucial role in shaping all these factors.
3. Interaction Between Fiscal Policy and Debt Markets
The relationship between fiscal policy and debt markets is complex and multidimensional. Changes in fiscal policy directly affect the supply of government debt, investor perceptions of risk, and the overall interest rate environment.
Impact on Interest Rates:
When governments increase borrowing to finance deficits, the supply of bonds in the market rises. If demand does not keep pace, bond prices fall, and yields rise.
Conversely, a reduction in borrowing or fiscal consolidation can lower interest rates by reducing supply pressures.
Influence on Inflation Expectations:
Expansionary fiscal policy, characterized by high spending or tax cuts, can stimulate economic growth but may also lead to higher inflation if the economy is near full capacity.
Higher expected inflation erodes the real returns on fixed-income securities, prompting investors to demand higher yields.
Tight fiscal policies, on the other hand, may ease inflationary pressures, stabilizing bond markets.
Credit Ratings and Market Perception:
Credit rating agencies evaluate a country’s fiscal position, including debt-to-GDP ratios, budget deficits, and debt servicing capacity.
A deteriorating fiscal position can lead to downgrades, increasing borrowing costs and reducing demand for government bonds.
Investors closely monitor fiscal sustainability as a measure of default risk.
Crowding Out Effect:
Large-scale government borrowing can absorb financial resources that might otherwise flow into private investment.
This “crowding out” can push up interest rates in broader debt markets, affecting corporate financing costs.
Market Volatility and Investor Confidence:
Sudden or unexpected fiscal measures, such as emergency spending or tax reforms, can create uncertainty and volatility in debt markets.
Transparent and credible fiscal policy frameworks tend to reduce risk premiums demanded by investors.
4. Types of Fiscal Policy Risk Affecting Debt Markets
Sovereign Risk:
This is the risk that a government may default on its debt obligations.
High debt levels, fiscal mismanagement, and political instability increase sovereign risk, leading to higher yields and lower bond prices.
Inflation Risk:
Expansionary fiscal policy can fuel inflation, which erodes the purchasing power of fixed-income returns.
Inflation-indexed bonds or higher yields often compensate investors for this risk.
Interest Rate Risk:
Fiscal deficits often prompt central banks to adjust monetary policy to control inflation, indirectly influencing interest rates.
Rising interest rates reduce the value of existing bonds, especially long-duration securities.
Liquidity Risk:
Fiscal uncertainty can make government bonds less liquid, especially in emerging markets where investor confidence is fragile.
Political and Policy Risk:
Policy changes stemming from elections, regime shifts, or coalition governments can introduce unpredictability.
Investors often demand a premium for exposure to countries with unstable fiscal policy environments.
5. Managing Fiscal Policy Risk in Debt Markets
Governments and investors adopt several strategies to mitigate fiscal policy risks:
For Governments:
Maintaining sustainable debt levels relative to GDP.
Implementing credible fiscal rules, such as limits on deficits or debt growth.
Enhancing transparency in budget formulation and debt management.
Using debt instruments with staggered maturities to manage refinancing risks.
For Investors:
Diversifying portfolios across countries and asset classes.
Monitoring fiscal indicators like debt-to-GDP ratios, budget deficits, and contingent liabilities.
Hedging interest rate and currency risks using derivatives.
Investing in inflation-protected securities to offset potential erosion in returns.
6. Global Perspectives and Recent Trends
In the wake of crises such as the COVID-19 pandemic, fiscal policy has become even more central to debt market dynamics. Governments around the world increased spending dramatically, leading to elevated deficits and debt levels. This expansionary fiscal stance caused varying responses in debt markets:
In developed markets, strong institutions and high investor confidence kept borrowing costs relatively low despite rising debt.
In emerging markets, increased borrowing and fiscal imbalances often resulted in higher yields and capital outflows, reflecting heightened fiscal policy risk.
Additionally, global investors now closely monitor sovereign fiscal health as part of risk assessment for emerging markets. Ratings agencies, economic think tanks, and international organizations provide guidance on fiscal sustainability, directly influencing capital flows into debt markets.
7. Conclusion
Fiscal policy risk is a critical determinant of debt market performance. Government decisions regarding spending, taxation, and borrowing influence interest rates, inflation expectations, and investor confidence. For debt markets, both in developed and emerging economies, fiscal sustainability, transparency, and credibility are essential for stable bond yields and efficient capital allocation.
Understanding fiscal policy risk requires analyzing macroeconomic indicators, debt levels, political dynamics, and global economic trends. Investors must remain vigilant to fiscal developments, while governments must manage policy choices carefully to avoid adverse market reactions. Ultimately, the interplay between fiscal policy and debt markets underscores the delicate balance between economic growth objectives and financial stability.
Amazon.com, Inc.
No trades
What traders are saying

Part 1 Intraday Trading Master Class How Option Pricing Works
Option prices (premiums) depend on multiple factors:
1. Underlying Price Movement
Biggest factor.
CE rises when market rises.
PE rises when market falls.
2. Time to Expiry (Theta)
As expiry approaches, options lose value due to time decay.
Buyers suffer from theta.
Sellers benefit from theta.
3. Volatility (Vega)
Higher volatility = higher premiums.
4. Demand–Supply and Market Sentiment
Aggressive buying or selling changes premium rapidly.

As U.S. stocks head into the fourth quarter, investors are once (AMZN) seasonal advantages and structural market factors. Multiple bullish signals are currently aligning in favor of AMZN.
Santa Claus Rally Support
Historical data shows that from late November through early January, U.S. equities often experience what is known as the “Santa Claus Rally.” For Amazon, this period of explosive consumer demand is a dual catalyst for both revenue and share price.
Peak e-commerce quarter: Black Friday, Thanksgiving, and Christmas shopping consistently deliver Amazon its strongest retail performance of the year.
AWS demand boost: Year-end corporate IT spending and budget finalizations typically reinforce AWS revenue in Q4.
Quadruple Witching Resilience
Every quarter, options and futures contracts simultaneously expire in what’s called “quadruple witching.” While this normally increases volatility, recent history shows that if AMZN holds steady—or even edges higher—on these days, it reflects strong positioning and short covering, a bullish signal for the near term.
Fundamental and Flow Advantages
Beyond seasonality and trading day effects, AMZN has several structural tailwinds:
Prime ecosystem: Rising memberships fuel higher conversion, stronger average order value, and greater purchase frequency.
Advertising segment growth: Amazon’s ad business is expanding rapidly, carrying far higher margins than retail and becoming a profit driver.
Institutional support: Heavy weighting in major funds and indices ensures strong passive inflows during year-end rebalancing.
Short- to Mid-Term Outlook
If the U.S. macro backdrop continues with low inflation and steady consumer activity, AMZN is well-positioned to benefit from these converging forces in Q4:
Technically, the stock has been basing and could follow through with a seasonal uptrend.
From a positioning standpoint, institutions appear to be reloading on mega-cap tech winners.
Fundamentally, retail + cloud + advertising form a robust three-engine growth model.
With the “Santa Claus Rally” and “quadruple witching resilience” in play, AMZN’s fourth quarter stands out as particularly attractive for investors.

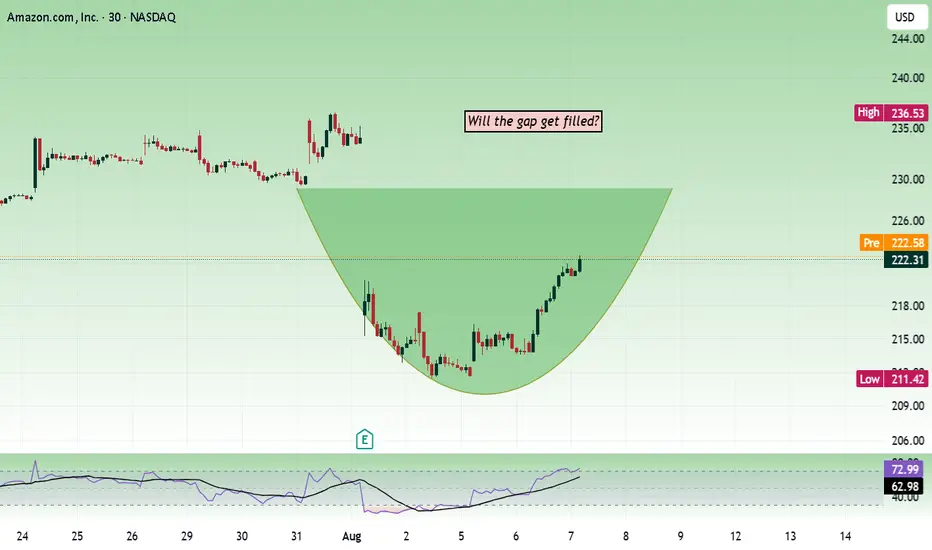
Amazon - Will the gap get filled?Price is sustaining an important level of 220. It can make the price move towards the 230 zone.
Below 220, the price will start to lose bullish strength. The next support is at 200–202, with 220 being a strong support.
Buy above 221.5 with the stop loss of 220 for the targets 223, 224.5, 227, and 228.5.
Always do your analysis before taking any trade.
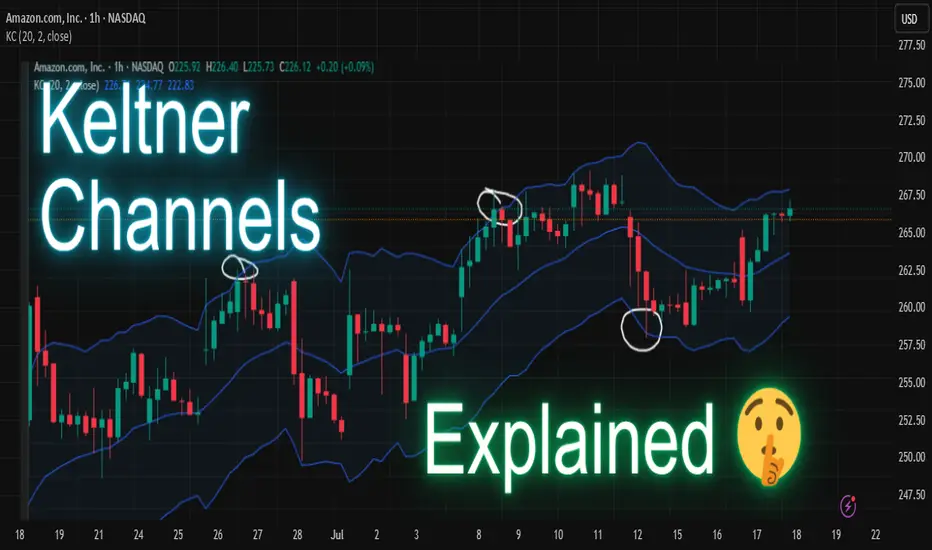
The Keltner Channels Indicator ExplainedDive into the world of Keltner Channels—a powerful volatility-based indicator used by traders to spot trends, reversals, and breakout opportunities! Let’s see how you can use it to enhance your trading decisions. 🚀
What Are Keltner Channels? 🤔
Keltner Channels consist of three lines plotted around a moving average:
- The middle line: An exponential moving average (EMA), typically 20 periods.
- The upper and lower bands: Set above and below the EMA, usually by a multiple of the Average True Range (ATR).
This setup helps identify potential overbought and oversold conditions as well as trend direction.
Setting Up Keltner Channels
1. Add the Keltner Channels indicator to your chart through TradingView’s indicators tab.
2. Default settings use a 20-period EMA with channels set at 2 ATR above and below.
Reading the Keltner Channels 👀
- Price Touches Upper Band: Indicates potential overbought conditions. Some traders look for a reversal or continuation of an uptrend.
- Price Touches Lower Band: Signals possible oversold conditions. Watch for reversals or strong downtrends.
- Price Stays Near Upper Band: Shows strong bullish momentum.
- Price Stays Near Lower Band: Suggests bearish momentum.
Common Trading Strategies
- Breakout Strategy: When price closes above the upper channel, it may signal a bullish breakout; below the lower channel could indicate a bearish breakout.
- Trend Reversal: If price consistently breaks the opposite band, it might hint at an upcoming reversal.
Tips for uses📝
- Combine Keltner Channels with other indicators like RSI or MACD for extra confirmation.
- Always use risk management—set stop losses and manage position size.
- Backtest any strategy before trading live.
Final Thoughts 🧠
Keltner Channels help traders better understand market volatility and trend potential. Experiment with their settings on different assets and timeframes to find what works best for you. Happy trading! 🚦✨
Amazon on shot high selling pressureThe chart depicts the weekly price movement of Amazon (AMZN) stock from 2022 to mid-2025, with a focus on a recent period around June 2025. Here’s an analysis based on the provided chart:
Historical Trend: The stock experienced a significant upward trend from 2022 to mid-2024, showing consistent growth with periodic corrections. This suggests strong bullish momentum over the long term.
Major Support Level: A key support zone is identified around the $916.18 to $919.18 range (highlighted in red). The price recently approached this level and appears to have found support, as indicated by the stabilization and slight upward movement after testing this zone.
Recent Price Action: After reaching a peak near $1,000, the stock experienced a sharp decline, entering a consolidation phase within a descending triangle pattern (highlighted in light blue). The price recently broke below the lower trendline of this pattern, suggesting potential bearish momentum.
Projected Movement: The chart includes a downward projection (blue arrow) indicating a possible further decline toward the $616.74 to $650.00 range if the bearish trend continues. This could represent a deeper correction or a test of a lower support level.
Volume and Indicators: The chart shows Bollinger Bands (BVC 880,260 H90,000 L85,200) and a closing price of $852,740 with a -29,380 (-3.33%) change, indicating increased volatility and a recent downward shift. However, specific volume or momentum indicators are not detailed enough for a precise assessment.
Outlook: The stock is currently at a critical juncture. If the $916.18 support holds, it may signal a reversal or consolidation. A break below this level could lead to a more significant decline toward the projected $616.74-$650.00 range. Monitoring price action around the support zone will be key.

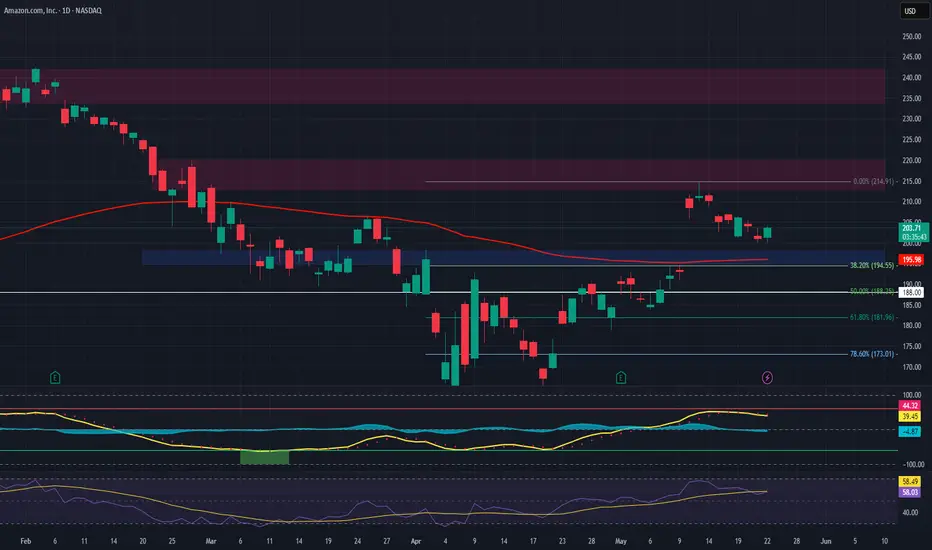
AMZN – Long Spot Trade Setup at Key SupportAmazon NASDAQ:AMZN is currently retracing into a major support level near $195, offering a solid long opportunity as broader market momentum holds up. This level has previously acted as a strong base, and price could now be positioning for a bullish continuation.
🔹 Entry Zone:
Around $195 (major support area)
🎯 Take Profit Targets:
🥇 $213 – $220 (previous resistance, aligns with local Fibonacci extension levels)
🥈 $234 – $242 (macro target zone if the broader market continues to rally)
🛑 Stop Loss:
Just below $188 (clear invalidation if key support breaks)
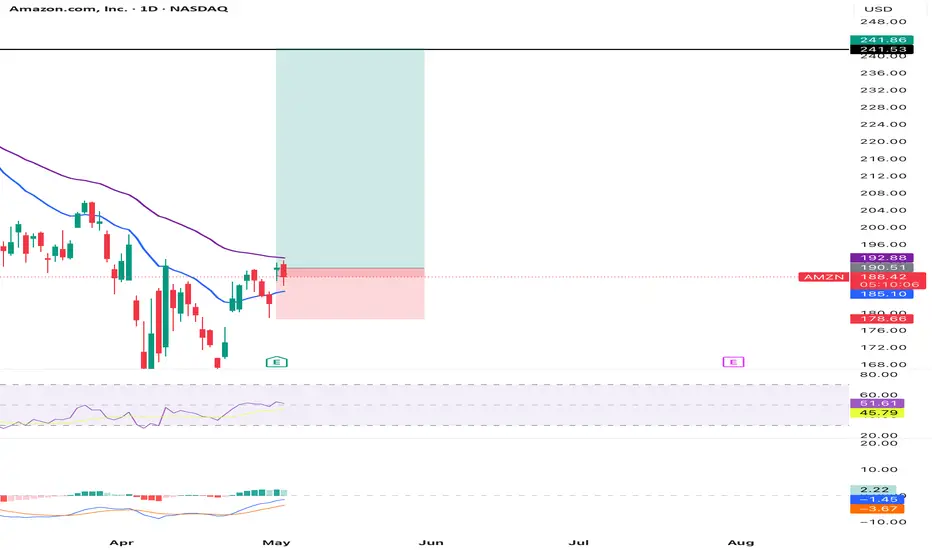
Amazon (AMZN) Swing Trade Analysis## Amazon (AMZN) Swing Trade Analysis
**Timeframe: 4H Chart (as per your screenshot, May 2, 2025)**
---
### **Technical Overview**
#### **1. Price Structure**
- **Trend:** The chart shows a recent reversal from a downtrend, with price making higher lows and attempting to break resistance around $190–$192.
- **Support:** Strong support is visible near $178.66 and a major support at $162.49.
- **Resistance/Target:** The green zone targets the $241.53–$241.86 area, which is a previous supply/resistance zone.
#### **2. Indicators**
- **RSI (Relative Strength Index):**
- Currently around 57–58, which is neutral-bullish and not overbought.
- Indicates there’s still room for upside before becoming overbought (>70).
- **MACD:**
- Bullish crossover recently, with the MACD line above the signal line and positive histogram.
- Suggests momentum is shifting to the upside.
#### **3. Risk/Reward**
- **Entry:** Around $189.67 (current price).
- **Stop Loss:** Below $178.66 (recent swing low/support).
- **Target:** $241.53–$241.86 (previous resistance).
- **Risk/Reward Ratio:**
- Risk: ~$11 (from $189.67 to $178.66)
- Reward: ~$52 (from $189.67 to $241.53)
- **R:R ≈ 1:4.7** - Excellent for swing trading.
#### **4. Volume & Volatility**
- Amazon is highly liquid, ensuring good fills and manageable slippage.
- The volatility is suitable for swing trading, with clear price swings and defined levels.
---
### **Why AMZN is Suitable for Swing Trading Now**
- **Clear Reversal Structure:** The downtrend has paused, and higher lows are forming-a classic swing setup.
- **Defined Support/Resistance:** Well-established levels allow for precise stop and target placement.
- **Strong Risk/Reward:** The setup offers a high R:R ratio, which is ideal for swing trades.
- **Momentum Confirmation:** Both RSI and MACD support a potential bullish move.
- **No Immediate Overbought Signal:** RSI is not yet overbought, so there’s room for the trade to develop.
- **Earnings Passed:** The last earnings event is behind, reducing the risk of surprise volatility.
---
### **Potential Risks**
- **If price fails to break $192–$195 resistance, a pullback to support ($178.66) is possible.**
- **Broader market weakness or negative news could invalidate the setup.**
- **Always use a stop loss as planned.**
---
## **Conclusion & Recommendation**
**Yes, AMZN is a strong candidate for a swing trade at this moment.**
- The technicals, risk/reward, and liquidity all align for a textbook swing setup.
- Enter above $190 with a stop below $178.66 and target $241+.
- Monitor for confirmation of breakout above $192–$195 for added conviction.
**(As always, manage your position size and risk according to your prop firm’s rules!)**
---
**Would you like a similar analysis for any other stock?**
Sources
image.jpg pplx-res.cloudinary.com
Amazon analysisAccording to chart pattern, Amazon could face a downfall as other companies doing well in field of AI. Yet, Amazon didn't announce anything about AI project and not developing infrastructure for the same.

$AMZN - Possible Inverse Head & Shoulders NASDAQ:AMZN - Possible Inverse Head & Shoulders - Measured Move $225 which lines up with 200 SMA (yellow line). Let's see if we can get a breakout.

$AMZN Forming a Bullish Hammer Candle and Oversold on the DailyNASDAQ:AMZN forming a Bullish Hammer candle on the Daily and oversold right. It's right under 100 SMA (white line) let's see if we can get a bounce here and break back above. I was happy to see it finish the day green after being down 2% on the day.

$AMZN is oversold on the daily The past few times NASDAQ:AMZN has been oversold on the daily have proven to be great entry points. We are close to a possible support line and could go even a little further to touch the 100 SMA (white line). I am starting to accumulate NASDAQ:AMZN shares as well as April 17 220 calls @ $7.95
If it does drop further I would look to add at the 100 SMA. However, I do think we could see a bounce soon. It's also around a 30 forward PE at these levels.

Amazon for 30% gain in 1.5 year.Cwh patter failed to reach target and stock showing the retrace which is showing potential to give the 30% return in 1-2 year.

AmznHopefully this is correct Wolf wave on Amzn
though BO came at 120 still 155 is imp level to cross

#AMZN $AMZN190 above breakout possible
189-190 small resistance zone which tested 4 time
now it is too much weak
195/200 easily test , above 200 will recheck chart again

Breakout and Breakout rester confirm on amazomBreakout and Breakout rester confirm on amazom which will take it to 164

AMZN bottoms have volume. BullishI think based on VPA, the last week or so of red was accumulation. Let's see if we get follow through now. Up above MA20 on daily chart, so we'll want to create support somewhere.
NFA just an observation

AMZN for shortMy view on this script Bearish.
Targetprice1. 184.80(1:2.5)
Targetprice2. 182.30(1:3.5)

Okay. This is my last post, but.Okay. This is my last post, but the replay feature is awesome so I'm putting predictions here right now.
AMZN flow came in today that surprised me, $270 calls for 2025 expires. I don't do leaps but I was already bullish on AMZN prior to hearing this. Papa Bezos prints.
NFA - This little line shows where the price could go before March 2025 ( imo )
Let's check back in January

AMZN to $200 and maybe 210 with momentumI'm pretty bullish here, sharp movements all with bullish bias, looks like a juicy setup if you have expiry. Good luck!
NFA - Not a Pro

AMZNCurrently, Amazon is in the buying zone, but if the red average indicated by the blue arrow is broken and we enter the green zone, the market will be in the selling phase.

Investment_ AmazonNamaste!
Amazon has corrected enough to look attractive to value investors. VI basically mean they will look for:
1. Low P/E ratio,
2. An long term up-trending stock (Amazon is that),
3. Fear in the markets, Etc.
Investors like Warren Buffet doesn't buy when the market is at all time high and people think it will keep going up in a straight line.
He and other value investors wait for an opportunity, when there is fear and it results in considerable fall in the stock prices. It's when they come in.
For Amazon, I can say with 100% confidence, value investors must be jumping in. This opportunity (because of correction) is rare and happens in 4-5 years approx. They are smart people and following them is a smarter decision. Amazon is definitely a buy, at current prices or at break of 118.
The most important rule in Investing is, never ever sell at a loss. There are only two possibilities in my opinion, either the company goes bankrupt, or you make money.
Disclaimer: Investment carries an element of financial risk. Investment does not guarantee a fixed return due to volatile nature of markets. Please do your due-diligence before investing. You are solely responsible for your decisions.

AMAZON BEARISH VIEWAmazon is anticipated to be in wave 5 of primary degree, nearing its conclusion. A potential decline from the current market price to the range of 115 - 100 is expected.
